Medical Equipment Financing Market Size and Share
Market Overview
| Study Period | 2020 - 2031 |
|---|---|
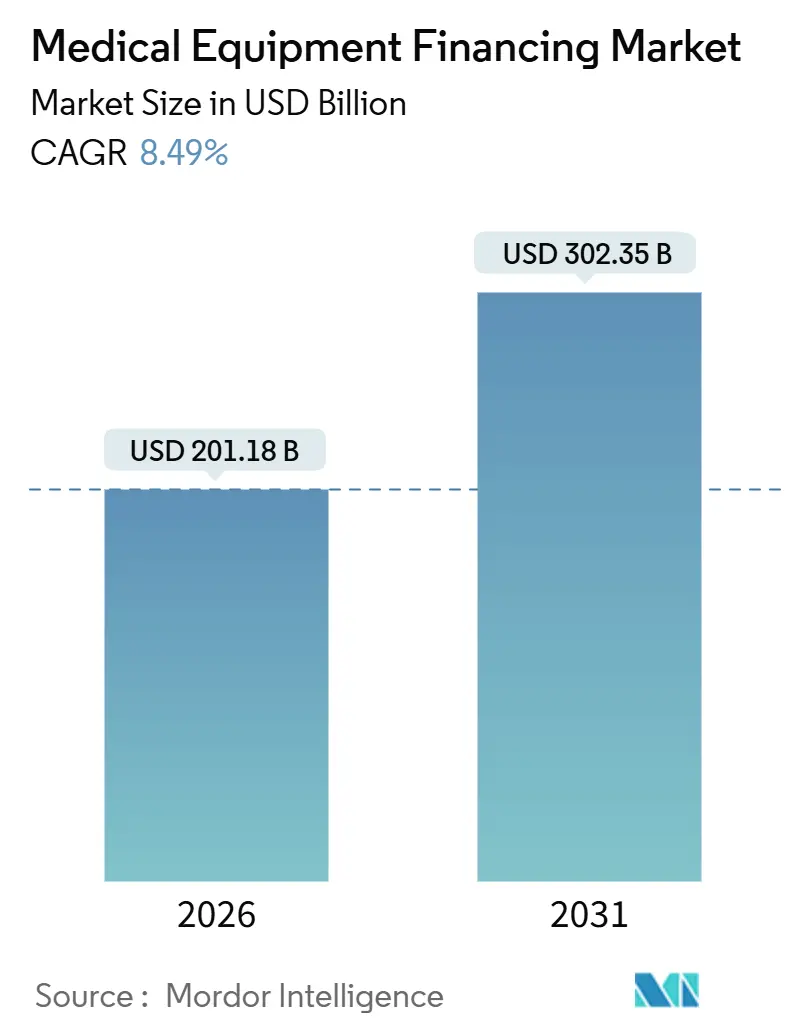
| Market Size (2026) | USD 201.18 Billion |
| Market Size (2031) | USD 302.35 Billion |
| Growth Rate (2026 - 2031) | 8.49% CAGR |
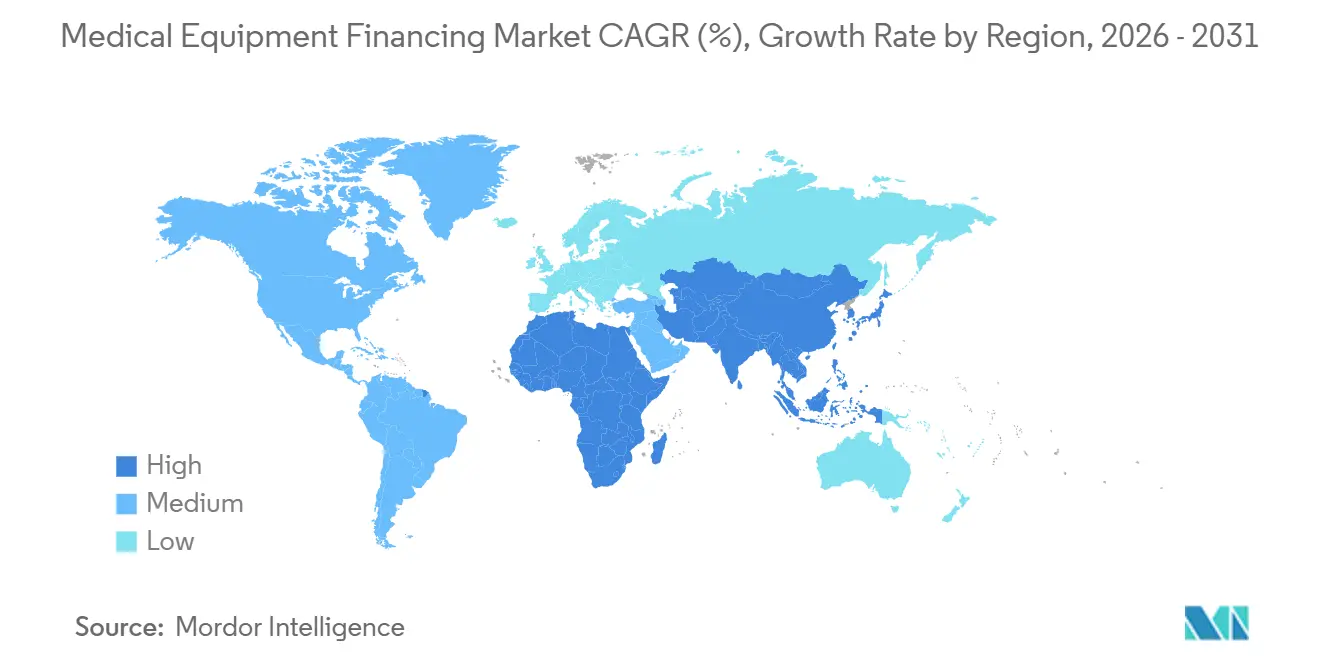
| Fastest Growing Market | Asia Pacific |
| Largest Market | North America |
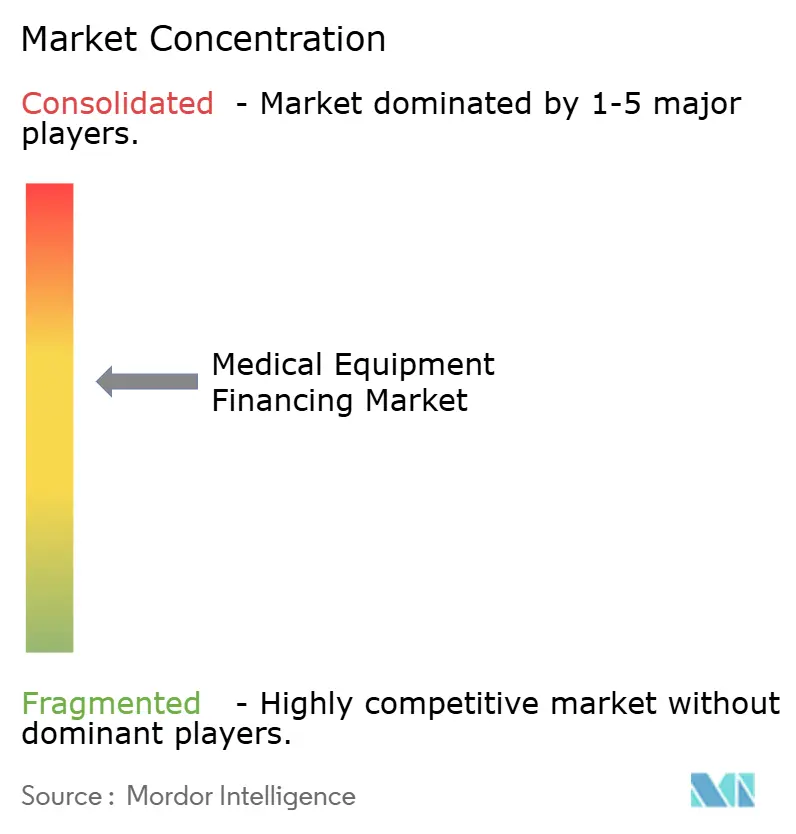
| Market Concentration | Medium |
Major Players *Disclaimer: Major Players sorted in no particular order Image © Mordor Intelligence. Reuse requires attribution under CC BY 4.0. | |
Medical Equipment Financing Market Analysis by Mordor Intelligence
The Medical Equipment Financing Market size is estimated at USD 201.18 billion in 2026, and is expected to reach USD 302.35 billion by 2031, at a CAGR of 8.49% during the forecast period (2026-2031).
Robust expansion is unfolding as hospitals, ambulatory centers, and laboratories shift away from outright capital purchases toward flexible structures that convert large upfront costs into predictable operating‐period outlays. Operating leases continue to dominate aggregate volume, yet outcome-linked pay-per-use contracts that bundle uptime guarantees with AI-driven predictive maintenance are scaling quickly, especially for imaging and robotic platforms. Rapid technology refresh cycles, reimbursement pressure, and the appeal of off-balance-sheet liquidity are supporting momentum, while captive finance arms leverage direct sales channels to underwrite credit risk at lower cost. Competition remains intense, although recent acquisitions signal a gradual flight to scale in asset management and remarketing capabilities.
Key Report Takeaways
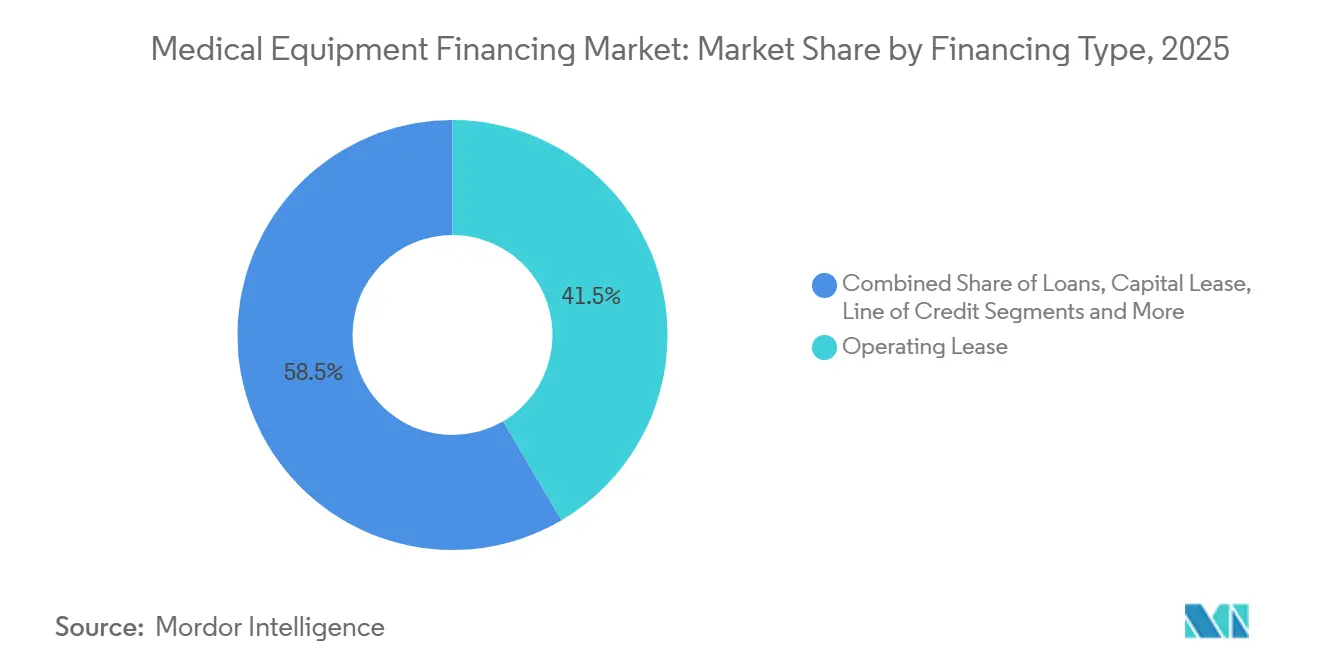
- By financing type, operating leases held 41.54% of the medical equipment financing market share in 2025, while pay-per-use subscriptions are advancing at a 12.77% CAGR through 2031.
- By equipment condition, new systems captured 56.35% of the medical equipment financing market size in 2025; refurbished assets are growing at an 11.43% CAGR to 2031.
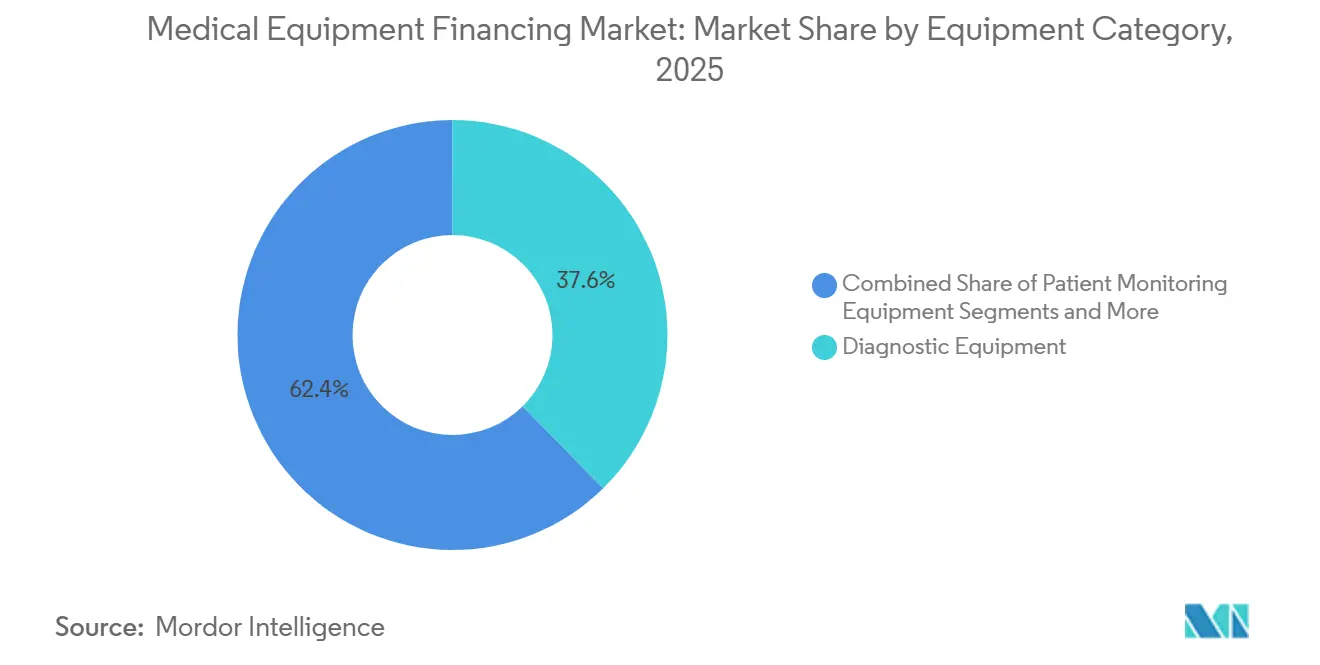
- By equipment category, diagnostic modalities led with 37.63% revenue share in 2025, whereas therapeutic systems are on track for an 11.11% CAGR to 2031.
- By end-user, hospitals and health systems controlled 53.65% of demand in 2025; ambulatory surgical centers are expanding fastest at 10.67% CAGR through 2031.
- North America retained 38.74% of global revenue in 2025, while Asia-Pacific is forecast to post the highest CAGR of 10.36% to 2031.
Note: Market size and forecast figures in this report are generated using Mordor Intelligence’s proprietary estimation framework, updated with the latest available data and insights as of January 2026.
Global Medical Equipment Financing Market Trends and Insights
Drivers Impact Analysis*
| Driver | (~) % Impact on CAGR Forecast | Geographic Relevance | Impact Timeline |
|---|---|---|---|
| High Acquisition Cost of Advanced Medical Devices | +1.8% | North America, Europe | Medium term (2-4 years) |
| Rapid Obsolescence Cycles in Imaging & Robotic Surgery Systems | +1.5% | Global, early uptake in North America & Asia-Pacific | Short term (≤ 2 years) |
| Expansion of Healthcare Infrastructure in Emerging Economies | +2.1% | Asia-Pacific core, spill-over to Middle East & Africa | Long term (≥ 4 years) |
| Subscription / Pay-Per-Use Models with AI-Driven Uptime Guarantees | +1.3% | North America, Western Europe, expanding to Latin America & Asia-Pacific | Medium term (2-4 years) |
| GPO-Centric Bulk Procurement Demanding Bundled Financing | +0.9% | North America; emerging in Europe & select Asia-Pacific markets | Medium term (2-4 years) |
| Tariff-Induced Shift Toward Domestically Sourced Finance | +0.7% | United States and China; secondary in EU & India | Short term (≤ 2 years) |
| Source: Mordor Intelligence | |||
High Acquisition Cost of Advanced Medical Devices
Premium imaging scanners and robotic surgery platforms regularly exceed USD 1 million per unit, straining capital budgets for community hospitals and outpatient centers. MRI systems offered by leading manufacturers range from USD 200,000 to USD 4.5 million depending on field strength and configuration, while Intuitive Surgical’s da Vinci requires comparable outlays. In January 2025, Intuitive broadened access by rolling out mix-and-match lease, loan, and subscription packages that align cash obligations with procedure ramp-up schedules, redistributing credit exposure from providers to OEMs and squeezing margins for independent lessors.[1]Intuitive Surgical, “Flexible Financing for Acquiring Robotic Surgery Technology,” intuitive.com
Rapid Obsolescence Cycles in Imaging & Robotic Surgery Systems
Software-driven upgrades and AI-powered reconstruction algorithms shorten replacement intervals for MRI and CT scanners to as little as five years. Siemens Healthineers and Philips now embed lifecycle software and guaranteed performance clauses into ten-year managed service contracts, transferring obsolescence risk away from providers. Siemens’ EUR 40 million agreement with St. Vincent’s Private Hospital in August 2024 rolled installation, maintenance, and future refreshes into one predictable payment stream.[2]Siemens Healthineers, “St. Vincent’s Private Hospital Partners with Siemens Healthineers,” siemens-healthineers.com
Expansion of Healthcare Infrastructure in Emerging Economies
China, India, and Southeast Asia are directing multilateral and public-private resources toward hospital construction, yet gaps between demand and fiscal capacity remain wide. The Asian Infrastructure Investment Bank’s 2025 health strategy calls for blended finance and vendor partnerships to accelerate device procurement and maintenance capability building. Rising life expectancy and chronic-disease prevalence underpin a long-run pipeline of financing opportunities.
Subscription / Pay-Per-Use Models with AI-Driven Uptime Guarantees
Predictive analytics platforms such as GE HealthCare’s OnWatch Predict enable performance-based contracts that peg fees to uptime or scan volumes. These agreements convert fixed capital outlays into variable costs and shift service responsibility to vendors, reducing demand for traditional leases while favoring OEMs with deep service footprints.
Restraints Impact Analysis*
| Restraint | (~) % Impact on CAGR Forecast | Geographic Relevance | Impact Timeline |
|---|---|---|---|
| Availability of Low-Priced Refurbished Equipment | -0.8% | North America & Europe, emerging Asia-Pacific | Medium term (2-4 years) |
| Interest-Rate Volatility Raising Lease Costs | -1.1% | Global, most acute in North America & Europe | Short term (≤ 2 years) |
| New Lease-Accounting Rules Reducing Off-Balance-Sheet Appeal | -0.6% | Global under IFRS 16 & ASC 842 | Long term (≥ 4 years) |
| Asset-Recovery Risk in Rural & Home-Care Deployments | -0.4% | North America & Europe; expanding Asia-Pacific corridors | Medium term (2-4 years) |
| Source: Mordor Intelligence | |||
Interest-Rate Volatility Raising Lease Costs
Central-bank tightening through 2024 lifted funding costs and forced repricing of floating-rate portfolios. The Equipment Leasing & Finance Association’s December 2025 CapEx Finance Index projected that 2026 demand will benefit from recent rate cuts, yet many providers remain locked into higher-cost agreements until maturities cycle through.[3]Equipment Leasing & Finance Association, “CapEx Finance Index November 2025,” elfaonline.org
New Lease-Accounting Rules Reducing Off-Balance-Sheet Appeal
IFRS 16 and ASC 842 require right-of-use asset recognition, erasing a long-standing incentive for operating leases. The IFRS Foundation’s January 2024 interpretation confirmed that most medical equipment agreements now appear as liabilities, increasing reported leverage and prompting shorter terms or pure service contracts that avoid capitalization.
*Our forecasts treat driver/restraint impacts as directional, not additive. The impact forecasts reflect baseline growth, mix effects, and variable interactions.
Segment Analysis
By Financing Type: Subscription Models Scale as Ownership Declines
The medical equipment financing market size for operating leases reached USD 83.6 billion in 2025, equal to 41.54% of total value, while pay-per-use subscriptions are pacing at a 12.77% CAGR that could lift their share above 20% by 2031. Subscriptions resonate most strongly for robotic surgery platforms, advanced imaging, and health-IT bundles where rapid obsolescence renders ownership uneconomical. Capital leases and secured loans remain critical for fixed installations with long economic lives, yet their share is drifting downward as providers prioritize liquidity and technological agility. Traditional lessors confront yield compression as OEM-backed structures bundle hardware, software, disposables, and maintenance into one payment that blunts third-party differentiation.
Large integrated delivery networks retain appetite for loans and capital leases, leveraging strong credit ratings to secure low-cost funds and capture depreciation tax benefits. Smaller ambulatory centers favor operating leases to match equipment costs with case revenue. Working-capital lines of credit play an episodic role, smoothing cash swings tied to reimbursement cycles or seasonal procedure lulls. Policy adjustments, such as the Centers for Medicare & Medicaid Services’ December 2024 DMEPOS fee update, directly influence borrowing capacity and collateral valuations for durable equipment suppliers.


By Equipment Condition: Refurbished Systems Earn Mainstream Acceptance
In 2025, new installations controlled 56.35% of the medical equipment financing market size, but certified pre-owned devices are expanding at 11.43% CAGR as OEM programs from STERIS, GE HealthCare, Siemens Healthineers, and Philips deliver factory warranties and lifecycle service that narrow perceived quality gaps. Certified channels allow lessors to assign higher residual values, enabling longer amortization schedules at competitive rates. Developed secondary markets in North America and Europe offer reliable exit paths, though import restrictions in parts of Asia and Latin America still dampen collateral liquidity.
Rental fleets address short-term surges, clinical trials, or disaster relief, commanding premium pricing due to logistics and maintenance intensity. Financing terms for refurbished assets remain shorter on average, and lenders often stipulate ISO 13485 compliance to safeguard resale prospects. As circular-economy policies gain traction, lenders anticipate that used-device markets will deepen, supporting residual risk mitigation and stimulating volume in the medical equipment financing market.
By Equipment Category: Therapeutic Systems Accelerate
Diagnostic imaging retained 37.63% of 2025 revenue, anchored by MRI, CT, and automated laboratory platforms that underpin hospital revenue streams. Therapeutic equipment is on track for an 11.11% CAGR as robotic surgery, linear accelerators, and advanced infusion technologies move through refresh cycles. Patient-monitoring devices, including telemetry and remote chronic-care systems, captured a mid-teens share and are growing in tandem with telehealth reimbursement continuity.
Robotic surgery exemplifies demand elasticity: Intuitive Surgical’s 2025 financing suite aligns monthly charges with utilization, trimming payback horizons for ambulatory surgical centers and community hospitals. Diagnostic upgrades are propelled by AI algorithms that slash scan times and radiation doses, rendering last-generation units clinically obsolete. Durable medical equipment faces fee-schedule compression under Medicare’s competitive bidding, fostering price sensitivity and driving suppliers to seek flexible working-capital lines.
By End-User: Ambulatory Centers Outpace Hospitals
Hospitals and health systems represented 53.65% of medical equipment financing market share in 2025, reflecting their scale and need for multi-modality suites. Yet ambulatory surgical centers are expanding at 10.67% CAGR as payers steer procedures to lower-cost sites, shortening capital payback. Diagnostic imaging chains and specialty clinics leverage GPO contracts to combine procurement, financing, and service, enhancing cash predictability.
Home-health operators are enlarging device fleets for remote patient monitoring and oxygen therapy, although asset-recovery logistics elevate lender risk. Laboratories and research institutes secure long-term reagent-rental or managed-equipment agreements that convert capital outlays into consumable-linked service fees. Across all cohorts, rising reimbursement scrutiny reinforces demand for financing structures that tie payments to usage and performance metrics, a trend that boosts overall velocity in the medical equipment financing market.
Geography Analysis
North America accounted for 38.74% of global revenue in 2025, underpinned by deep capital markets, mature GPO networks, and well-capitalized captive finance channels. Operating lease penetration exceeds 60% for imaging and robotics, reflecting close regulatory scrutiny on asset utilization and reimbursement. U.S. interest-rate volatility, however, temporarily curbed originations in late 2024, prompting providers to request floating-to-fixed hedges within contracts. Canada’s provincial health authorities are piloting bundled procurement frameworks that merge financing and service for small community hospitals, a shift expected to support subscription uptake.
Europe’s single-payer ecosystems encourage pooled financing and long-term managed-equipment services. Fiscal pressures in Southern and Eastern member states limit outright purchases, pushing procurement authorities toward public-private partnerships with guaranteed refresh cycles. In May 2025, the United Kingdom’s National Health Service introduced a framework that consolidates equipment and consumables into a performance-based agreement across twenty trusts, reallocating obsolescence and uptime risk to vendors.
Asia-Pacific is set to lead growth at a 10.36% CAGR through 2031 as China and India drive hospital network expansion to serve aging populations and rising chronic-disease prevalence. Multilateral development banks facilitate blended-finance packages that anchor repayment on clinical-output targets rather than collateral value. In Southeast Asia, private hospital chains are adopting subscription models to avoid capital lock-up, while local banks co-lend alongside OEM captives to mitigate foreign-exchange risk.
The Middle East & Africa region centers on Gulf Cooperation Council states, where sovereign wealth funds inject equity into large medical-city projects. Aster DM Healthcare’s April 2024 corporate reorganization, backed by Fajr Capital, underlines private-equity appetite for integrated care platforms that bundle facility, equipment, and service financing. South America remains fragmented, with Brazil’s decentralized public-procurement structure complicating scale efficiencies; nevertheless, World Bank governance initiatives aim to streamline tendering and encourage lifecycle financing.

Competitive Landscape
The medical equipment financing market exhibits moderate concentration. Captive finance units of GE HealthCare, Siemens Healthineers, and Philips, leveraging exclusive access to OEM sales pipelines and service infrastructures. Independent lessors such as De Lage Landen and CIT compete on multi-vendor flexibility, secondary-market expertise, and niche asset coverage but face yield compression as OEMs push direct subscription offerings.
Consolidation is gathering pace. CHG-MERIDIAN’s December 2024 purchase of Meridian Leasing expanded its North American medical portfolio, signaling a pivot toward scale in remarketing and lifecycle analytics. Owens & Minor’s USD 1.36 billion acquisition of Rotech Healthcare strengthened its home-medical-equipment reach, creating cross-selling potential with hospital supply contracts. Private equity remains active: THL Partners completed the take-private of Agiliti in February 2024, and Carlyle agreed in August 2024 to acquire Baxter’s kidney-care spinoff Vantive for USD 3.8 billion, underscoring investor confidence in asset-heavy service platforms.
Strategic initiatives center on AI-enabled uptime guarantees, embedded analytics, and integrated consumable financing that widen switching costs. Larger players invest heavily in remote monitoring infrastructure to fulfill performance-based SLAs, while smaller lessors emphasize white-label partnerships and geographic specialization.
Medical Equipment Financing Industry Leaders
National Technology Leasing Corp.
Siemens Financial Services
GE HealthCare Financial Services
De Lage Landen International (DLL)
National Technology Leasing Corp.
- *Disclaimer: Major Players sorted in no particular order

Recent Industry Developments
- January 2026: Beautifi partnered with Travelers Financial Solutions to launch an underwriting facility that extends flexible equipment-finance approvals to Canadian clinics, strengthening cash-flow alignment and accelerating device adoption.
- December 2025: Gilde Healthcare secured acquisition financing for MEG Medical Equipment GmbH, positioning the company to enter new specialty segments and pursue bolt-on deals.


Global Medical Equipment Financing Market Report Scope
Medical equipment financing refers to a specialized business loan or leasing arrangement that enables healthcare providers to acquire, upgrade, or repair medical technology, such as MRI machines and hospital beds, without incurring high upfront costs.
The Medical Equipment Financing Market Report is segmented by Financing Type, Equipment Condition, Equipment Category, End User, and Geography. By Financing Type, the market is segmented into Loans, Operating Lease, Capital Lease, Line of Credit, and Pay-per-use Subscription. By Equipment Condition, the market is segmented into New Equipment, Rental Equipment, and Refurbished/Used Equipment. By Equipment Category, the market is segmented into Diagnostic Equipment, Therapeutic Equipment, Patient Monitoring Equipment, Durable Medical Equipment, and Others. By End User, the market is segmented into Hospitals & Health Systems, Diagnostic Centers, Clinics, Ambulatory Surgical Centers, Home-health Providers, and Laboratories & Research Institutes. By Geography, the market is segmented into North America, Europe, Asia-Pacific, Middle East & Africa, and South America. The market report also covers the estimated market sizes and trends for 17 countries across major regions globally. Market Forecasts are Provided in Terms of Value (USD).
| Loans |
| Operating Lease |
| Capital Lease |
| Line of Credit |
| Pay-per-use Subscription |
| New Equipment |
| Rental Equipment |
| Refurbished / Used Equipment |
| Diagnostic Equipment |
| Therapeutic Equipment |
| Patient Monitoring Equipment |
| Durable Medical Equipment |
| Others |
| Hospitals & Health Systems |
| Diagnostic Centers |
| Clinics |
| Ambulatory Surgical Centers |
| Home-health Providers |
| Laboratories & Research Institutes |
| North America | United States |
| Canada | |
| Mexico | |
| Europe | Germany |
| France | |
| United Kingdom | |
| Italy | |
| Spain | |
| Rest of Europe | |
| Asia-Pacific | China |
| Japan | |
| India | |
| South Korea | |
| Australia | |
| Rest of Asia-Pacific | |
| Middle East & Africa | GCC |
| South Africa | |
| Rest of Middle East & Africa | |
| South America | Brazil |
| Argentina | |
| Rest of South America |
| By Financing Type | Loans | |
| Operating Lease | ||
| Capital Lease | ||
| Line of Credit | ||
| Pay-per-use Subscription | ||
| By Equipment Condition | New Equipment | |
| Rental Equipment | ||
| Refurbished / Used Equipment | ||
| By Equipment Category | Diagnostic Equipment | |
| Therapeutic Equipment | ||
| Patient Monitoring Equipment | ||
| Durable Medical Equipment | ||
| Others | ||
| By End-user | Hospitals & Health Systems | |
| Diagnostic Centers | ||
| Clinics | ||
| Ambulatory Surgical Centers | ||
| Home-health Providers | ||
| Laboratories & Research Institutes | ||
| By Geography | North America | United States |
| Canada | ||
| Mexico | ||
| Europe | Germany | |
| France | ||
| United Kingdom | ||
| Italy | ||
| Spain | ||
| Rest of Europe | ||
| Asia-Pacific | China | |
| Japan | ||
| India | ||
| South Korea | ||
| Australia | ||
| Rest of Asia-Pacific | ||
| Middle East & Africa | GCC | |
| South Africa | ||
| Rest of Middle East & Africa | ||
| South America | Brazil | |
| Argentina | ||
| Rest of South America | ||


Key Questions Answered in the Report
What is the projected value of the medical equipment financing market in 2031?
The market is forecast to reach USD 302.35 billion by 2031, reflecting an 8.49% CAGR.
Which financing structure is growing fastest?
Pay-per-use subscription agreements are expanding at a 12.77% CAGR through 2031 as providers seek outcome-aligned payments.
Why are refurbished devices gaining traction?
Certified pre-owned programs from OEMs now offer warranty parity and predictable service, enabling 11.43% CAGR growth in financed refurbished assets.
Which region will lead growth over the next five years?
Asia-Pacific is expected to post the highest CAGR at 10.36% amid hospital construction and blended-finance initiatives.
How do new lease-accounting standards affect borrowers?
IFRS 16 and ASC 842 place most leases on balance sheets, raising reported leverage and prompting shorter, more flexible agreements.
Page last updated on:


