
Marketing Mix Modeling Software Market Size and Share
Market Overview
| Study Period | 2020 - 2031 |
|---|---|
| Market Size (2026) | USD 2.23 Billion |
| Market Size (2031) | USD 4.22 Billion |
| Growth Rate (2026 - 2031) | 13.61 % |
| Fastest Growing Market | Asia-Pacific |
| Largest Market | North America |
| Market Concentration | Medium |
Major Players *Disclaimer: Major Players sorted in no particular order Image © Mordor Intelligence. Reuse requires attribution under CC BY 4.0. | |
Marketing Mix Modeling Software Market Analysis by Mordor Intelligence
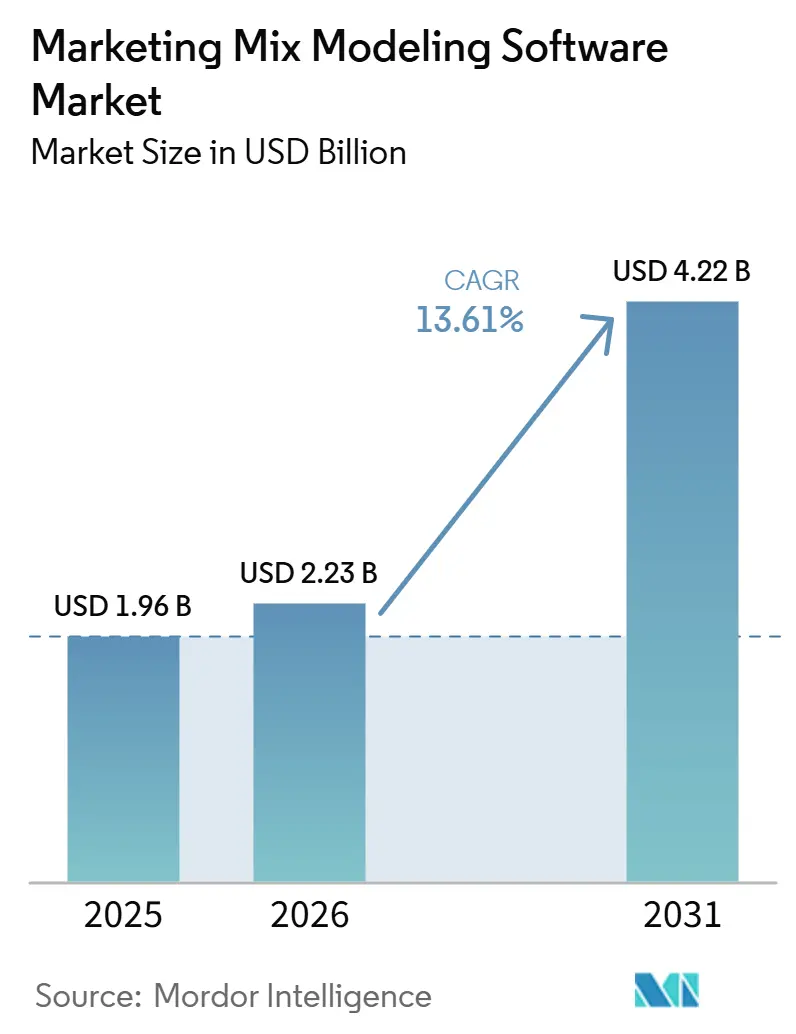
The marketing mix modeling software market size is projected to expand from USD 1.96 billion in 2025 and USD 2.23 billion in 2026 to USD 4.22 billion by 2031, registering a CAGR of 13.61% between 2026 to 2031. The marketing mix modeling software market is moving away from periodic consulting assignments toward continuously updated cloud platforms that integrate into regular planning and budgeting cycles. Privacy rules and weaker user-level tracking have made aggregate statistical measurement more necessary for advertisers who need a cross-channel view of performance. The marketing mix modeling software market is also widening because open-source Bayesian frameworks have lowered the entry barrier for brands that previously could not justify large consulting budgets. Mature adoption in North America and faster digital advertising expansion in Asia-Pacific are shaping where vendors are focusing their investments, partnerships, and product localization. Competition is tightening around proprietary data depth, integration breadth, scenario planning, and decision automation, while model reliability at low spend levels and persistent data integration work continue to slow adoption in part of the addressable base.
Key Report Takeaways
- By component, software held 76.18% share in 2025, while services are projected to expand at a 15.77% CAGR through 2031.
- By deployment, cloud-based deployment accounted for 79.61% share in 2025 and is projected to record the fastest growth at 14.36% CAGR through 2031.
- By enterprise size, large enterprises held 68.43% share in 2025, while small and medium enterprises are projected to grow at a 15.94% CAGR through 2031.
- By end user industry, consumer packaged goods accounted for 24.65% share in 2025, while retail and e-commerce is projected to expand at a 16.83% CAGR through 2031.
- By geography, North America held 34.61% of the marketing mix modeling software market in 2025, while Asia-Pacific is projected to grow at a 17.39% CAGR through 2031.
Note: Market size and forecast figures in this report are generated using Mordor Intelligence’s proprietary estimation framework, updated with the latest available data and insights as of January 2026.
Market Trends and Insights
Drivers Impact Analysis of Marketing Mix Modeling Software Market*
| DRIVER | (~) % IMPACT ON CAGR FORECAST | GEOGRAPHIC RELEVANCE | IMPACT TIMELINE |
|---|---|---|---|
| Privacy-First Measurement Shift | +2.4% | Global, with highest intensity in EU, North America, and APAC digital-first markets | Short term (≤ 2 years) |
| AI Search and Answer Engine Traffic as a New Model Variable | +2.0% | Global, with early gains concentrated in North America, UK, and ANZ markets | Short term (≤ 2 years) |
| Budget Reallocation Pressure Toward Higher-Accountability Channels | +1.6% | Global, strongest in North America and Europe where CFO oversight of marketing budgets is most formalized | Medium term (2-4 years) |
| Demand for Finance-Ready Scenario Planning | +1.3% | Global, with concentration in large enterprise markets across North America, Germany, and the UK | Medium term (2-4 years) |
| Expansion of Incrementality-Calibrated MMM Workflows | +1.0% | North America and Europe core, spill-over to APAC and MEA digital-first markets | Medium term (2-4 years) |
| Methodology Transparency as a Purchase Criterion | +0.8% | Global | Long term (≥ 4 years) |
| Source: Mordor Intelligence | |||
Privacy-First Measurement Shift
The marketing mix modeling software market is gaining force from the steady erosion of cookie-based and user-level attribution systems, which no longer provide the same level of dependable cross-channel evidence for many advertisers. Major privacy frameworks and stricter data minimization practices have pushed brands toward aggregate measurement methods that do not depend on personal identifiers or persistent tracking. Apple’s App Tracking Transparency policy added to this shift because mobile-first advertisers lost a large part of the signal that had once supported detailed user-path analysis. In this setting, marketing mix modeling fits the new environment because it works through statistical inference on aggregated spend and outcome data rather than individual identities. Google’s January 2025 release of Meridian gave the marketing mix modeling software market a major validation point because it positioned privacy-safe Bayesian modeling as a production-grade option that teams could deploy more broadly. Better compliance programs are also improving first-party data discipline, which means many brands are feeding cleaner and more structured inputs into models than they did a few years ago.
AI Search and Answer Engine Traffic as a New Model Variable
The marketing mix modeling software market is also being shaped by the rise of AI-assisted discovery, where platforms such as Google AI Overviews, Perplexity, and ChatGPT search influence consideration before a user ever clicks a traditional ad. That change creates a measurement gap because some demand that once appeared as a direct paid-search outcome now develops through assisted discovery journeys that are harder to trace with older channel frameworks. Brands that do not model this traffic separately risk understating the role of content, organic visibility, and public relations in revenue generation, which can distort budget allocation across the funnel. A 2026 peer-reviewed paper in Future Business Journal argued that AI-driven discovery requires a new feedback loop between measurement, resource allocation, and organizational learning, which aligns closely with the current direction of the marketing mix modeling software market.[1]Salesforce, “Introducing Marketing Intelligence,” Salesforce, salesforce.com Google’s Scenario Planner for Meridian, introduced in February 2026, supports this shift because it brings what-if budget modeling into a more accessible interface for teams that need to test changing channel behavior in near real time. As AI-assisted discovery takes a larger share of the path to purchase, vendors that can operationalize these signals inside decision workflows are likely to gain an advantage.
Budget Reallocation Pressure Toward Higher-Accountability Channels
The marketing mix modeling software market is benefiting from tighter scrutiny over marketing budgets, especially where finance leaders want clearer proof of incremental return before approving spend. Tighter operating conditions through the last several planning cycles have moved return verification from a post-campaign exercise to a core part of budget governance at many large organizations. This has changed software evaluation because buyers now want systems that connect media choices with business outcomes rather than channel dashboards alone. Think with Google’s business measurement material shows that organizations are using marketing mix modeling not only to review past performance but also to link media investment with broader enterprise goals and planning decisions. That shift is pushing the marketing mix modeling software market closer to finance workflows, where scenario planning, risk trade-offs, and resource allocation are discussed in the same language as other investment decisions. Vendors that can frame marketing spend in terms that CFOs and CMOs both accept are therefore gaining relevance in larger buying cycles.
Demand for Finance-Ready Scenario Planning
The marketing mix modeling software market is moving beyond backward-looking reporting and toward forward-looking budget planning that finance teams can use directly. Many enterprises no longer want model outputs that stop at channel contribution because budget owners need to compare marketing choices with other uses of capital inside the company. That means software has to translate model results into formats tied to revenue, customer acquisition cost, profitability, and different spending paths instead of only historical return on ad spend. Lifesight’s causal marketing mix modeling offer reflects this demand because it presents profit and customer acquisition cost curves across channels and scenarios, which supports joint review by marketing and finance teams. Google’s Meridian Scenario Planner also fits this direction because it reduces the need for an intermediary data science step when teams want to test budget alternatives quickly. As a result, the marketing mix modeling software market is becoming more deeply tied to enterprise planning cadence, not just to campaign measurement.
Restraints Impact Analysis of Marketing Mix Modeling Software Market*
| RESTRAINT | (~) % IMPACT ON CAGR FORECAST | GEOGRAPHIC RELEVANCE | IMPACT TIMELINE |
|---|---|---|---|
| Weak Model Performance at Low Spend Levels | -1.5% | Global, most acute in South America, MEA, and SME segments in APAC | Short term (≤ 2 years) |
| Data Integration Burden Across Fragmented Marketing Stacks | -1.2% | Global, strongest in North America and Europe where martech stack complexity is highest | Medium term (2-4 years) |
| Long Validation Cycles Before Budget Ownership | -0.9% | Global, with particular impact on mid-market enterprise adoption timelines | Medium term (2-4 years) |
| Shortage of Marketing Scientists and Causal Analytics Talent | -0.7% | Global, most acute in APAC emerging markets and mid-market segments in Europe | Long term (≥ 4 years) |
| Source: Mordor Intelligence | |||
Weak Model Performance at Low Spend Levels
The marketing mix modeling software market still faces a hard adoption floor because reliable models need enough historical variation in spend to estimate channel effects with confidence. Brands operating below monthly media spend levels that support meaningful data depth often receive unstable outputs, which weakens trust in the model before it can become part of budget ownership. The issue is not just total spend, because data quality also depends on having consistent weekly inputs across several channels over a long enough period to separate real signal from noise. This becomes even more difficult when advertisers try to split analysis by geography, product line, or retail partner, since smaller data slices further weaken precision. Open-source tools reduce access cost, but they do not remove the basic data volume requirement, so the marketing mix modeling software market remains more accessible financially than statistically. The effect is most visible in newer digital advertising environments where budgets are growing quickly but have not yet built enough clean history for dependable model training.
Data Integration Burden Across Fragmented Marketing Stacks
The marketing mix modeling software market is also constrained by the amount of engineering work needed to gather, clean, and harmonize data from disconnected media, commerce, CRM, and offline systems. In many deployments, the effort required to prepare weekly aggregate inputs is greater than the modeling work itself, which raises total cost and extends time to value for first-time adopters. Salesforce’s Marketing Intelligence offer shows how central unified data infrastructure has become because it was designed to ingest and harmonize third-party performance data across a very broad source base before downstream measurement begins.[2]A. Hajar et al., “The AIMx Framework, Integrating Marketing Mix Modeling, Attribution, and AI-Driven Analytics for Adaptive Decision Systems,” Future Business Journal, link.springer.com Prescient AI’s Multi-Retail Connectors also reflect the same issue because omnichannel brands need separate and regularly refreshed retail data flows from partners such as Target, Walmart, and Ulta before a usable model can be maintained. Offline events such as store promotions, television schedules, and distribution changes still require careful manual mapping in many cases, which adds recurring governance work after the initial implementation. This means the marketing mix modeling software market often grows fastest where advertisers already have stronger internal data discipline and better-connected measurement environments.
*Our forecasts treat driver/restraint impacts as directional, not additive. The impact forecasts reflect baseline growth, mix effects, and variable interactions.
Marketing Mix Modeling Software Market Segment Analysis
By Component:
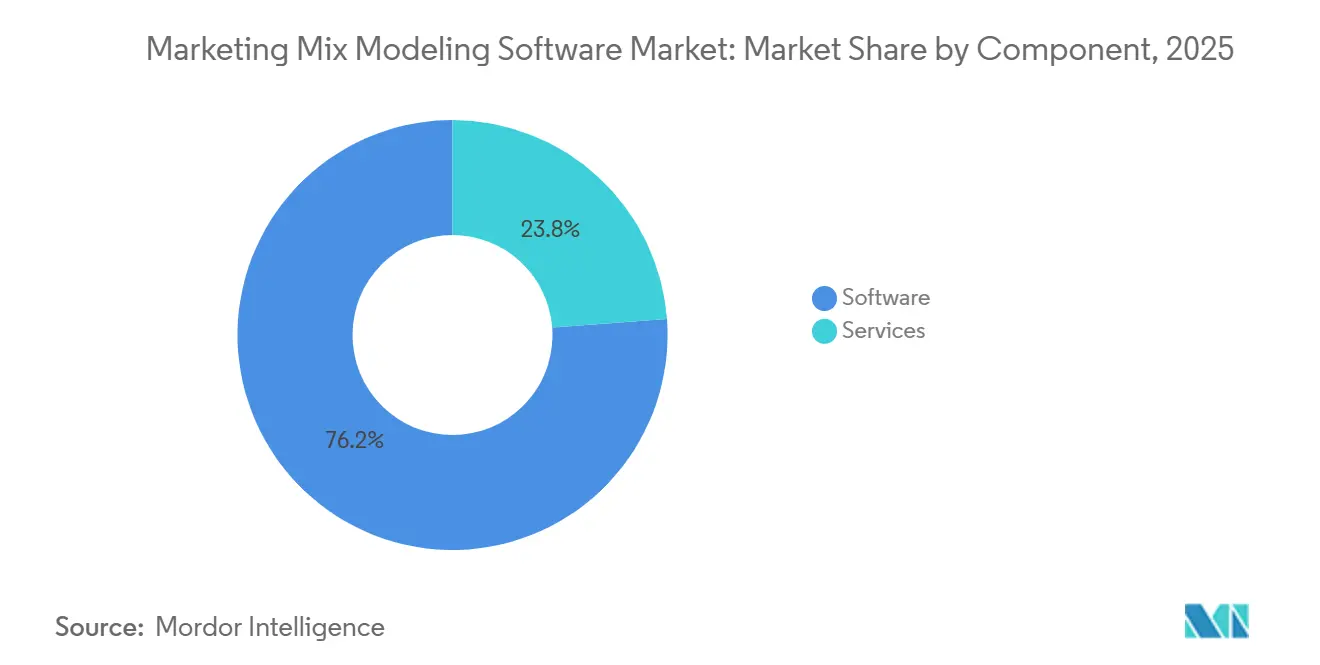
Platform Software Anchors Revenue, Services Scale FastestSoftware held 76.18% of the marketing mix modeling software market share in 2025, while services are projected to expand at a 15.77% CAGR through 2031. This split shows that the category has moved decisively toward platform-based delivery, where recurring subscriptions, model automation, and managed workflows have replaced a larger part of the old project-by-project consulting structure. Software remains the anchor because buyers increasingly want a repeatable operating layer that can pull in fresh inputs, rerun models, and support planning discussions without restarting the process from zero each cycle. The appeal is strongest for enterprises that need governance, audit trails, and shared access across marketing, analytics, and finance teams, since these needs are harder to meet with one-off advisory work alone. The marketing mix modeling software market is therefore generating most of its revenue from platforms, even though many customers still depend on outside expertise to turn model outputs into confident budget decisions.
Services are growing faster because implementation, model design, calibration, and interpretation remain difficult for many organizations, especially those that are adopting the category for the first time. Managed services are gaining room in the marketing mix modeling software market because mid-sized and newer adopters often want external partners to maintain data pipelines, review assumptions, and support executive planning while internal capability develops. The first 6 to 18 months after deployment are especially important because many buyers need help validating specifications and building decision routines around model outputs before the software becomes part of standard planning. Prescient AI’s Validation Layer points to this demand because it lets brands compare configurations and bring in incrementality tests, post-purchase surveys, and attribution signals during model evaluation.[3]Prescient AI, “Winter 2025-2026, Your Marketing Measurement Just Got More Powerful,” Prescient AI, prescientai.com Over time, some of these workflows will move further into product interfaces, but the services opportunity remains strong because organizational adoption still depends on interpretation, change management, and stakeholder trust as much as on technical accuracy.


By Deployment:
Cloud Infrastructure Dominates and Continues to Consolidate ShareCloud-based deployment accounted for 79.61% of the marketing mix modeling software market size in 2025 and is projected to grow at a 14.36% CAGR through 2031. That combination of dominant share and fastest growth shows how strongly buyers now prefer cloud-first measurement architecture for computationally heavy and continuously updated modeling environments. Marketing mix modeling places high demand on compute and workflow coordination because Bayesian sampling, scenario testing, and frequent data refreshes all require flexible processing and reliable orchestration. Cloud deployment supports this need more efficiently than on-premises setups in many cases, particularly for distributed teams that need access to shared planning outputs across functions and geographies. The marketing mix modeling software market is therefore consolidating around cloud delivery, not only because it is cheaper to scale, but also because the most advanced product features are being designed for that environment first.
Security and compliance concerns have not disappeared, but the balance has shifted as enterprise-grade controls, certifications, and private or sovereign cloud options have become more accepted. Recast’s positioning as a SOC 2 compliant platform and a certified Meta Measurement Partner is one example of how cloud providers are addressing the trust requirements of more regulated buyers. On-premises deployment still matters in some financial services and healthcare use cases where data residency rules or internal governance standards remain strict, so the segment is not disappearing outright. Even so, current product direction favors cloud architecture because leading vendors are building AI-native operating layers that depend on elastic infrastructure and continuous integration. NIQ Cadence illustrates this well because it was launched as a cloud-native compound AI operating system, which signals where frontier capabilities in the marketing mix modeling software market are now being built.[4]NIQ, “NIQ Introduces NIQ Cadence, A Compound AI Operating System for Marketing Effectiveness,” NIQ Investor Relations, investors.nielseniq.com
By Enterprise Size:
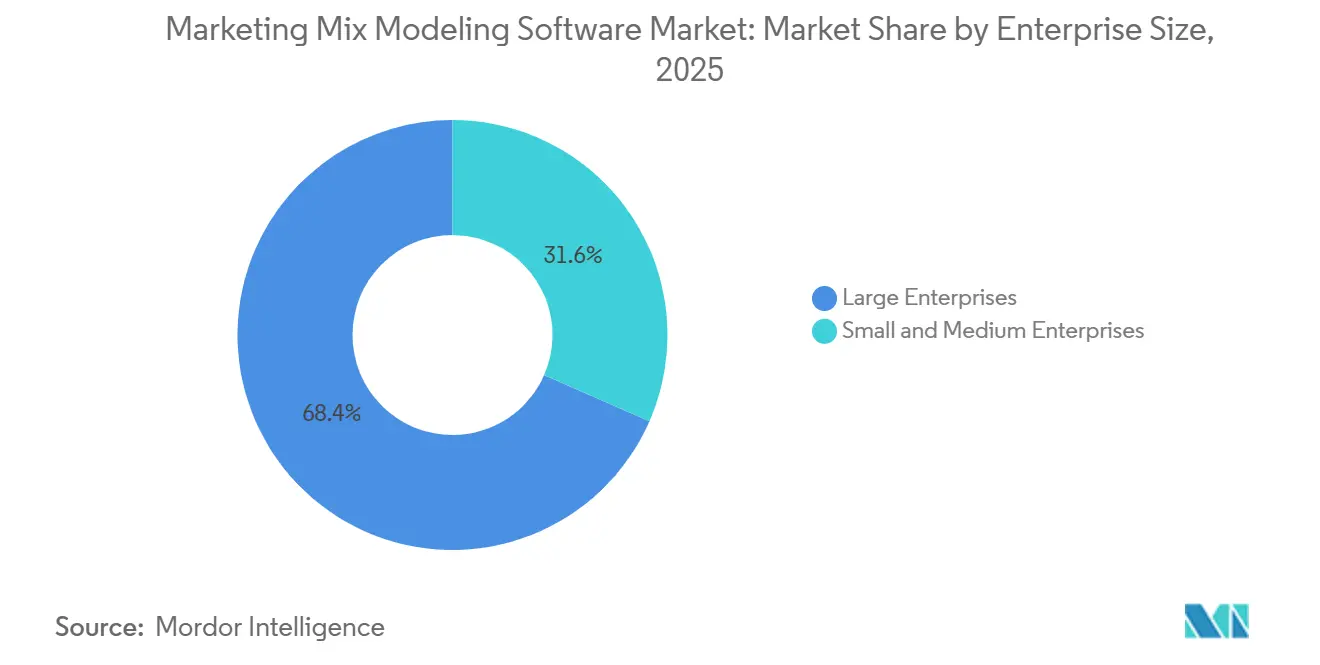
Large Enterprises Lead, SMEs Accelerate Through Open-Source AccessLarge enterprises held 68.43% of revenue in 2025, while small and medium enterprises are projected to expand at a 15.94% CAGR through 2031. Large organizations still dominate the marketing mix modeling software market because they have longer histories with econometric methods, larger media budgets, and a clearer need to coordinate planning across many brands, channels, and countries. They also tend to attach marketing measurement more directly to finance governance, which raises willingness to pay for global deployment, advanced support, and ongoing services. These buyers usually have stronger first-party data foundations and more mature annual planning rhythms, so they can absorb the operational requirements of continuous modeling more easily than smaller brands. That said, the growth profile of smaller organizations is improving because the category is no longer limited to companies that can support very large consulting engagements or dedicated internal modeling teams.
Google’s decision to open Meridian to all marketers and data scientists globally in January 2025 marked a major accessibility shift because it gave more teams a production-grade Bayesian framework without the older financial barrier. The later release of Scenario Planner reduced technical friction further because teams without strong coding resources could test budget choices in a more practical way. The marketing mix modeling software market is also becoming more reachable for smaller brands through self-serve and mid-market pricing tiers from specialist vendors, which has widened the set of companies that can experiment with the category. Even so, revenue concentration is likely to remain tilted toward large enterprises because their contracts are broader, their deployment footprints are larger, and their need for services remains deeper. This means SME adoption will expand the user base materially, while enterprise accounts will continue to shape a large share of spending and competitive positioning.
By End User Industry:
CPG Benchmarks the Market, Retail And E-Commerce Scales FastestConsumer packaged goods held the largest end-user share at 24.65% in 2025, while retail and e-commerce are projected to expand at a 16.83% CAGR through 2031. CPG remains the benchmark segment because it has a long institutional history with econometric budget planning across television, promotions, distribution activity, and retail partnerships. Many CPG companies have already embedded modeling into annual and quarterly planning, which creates recurring platform demand and a deep base of internal familiarity with the method. That installed base matters because it supports long-term vendor relationships and creates an environment where software is used as a planning system rather than as a one-time study. The marketing mix modeling software market continues to rely on CPG as its most established end-user base, even as other verticals adopt the category for newer reasons tied to measurement disruption.
Retail and e-commerce are growing faster because direct-to-consumer and omnichannel sellers have been affected sharply by weaker mobile attribution and growing pressure to validate incrementality across a wide mix of channels. These advertisers need models that can combine digital, marketplace, wholesale, and physical retail signals in a way that reflects how real demand develops across fragmented buying paths. Kantar’s August 2025 publication on long-term brand effects in marketing mix modeling also supports broader vertical adoption because it addresses one of the common gaps in sectors where the payoff from brand investment extends beyond the immediate campaign window. Banking, financial services, and insurance use the method to connect brand activity with applications and customer lifetime value across longer consideration cycles, while healthcare, life sciences, and automotive benefit from a privacy-compliant aggregate approach where user-level measurement is harder to sustain. This widening vertical relevance is helping the marketing mix modeling software market move from a category rooted mainly in CPG to one that serves a broader set of complex and regulated buying environments.
Geography Analysis
North America and APAC Marketing Mix Modeling Software Market
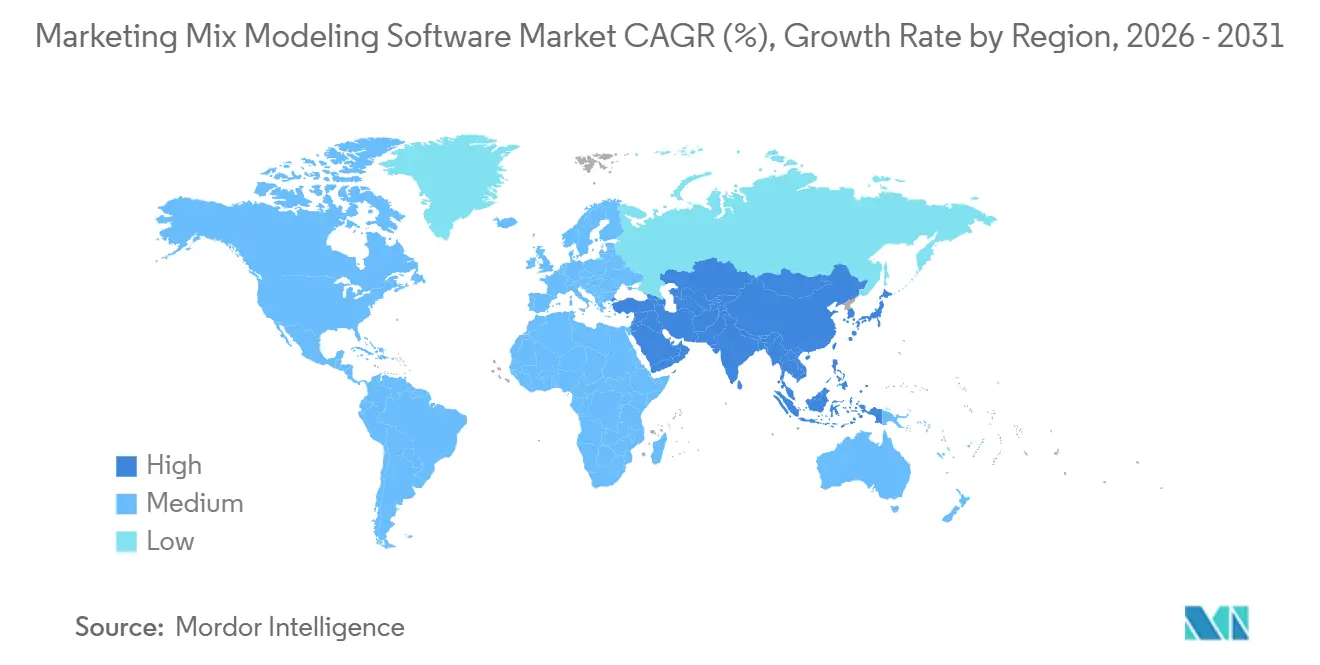
North America held 34.61% of the marketing mix modeling software market share in 2025, while Asia-Pacific is projected to expand at a 17.39% CAGR through 2031. The United States remains the center of the regional base because large advertisers in CPG, retail, financial services, and media already treat continuous modeling as part of enterprise planning rather than as an occasional analytics project. The vendor landscape in the region is also dense, with NIQ, Circana, Analytic Partners, and Measured operating in a market that is often the first to absorb new measurement capabilities and workflow changes. Think with Google’s business measurement material shows that North American buyers are increasingly using modeling for active budget planning rather than only post-campaign review, which strengthens the region’s role in shaping product direction across the marketing mix modeling software market. Nielsen’s Predictive Sales Lift launch for the U.S. market in 2026 also reflects how many leading-edge commercialization moves still start in this region before broader rollout.
APAC Regional Markets
Asia-Pacific is the fastest-growing regional part of the marketing mix modeling software market because advertisers across India, China, South Korea, Japan, and Australia are expanding digital investment from very different starting points. China’s fragmented platform environment, India’s scaling digital advertising base, and Japan’s mature consumer goods ecosystem each create separate reasons for broader model adoption. Intage’s long MMM service history in Japan shows that the region is not entirely new to the practice, and that current growth is as much about expansion and localization as first-time education.[5]Intage, “Marketing Mix Modeling,” Intage, intage.co.jp Meridian, Robyn, and localized tools such as MixCast are lowering access and language barriers, which should keep adoption broadening beyond the largest multinational advertisers.
EMEA and South America Marketing Mix Modeling Software Market
Europe still represents a substantial share of revenue in the marketing mix modeling software market, with Germany, the United Kingdom, and France standing out as major national bases. GDPR-era enforcement has made privacy-compliant measurement structurally more attractive across the region because it reduces reliance on tracking methods that have become harder to defend and maintain. Analytic Partners’ January 2025 acquisition of Analyx highlighted the value of local enterprise coverage in Europe and showed that the region is important enough to justify targeted expansion through acquisition. South America and the Middle East and Africa remain earlier-stage areas, but Brazil and the United Arab Emirates are becoming more relevant as digital investment, first-party data practices, and measurement maturity improve.

Competitive Landscape
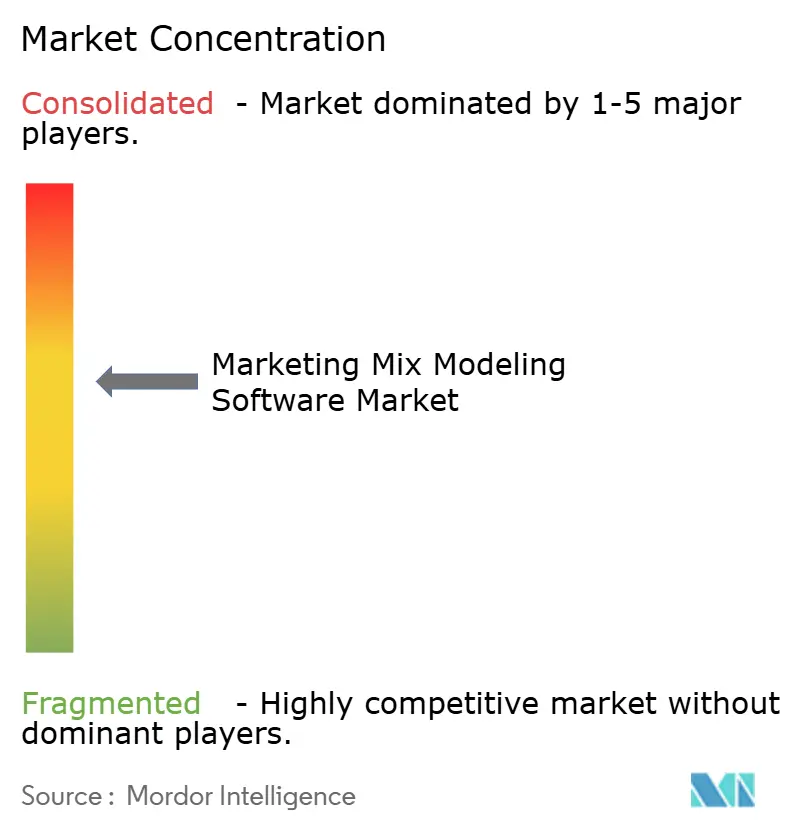
The marketing mix modeling software market shows moderate concentration, with a top tier of established measurement vendors competing alongside specialist SaaS providers and open-source frameworks. Global players such as NIQ, Kantar, Circana, and Analytic Partners still shape much of the enterprise conversation because they combine measurement capability with large delivery organizations, broad relationships, and deeper proprietary data assets. Circana’s August 2025 acquisition of Nielsen’s marketing mix modeling business strengthened that position by bringing together retailer coverage, multi-country reach, and a very large consumer touchpoint base inside one platform. NIQ’s launch of Cadence in June 2026 further showed that competition in the marketing mix modeling software market is moving toward AI-native operating systems that try to combine continuous measurement, optimization, and decision support in one environment.
Methodology transparency is becoming more important in vendor selection because buyers want to understand assumptions, priors, calibration logic, and the reasons behind recommended budget shifts. That trend favors providers that let customers inspect more of the modeling process instead of treating the system as a closed black box. Recast is one example of this orientation because its security credentials and measurement ecosystem partnerships support trust for customers that want a more inspectable platform layer. Adobe is taking a different route by embedding Mix Modeler within a broader planning and analytics environment, which raises switching costs for clients already invested in its adjacent tools. Analytic Partners has also deepened its position through acquisitions such as Magic Numbers and Analyx, which shows that geographic coverage and local delivery depth remain meaningful differentiators in large enterprise accounts.
The mid-market remains more contested because vendors there compete heavily on onboarding speed, price accessibility, and how much operational work they can absorb for the customer. A clear opening remains around AI-driven discovery measurement, where many brands still need practical ways to incorporate new traffic pathways into their planning models. Vendors that shorten the distance between model output and budget action are likely to stand out, and conversational interfaces linked to measurement workflows are part of that shift, as seen in offerings such as Lifesight’s causal modeling platform. Open-source baselines are also raising the pressure on proprietary platforms, so the marketing mix modeling software market is increasingly rewarding vendors that can combine strong data assets, easier deployment, transparent methodology, and decision-ready planning tools.
Marketing Mix Modeling Software Industry Leaders
Nielsen Holdings plc
Kantar Group Limited
Circana, LLC
Analytic Partners, Inc.
Measured, Inc.
- *Disclaimer: Major Players sorted in no particular order
Marketing Mix Modeling Software Market Companies Covered in this Report
- Nielsen Holdings plc
- Kantar Group Limited
- Circana, LLC
- Analytic Partners, Inc.
- Measured, Inc.
- Ipsos MMA, Inc.
- Recast Analytics, Inc.
- Google LLC
- Meta Platforms, Inc.
- Adobe Inc.
- Keen Decision Systems, Inc.
- Prescient AI, Inc.
- Lifesight Pte. Ltd.
- Northbeam, Inc.
- Triple Whale, Inc.
- Rockerbox, Inc.
- WorkMagic, Inc.
- Marketing Evolution, Inc.
- Gain Theory Limited
- Neustar, Inc.
- Salesforce, Inc.
- Mutinex Pty Ltd.
- SegmentStream Ltd.
- Cometly, Inc.

Recent Industry Developments in Marketing Mix Modeling Software Market
- June 2026: NIQ launched NIQ Cadence, a compound AI operating system for marketing effectiveness, currently in beta with its marketing mix modeling client base through the end of 2026. The platform integrates 19 specialized AI agents coordinated by NIQ Optiq and draws on NIQ's proprietary global consumer data spanning 90+ countries and approximately USD 7.4 trillion in tracked consumer spend to deliver continuous measurement, budget optimization, and decision support in a single environment.
- April 2026: Nielsen introduced Predictive Sales Lift, a capability available to Nielsen ONE Ads customers that predicts incremental sales lift and revenue for a media campaign prior to completion, using hundreds of historical campaign sales lift results as its training base. The tool reached general availability in May 2026, targeting digital and connected TV placements for US advertisers across retail, financial services, healthcare, and media sectors.
- February 2026: Google launched Scenario Planner for Meridian, a code-free interface for real-time budget scenario modeling and ROI estimation built on top of its open-source MMM framework. The update removed the data science prerequisite for running what-if planning on Meridian models and directly expanded MMM accessibility for mid-market and small and medium enterprise advertisers without dedicated analytics resources.
- September 2025: Google updated Meridian to include non-media variables such as pricing and promotions, channel-level contribution priors, and enhanced binomial adstock decay functions. The update significantly expanded the model's ability to isolate true media incrementality from concurrent pricing and promotional effects, the single largest source of attribution error in models used by CPG and retail advertisers.


Global Marketing Mix Modeling Software Market Report Scope
The Marketing Mix Modeling Software Market refers to the global market for data analytics solutions that help enterprises measure the impact of marketing activities across channels, campaigns, and customer touchpoints. These solutions use AI-driven and cloud-based capabilities to analyze historical sales, marketing spend, and external factors, enabling businesses to evaluate marketing effectiveness, improve campaign planning, and maximize returns on marketing investments. The market is driven by the growing need for data-driven decision-making, compliance with privacy regulations that limit user-level tracking, and the increasing adoption of predictive and prescriptive analytics in marketing strategy.
The Marketing Mix Modeling Software Market Report is Segmented by Component (Software, and Services [Professional Services, and Managed Services]), Deployment (Cloud-Based, and On-Premises), Enterprise Size (Large Enterprises, and Small and Medium Enterprises), End User Industry (Consumer Packaged Goods, Retail and E-Commerce, Media and Entertainment, IT and Telecommunication, Banking, Financial Services, and Insurance (BFSI), Healthcare and Life Sciences, Automotive, and Other End User Industries), and Geography (North America, South America, Europe, Asia-Pacific, and Middle East and Africa). The Market Forecasts are Provided in Terms of Value (USD).
| Software | |
| Services | Professional Services |
| Managed Services |
| Cloud-Based |
| On-Premises |
| Large Enterprises |
| Small and Medium Enterprises |
| Consumer Packaged Goods |
| Retail and E-Commerce |
| Media and Entertainment |
| IT and Telecommunication |
| Banking, Financial Services, and Insurance (BFSI) |
| Healthcare and Life Sciences |
| Automotive |
| Other End User Industries |
| North America | United States | |
| Canada | ||
| Mexico | ||
| South America | Brazil | |
| Argentina | ||
| Rest of South America | ||
| Europe | Germany | |
| United Kingdom | ||
| France | ||
| Italy | ||
| Spain | ||
| Russia | ||
| Rest of Europe | ||
| Asia-Pacific | China | |
| Japan | ||
| India | ||
| South Korea | ||
| Australia | ||
| Rest of Asia-Pacific | ||
| Middle East and Africa | Middle East | United Arab Emirates |
| Saudi Arabia | ||
| Turkey | ||
| Rest of Middle East | ||
| Africa | South Africa | |
| Egypt | ||
| Rest of Africa | ||
| By Component | Software | ||
| Services | Professional Services | ||
| Managed Services | |||
| By Deployment | Cloud-Based | ||
| On-Premises | |||
| By Enterprise Size | Large Enterprises | ||
| Small and Medium Enterprises | |||
| By End User Industry | Consumer Packaged Goods | ||
| Retail and E-Commerce | |||
| Media and Entertainment | |||
| IT and Telecommunication | |||
| Banking, Financial Services, and Insurance (BFSI) | |||
| Healthcare and Life Sciences | |||
| Automotive | |||
| Other End User Industries | |||
| By Geography | North America | United States | |
| Canada | |||
| Mexico | |||
| South America | Brazil | ||
| Argentina | |||
| Rest of South America | |||
| Europe | Germany | ||
| United Kingdom | |||
| France | |||
| Italy | |||
| Spain | |||
| Russia | |||
| Rest of Europe | |||
| Asia-Pacific | China | ||
| Japan | |||
| India | |||
| South Korea | |||
| Australia | |||
| Rest of Asia-Pacific | |||
| Middle East and Africa | Middle East | United Arab Emirates | |
| Saudi Arabia | |||
| Turkey | |||
| Rest of Middle East | |||
| Africa | South Africa | ||
| Egypt | |||
| Rest of Africa | |||


Key Questions Answered in the Report
How large is the marketing mix modeling software market in 2026?
The marketing mix modeling software market size is projected to expand from USD 1.96 billion in 2025 and USD 2.23 billion in 2026 to USD 4.22 billion by 2031, registering a CAGR of 13.61% between 2026 to 2031.
What is driving adoption of marketing mix modeling software in 2026?
The biggest factors are privacy-led measurement change, the decline of user-level attribution, broader access to open-source Bayesian tools, and stronger demand for finance-ready scenario planning.
Which deployment model leads marketing mix modeling software demand?
Cloud-based deployment leads with 79.61% share in 2025 and is also the fastest-growing deployment mode with a 14.36% CAGR through 2031.
Which companies and buyer groups matter most in this space?
Large enterprises held 68.43% share in 2025, while leading vendors such as NIQ, Circana, Kantar, and Analytic Partners remain influential in enterprise buying cycles.
Which end-user segment is growing the fastest?
Retail and e-commerce is the fastest-growing end-user segment with a 16.83% CAGR through 2031, while consumer packaged goods remained the largest at 24.65% share in 2025.
Which region is expanding the fastest for marketing mix modeling software?
Asia-Pacific is projected to post the fastest regional growth at 17.39% CAGR through 2031, while North America remained the largest regional market with 34.61% share in 2025.
Page last updated on:


 Your data is secure and never sold or shared.


