
Marketing Attribution Services Market Size and Share
Market Overview
| Study Period | 2020 - 2031 |
|---|---|
| Market Size (2026) | USD 6.52 Billion |
| Market Size (2031) | USD 13.01 Billion |
| Growth Rate (2026 - 2031) | 14.80 % |
| Fastest Growing Market | Asia-Pacific |
| Largest Market | North America |
| Market Concentration | Medium |
Major Players *Disclaimer: Major Players sorted in no particular order Image © Mordor Intelligence. Reuse requires attribution under CC BY 4.0. | |
Marketing Attribution Services Market Analysis by Mordor Intelligence
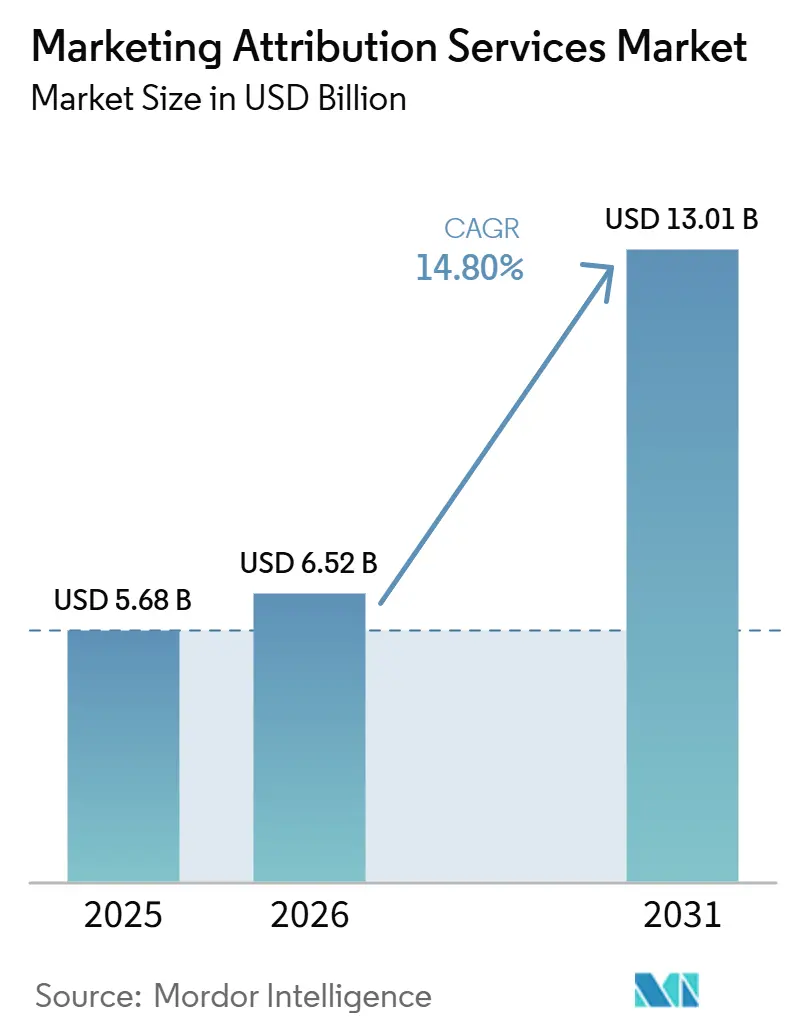
The marketing attribution services market size was valued at USD 5.68 billion in 2025 and estimated to grow from USD 6.52 billion in 2026 to reach USD 13.01 billion by 2031, at a CAGR of 14.80% during the forecast period (2026-2031). The marketing attribution services market is expanding as advertisers replace tracking methods that no longer work consistently across browsers, mobile devices, and consent settings. Marketing mix modeling, multi-touch attribution, and incrementality testing are becoming complementary tools because each answers a different budget decision. Retail media spending and the spread of omnichannel campaigns have made comparable measurement more important for marketers. The marketing attribution services market also benefits when organizations move measurement from periodic reporting into daily planning and budget allocation. Providers that combine consulting, software, and secure data environments are better placed to serve larger advertisers, while self-service platforms are widening access for smaller buyers.
Key Report Takeaways
- By attribution model, Multi-Touch Attribution held 48.24% of revenue in 2025, while Algorithmic and Probabilistic Attribution is projected to expand at a 16.02% CAGR through 2031 in the marketing attribution services market.
- By deployment mode, Cloud held 58.42% of revenue in 2025, while Hybrid is expected to grow at a 15.93% CAGR through 2031.
- By organization size, Large Enterprises accounted for 64.92% of revenue in 2025, while SMEs are projected to advance at a 16.52% CAGR through 2031in the marketing attribution services market.
- By end-user industry, Retail and E-commerce accounted for 24.70% of revenue in 2025, while Healthcare and Life Sciences is forecast to grow at a 16.23% CAGR through 2031 in the marketing attribution services market.
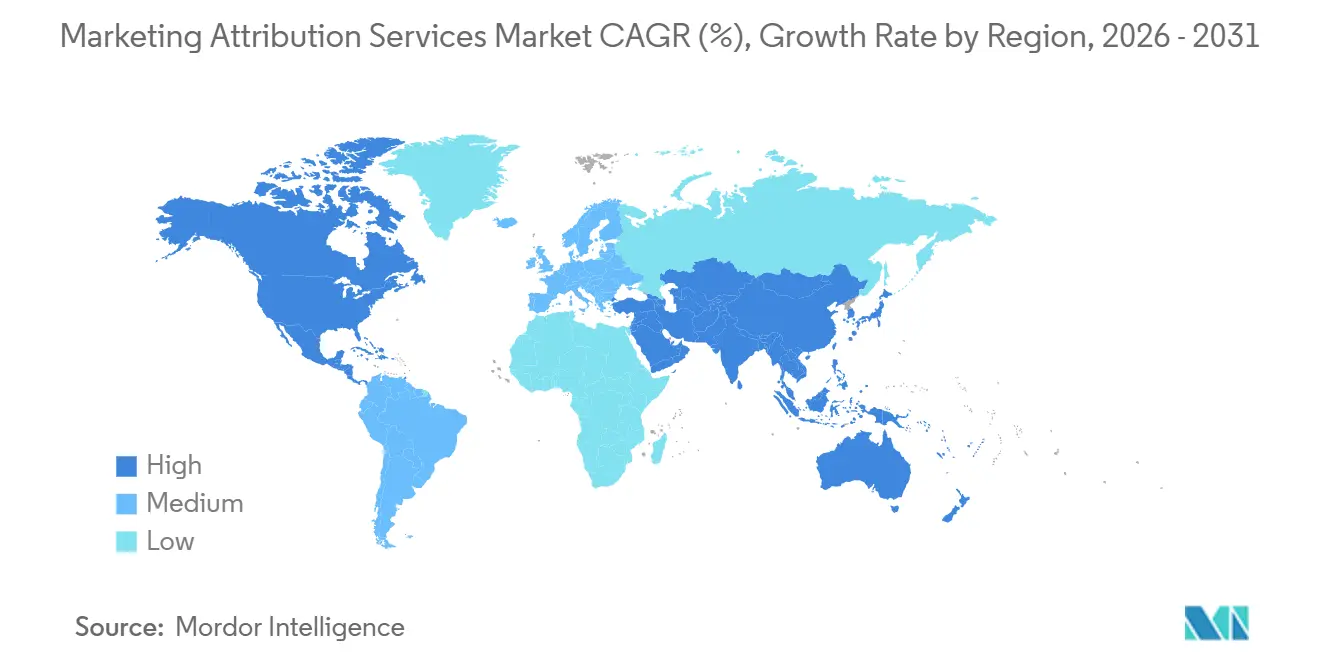
- By geography, North America held 41.36% of revenue in 2025, while Asia-Pacific is projected to expand at a 16.32% CAGR through 2031.
Note: Market size and forecast figures in this report are generated using Mordor Intelligence’s proprietary estimation framework, updated with the latest available data and insights as of January 2026.
Market Trends and Insights
Drivers Impact Analysis of Marketing Attribution Services Market*
| Driver | (~) % Impact on CAGR Forecast | Geographic Relevance | Impact Timeline |
|---|---|---|---|
| Unified MMM, MTA, and Incrementality Frameworks | +3.2% | Global, concentrated in North America and Europe | Medium term (2-4 years) |
| Omnichannel and Retail Media Measurement | +2.8% | North America, Europe, Asia-Pacific core | Short term (≤ 2 years) |
| First-Party Data and Clean Room Measurement Mandates | +2.4% | Global, concentrated in North America and EU | Medium term (2-4 years) |
| Real-Time ROI Accountability and Budget Reallocation | +2.0% | Global | Short term (≤ 2 years) |
| Attribution for AI-Assisted and Dark-Funnel Journeys | +1.8% | North America and Europe, early adoption in Asia-Pacific | Long term (≥ 4 years) |
| Measurement of Owned, Earned, and Executive-Led Content | +1.5% | North America, Asia-Pacific, spillover to Middle East | Medium term (2-4 years) |
| Source: Mordor Intelligence | |||
Rising Enterprise Demand for Unified MMM, MTA, and Incrementality Frameworks
Enterprise buyers are using marketing mix modeling for budget planning, multi-touch attribution for channel management, and incrementality testing to test whether spend caused a result. The marketing attribution services market is supported by this need to bring the three methods into one operating process. A peer-reviewed study of the AIMx framework found that integrating these methods can improve decision consistency and budget allocation stability compared with fragmented measurement approaches.[1]Michael Tran et al., “The AIMx Framework: Integrating Marketing Mix Modeling, Attribution, and AI-Driven Analytics for Adaptive Decision Systems,” Future Business Journal, link.springer.com This makes a reconciled budget recommendation more useful than several disconnected model outputs, especially when media teams and finance teams must use the same planning assumptions across a campaign cycle. Ipsos MMA and Ekimetrics received Leader recognition in the Forrester Wave for Marketing Measurement and Optimization Services, Q1 2026, and both have emphasized technology-supported planning and decision processes. The marketing attribution services market therefore rewards providers that can shorten the time from measurement to a budget decision.
Growing Adoption of Omnichannel and Retail Media Measurement
U.S. retail media advertising spending reached USD 69.33 billion in 2026, increasing the need for measurement across retailer platforms and other media channels. Retail media buyers reported that proof of sales lift and return on investment were leading requirements, while comparable cross-retailer measurement and online-to-offline measurement were also important.[2]TransUnion and Path to Purchase Institute, “Seven in Ten Companies Plan to Increase Retail Media Budgets,” TransUnion Newsroom, newsroom.transunion.com The marketing attribution services market gains from this gap because retailer-specific reporting does not provide a consistent view of a brand's total activity. Providers that work across multiple clean room environments can give brands a common basis for comparing campaigns, including campaigns that run through separate retailer platforms, publisher properties, and owned customer channels. Closed-loop measurement also helps retail media networks show whether advertising exposure led to purchases. This places the marketing attribution services market closer to both media buying decisions and retailer partnership decisions.
Expanding First-Party Data and Clean Room Measurement Mandates
Clean rooms are becoming a working environment for measurement when advertisers need to use data without exposing individual-level records. TransUnion reported that retail media organizations were increasing their use of clean room capabilities as they sought better measurement and data collaboration. In the marketing attribution services market, the value of these environments extends from reporting into testing, planning, and analysis of customer behavior. Amazon Advertising states that its measurement products use signals from its authenticated consumer graph to support campaign analysis across Amazon properties.[3]Amazon Ads, “Amazon Marketing Cloud,” Amazon Ads, advertising.amazon.com Service providers can use multi-party environments to reconcile retailer, publisher, and customer data under agreed access controls, which reduces the need for each participant to send detailed customer records to every other participant. The marketing attribution services market is consequently shaped by the ability to work with secure data assets rather than by software interfaces alone.
Increasing Need for Real-Time ROI Accountability and Budget Reallocation
Marketing leaders need timely evidence when they move budgets across channels and campaigns. The marketing attribution services market responds to that requirement with tools that connect spending, outcomes, and test results in one workflow. Accenture Song introduced Marketing Investment Navigator in June 2026 as a unified measurement platform covering marketing mix modeling, attribution, sales lift, and brand lift. This approach reflects a buyer preference for results that can be used in planning rather than reports that arrive after spending decisions have closed. Faster reporting does not remove the need for validation, since short-term channel results can differ from incremental value, and a quick response should not be treated as proof that a campaign changed customer behavior. The marketing attribution services market is therefore favoring platforms that combine quick scenario analysis with methods that test causality.
Restraints Impact Analysis of Marketing Attribution Services Market*
| Restraint | (~) % Impact on CAGR Forecast | Geographic Relevance | Impact Timeline |
|---|---|---|---|
| Signal Loss from Privacy Rules and Browser Restrictions | -2.5% | Global, most acute in European Union and North America | Short term (≤ 2 years) |
| Data Integration and Model Calibration Complexity | -1.8% | Global | Medium term (2-4 years) |
| Measurement Noise and Error in Privacy-Preserving Attribution APIs | -1.2% | North America and Europe | Short term (≤ 2 years) |
| Zero-Click and Unobservable AI-Influenced Journeys | -0.9% | North America, Asia-Pacific | Long term (≥ 4 years) |
| Source: Mordor Intelligence | |||
Signal Loss from Privacy Rules and Browser Restrictions
Privacy controls and browser restrictions reduce the identifiers available to deterministic attribution models. Apple's App Tracking Transparency and browser privacy features have changed the data available for measurement across mobile and web activity. Consent requirements can also leave parts of a customer journey outside the observable record. The marketing attribution services market must address this loss of signal because missing early interactions can place too much credit on final-click channels. Providers need more calibration work, testing, and aggregated methods to produce usable findings, while clients must understand that a modeled result may carry more uncertainty than a directly observed interaction. This raises implementation effort and can lengthen the time before buyers see value from a new service.
High Data Integration and Model Calibration Complexity
Unified measurement depends on data from customer systems, advertising platforms, sales records, call centers, and offline media. The marketing attribution services market faces a practical constraint because those inputs use different definitions, update cycles, and attribution windows. Marketing mix modeling also needs a sufficient history of consistent spend and outcome data before it can offer dependable results. Google presents Meridian as an open-source marketing mix modeling framework, but its use still requires organizations to prepare data and interpret results. This creates a significant barrier for mid-sized organizations without internal analytical resources or outside implementation support. Vendors that offer ready connectors to advertising platforms, customer data platforms, and data warehouses can reduce the work, but integration depth remains a central buying consideration because buyers need definitions and records to align before models can be trusted.
*Our forecasts treat driver/restraint impacts as directional, not additive. The impact forecasts reflect baseline growth, mix effects, and variable interactions.
Marketing Attribution Services Market Segment Analysis
By Attribution Model:
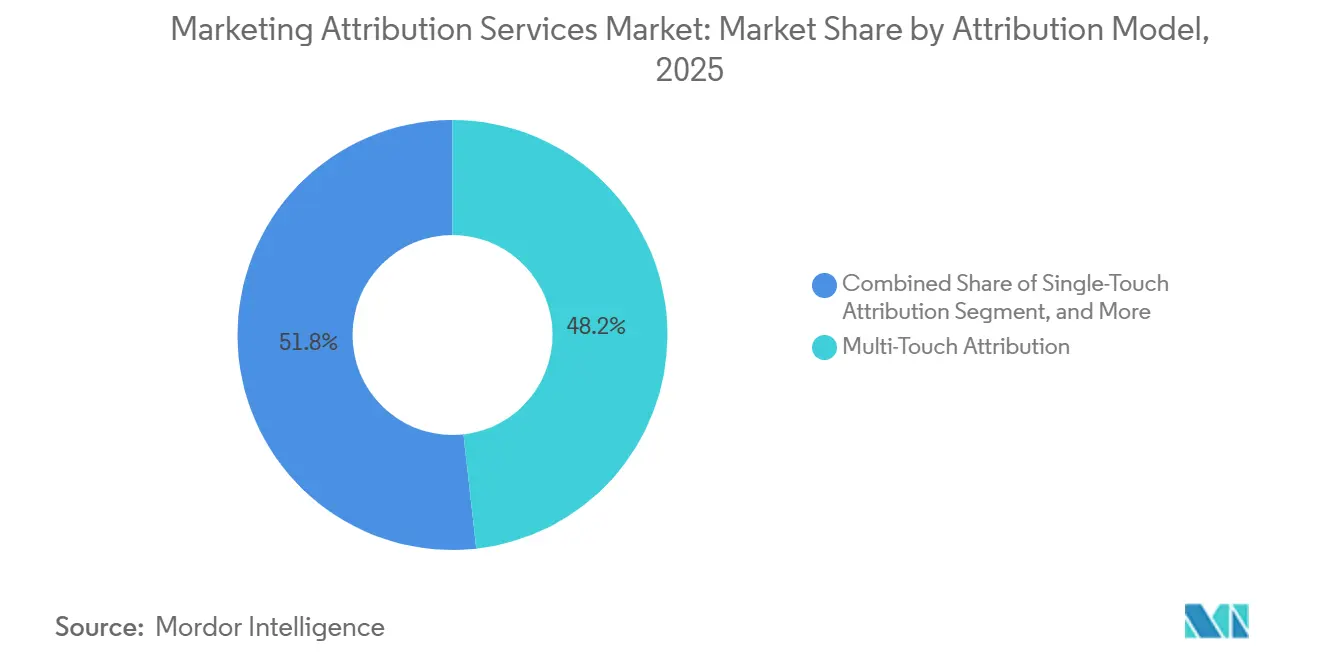
Multi-Touch Attribution Holds the Largest Position as Algorithmic Models ExpandMulti-Touch Attribution held 48.24% of the marketing attribution services market share in 2025. Its position reflects enterprise contracts established before 2023 and continued demand for journey-level data in channel optimization. The model remains useful where customer interactions can be linked across touchpoints. Privacy restrictions, however, can limit that linkage and increase the use of modeled estimates, particularly when browsers, operating systems, and consent choices prevent a provider from observing the same user across a complete journey. Single-Touch Attribution remains relevant for smaller organizations with fewer channels and limited measurement resources.
Algorithmic and Probabilistic Attribution is projected to expand at a 16.02% CAGR through 2031. The marketing attribution services market size for this model is rising because it can operate without persistent identifiers and can use broader data patterns under privacy constraints. The AIMx study found that integrated, AI-supported approaches can offer more stable planning and forecasting than isolated methods. Ipsos MMA released Version 2.0 of its Agile Attribution Platform with automated optimization and continuous recalibration, while Ekimetrics introduced Eki.Decisions to connect marketing mix modeling, scenario simulation, and governance, and open-source frameworks such as Meridian and Robyn are expanding access to probabilistic methods while preserving the need to define outcomes, select data inputs, and check model quality.



By Deployment Mode:
Cloud Leads While Hybrid Deployment Grows FasterCloud deployment held 58.42% of revenue in 2025. Subscription pricing and elastic computing capacity make cloud systems suitable for model training and platform integration. This mode is common among mid-sized direct-to-consumer and e-commerce brands that need a lower entry cost, fast access to model capacity, and connections to the advertising and commerce systems they already use. On-premises systems remain relevant in financial services and healthcare, where organizations seek greater control over sensitive data. The marketing attribution services market retains this deployment choice because compliance needs differ widely by buyer.
Hybrid deployment is forecast to grow at a 15.93% CAGR through 2031. Hybrid deployment is supported by architectures that separate analytical computing from raw data storage. This lets organizations use scalable computing while keeping sensitive information in a controlled location. Accenture Song launched Marketing Investment Navigator on Amazon Bedrock and AWS Clean Rooms in June 2026, demonstrating a platform approach built around privacy-oriented cloud controls. Vendors that can run analytics in a client's cloud environment can address requirements in regulated sectors, where information governance, audit needs, and local data handling rules affect both supplier selection and the scope of a measurement project, potentially reducing the need to return to a fully on-premises design.
By Organization Size:
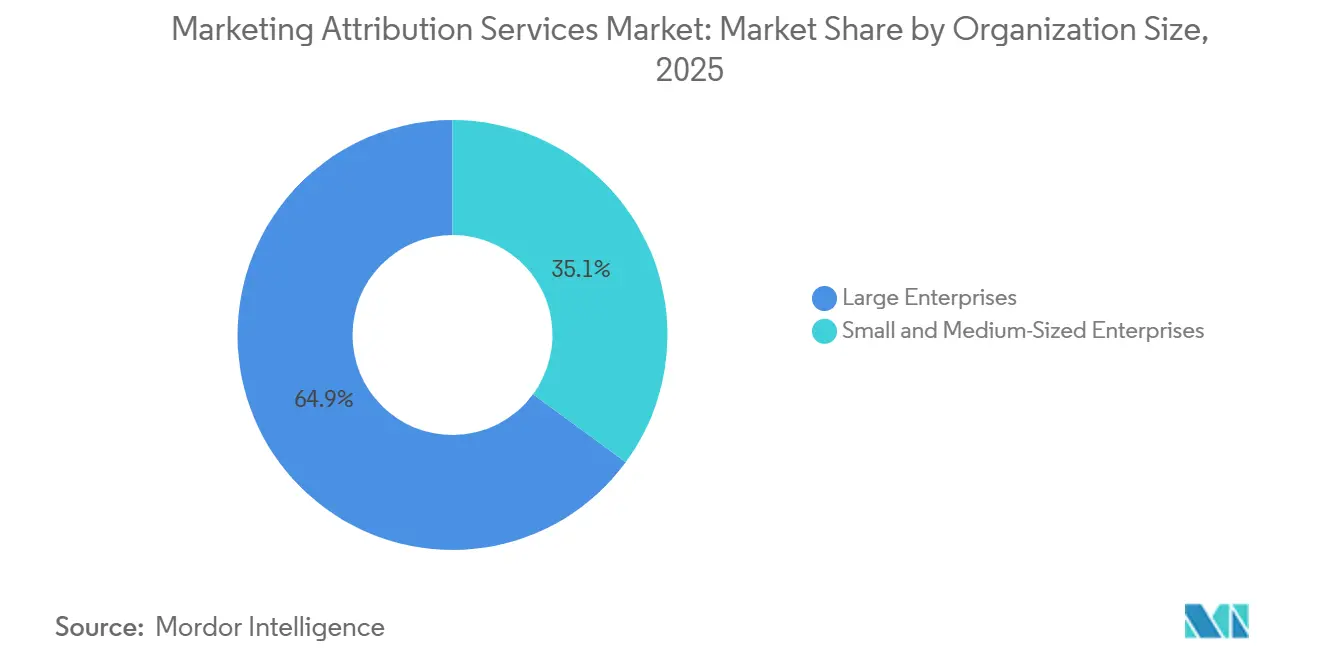
Large Enterprises Lead Revenue While SMEs Gain AccessLarge Enterprises accounted for 64.92% of revenue in 2025. Their spending supports multiyear engagements that combine software, data preparation, and specialized advisory work. Analytic Partners reported a network of more than 600 onshore specialists following its expansion activities. These requirements favor providers with global delivery capacity and experience across local markets, because enterprise teams often need a consistent framework while continuing to plan media around country-level operating conditions and regulations. The established enterprise model is under pressure as buyers seek platform subscriptions alongside targeted services rather than full outsourcing.
SMEs are projected to expand at a 16.52% CAGR through 2031. The marketing attribution services market is becoming more accessible as platforms provide self-service capabilities and prebuilt integrations. Northbeam, Rockerbox, and Lifesight serve advertisers that need measurement without maintaining a large internal data science team. Open-source models reduce software barriers but do not eliminate the need for well-prepared data and informed interpretation, creating room for providers that offer quick setup, guided testing, and practical support for smaller marketing teams that may have strong commerce data but limited capacity to build a data engineering and statistical modeling function.
By End-User Industry:
Retail and E-Commerce Lead Demand While Healthcare and Life Sciences AccelerateRetail and E-commerce held 24.70% of revenue in 2025. This sector needs measurement across retailer platforms, digital advertising, physical stores, and customer relationship channels. Retail media buyers have identified sales lift, return on investment, cross-retailer comparability, and online-to-offline attribution as important measurement needs. BFSI, IT and Telecommunications, and Media and Entertainment also require auditable measurement across complex customer journeys. Travel and Hospitality and Consumer Goods are increasing adoption as campaign activity moves across more channels, including search, social media, retail platforms, customer loyalty programs, physical outlets, and customer service interactions.
Healthcare and Life Sciences is forecast to grow at a 16.23% CAGR through 2031. The healthcare and life sciences category is supported by the move away from final-click reporting toward multi-touch and hybrid measurement. Amsive and Freshpaint reported that 37% of healthcare marketers used multi-touch attribution and 57% were investing in analytics and attribution tools in 2026. Axtria released MarketingIQ Winter 2026 with multi-touch attribution capabilities for life sciences brand teams, while Veeva reported that coordinated media activity can improve planning where communication to health care professionals and consumer audiences creates distinct paths that must be considered together.
Geography Analysis
North America Marketing Attribution Services Market
North America held 41.36% of the marketing attribution services market share in 2025. The region has a large base of digital advertisers, established clean room infrastructure, and many specialist providers. U.S. retail media advertising spending reached USD 69.33 billion in 2026, raising the need for measurement in walled garden environments. TransUnion and Google announced an integration in May 2026 that made TransUnion the sole multi-touch attribution provider for YouTube advertising. Privacy requirements in the United States and Canada also support demand for measurement designs that reduce reliance on third-party identifiers, and this gives large advertisers an incentive to adopt methods that can be used across several legal and platform environments.
Europe and South America Marketing Attribution Services Market
Europe is the second-largest revenue contributor to the marketing attribution services market. GDPR-related data protection requirements have increased interest in aggregated methods such as marketing mix modeling for campaigns with meaningful regional reach. Analytic Partners acquired Analyx in January 2025, expanding its position in Germany, Switzerland, and Poland. Germany and the United Kingdom lead adoption as brands adapt to privacy requirements and more mature digital advertising activity. France, Italy, Spain, and the rest of Europe offer room for growth as organizations shift from agency-managed measurement toward hybrid and internal models. South America, particularly Brazil and Chile, remains earlier-stage, with digital advertising investment growing faster than local measurement infrastructure, creating an opening for cloud-based providers that can offer usable services without the extensive local delivery footprint required by large consultancies.
APAC and MEA Marketing Attribution Services Market
Asia-Pacific is projected to expand at a 16.32% CAGR through 2031. The marketing attribution services market size in the region is supported by e-commerce growth and mobile-first buyer journeys across China, India, Japan, South Korea, and Southeast Asia. China's Personal Information Protection Law and India's Digital Personal Data Protection Act are encouraging privacy-first measurement practices among local and multinational brands. The Middle East, led by Saudi Arabia and the UAE, is building demand alongside digital commerce and media investment. Africa remains at an earlier stage, with South Africa and Nigeria among the more active adoption markets, while the scale of adoption will depend on the growth of digital commerce, media investment, data infrastructure, and locally appropriate privacy practices.

Competitive Landscape
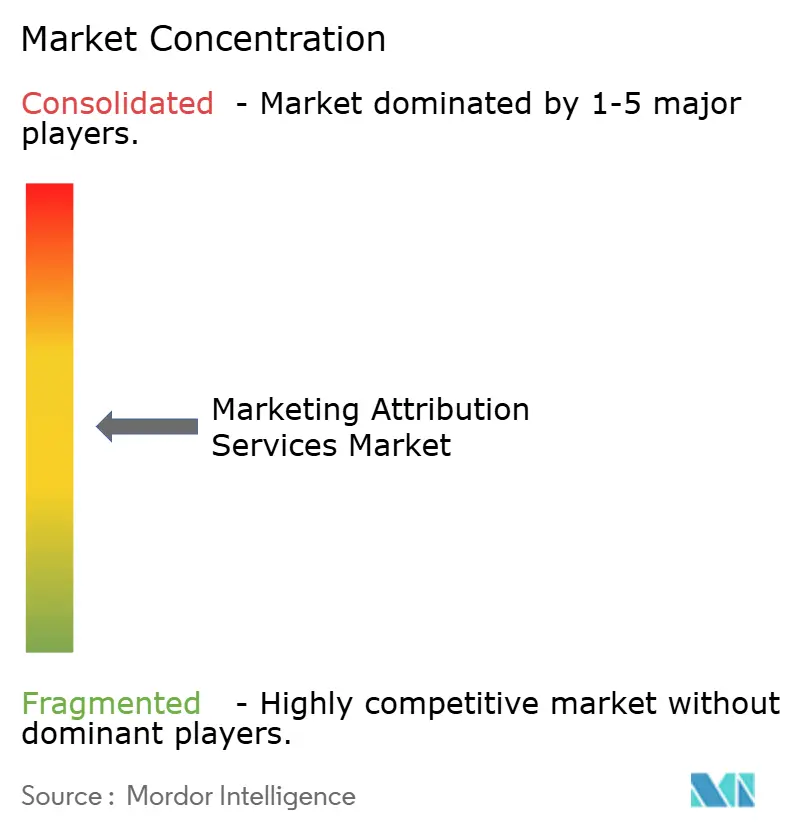
The marketing attribution services market is moderately fragmented, with a clear upper tier of established marketing measurement specialists. Analytic Partners, Ipsos MMA, and Ekimetrics received Leader recognition in the Forrester Wave for Marketing Measurement and Optimization Services, Q1 2026. These providers compete through consultant depth, global delivery capacity, and data capabilities, while clients compare the quality of their recommendations, the speed of delivery, the transparency of methods, and the effort needed to connect internal data. SaaS-focused providers including Rockerbox, Northbeam, and Lifesight address mid-sized and direct-to-consumer customers with faster deployment and self-service options. The marketing attribution services market therefore includes both advisory-led and software-led business models.
Technology is becoming a larger part of competitive differentiation in the marketing attribution services market. Lifesight launched its MCP connector in June 2026 to provide secure, read-only access to live causal measurement models within Claude and ChatGPT interfaces. Accenture Song launched Marketing Investment Navigator in June 2026, combining marketing mix modeling, attribution, sales lift, and brand lift in one platform. Northbeam introduced Incrementality in April 2026, adding native geo-holdout and intent-to-treat testing to its measurement offering. These moves show a shift from dashboards toward systems that support planning, testing, and decisions. Vendors also need privacy-preserving methods that work when user-level signals are incomplete, since the usefulness of an attribution offering increasingly depends on whether it can provide credible results without relying on a persistent personal identifier.
Consolidation is influencing the marketing attribution services market as companies expand through acquisitions and capability additions. H.I.G. Capital completed its acquisition of Kantar Media in August 2025, separating the business from Kantar Group as an independent company. Analytic Partners acquired Analyx in January 2025 after its acquisition of Magic Numbers in the United Kingdom during 2024. These transactions strengthen geographic reach and specialist capabilities, and they can give a provider access to local client relationships, local analytical talent, and sector knowledge that would take considerable time to develop internally. The marketing attribution services market still has space for firms that simplify integrated measurement for smaller advertisers.
Marketing Attribution Services Industry Leaders
Analytic Partners, LP
Merkle Inc.
TransUnion LLC
Ipsos MMA
Circana, Inc.
- *Disclaimer: Major Players sorted in no particular order
Marketing Attribution Services Market Companies Covered in this Report
- Analytic Partners, LP
- Merkle Inc.
- TransUnion LLC
- Ipsos MMA
- Circana, Inc.
- Gain Theory
- Kantar Group
- Ekimetrics
- Acxiom
- C5i
- LatentView Analytics
- Marketbridge LLC
- OptiMine Software, Inc.
- DAC Group
- LifeSight
- Rockerbox, Inc.
- North Beam, Inc.
- LeadsRx, Inc
- Precis Digital Company Group
- BitBang S.r.l.

Recent Industry Developments in Marketing Attribution Services Market
- June 2026: Lifesight launched Lifesight MCP on June 30, a Model Context Protocol connector that gives Claude and ChatGPT secure, read-only access to a company's live causal marketing measurement model, including MMM, geo-based incrementality testing, and causal attribution, without API keys or code setup. The launch extends attribution from dashboard reporting into AI conversational planning workflows for more than 100 global brands managing more than USD 4 billion in marketing spend.
- June 2026: Accenture Song launched Accenture Marketing Investment Navigator on June 19, as an AI-native, enterprise-scale unified measurement platform combining MMM, attribution, sales lift, and brand lift in 1 system. Built on Amazon Bedrock, AWS Clean Rooms, and Amazon Bedrock AgentCore, the platform uses Amazon's authenticated graph reaching more than 90% of U.S. households and reported business outcome improvements of more than 17% at 2 times the speed of current approaches in initial deployments.
- May 2026: TransUnion and Google announced an integration on May 20 making TransUnion the sole MTA provider for YouTube advertising, enabling marketers to connect YouTube ad exposure to business outcomes across a unified identity graph. A pilot with more than 15 advertisers across automotive, retail, financial services, insurance, and media confirmed cross-channel attribution lift.
- April 2026: Northbeam launched Northbeam Incrementality on April 7, adding native geo-holdout and intent-to-treat experimentation to its MTA and MMM capabilities. Meta and Google served as initial testbed options, with the company planning to cover 80% of average client budgets within months of launch.


Global Marketing Attribution Services Market Report Scope
The Global Marketing Attribution Services Market refers to the industry encompassing professional services, platforms, and analytical solutions that measure, evaluate, and assign credit to various marketing touchpoints across digital and offline channels for their contribution to customer acquisition, engagement, conversions, and revenue generation.
The Marketing Attribution Services Market Report is segmented by Attribution Model (Single-Touch, Multi-Touch, and Algorithmic and Probabilistic), Deployment Mode (Cloud, On-Premises, and Hybrid), Organization Size (Large Enterprises and Small and Medium-Sized Enterprises), End-User Industry (Retail and E-commerce, BFSI, IT and Telecommunications, Media and Entertainment, Healthcare and Life Sciences, Travel and Hospitality, Consumer Goods, and Other End-User Industries), and Geography (North America, South America, Europe, Asia-Pacific, Middle East, and Africa). The Market Forecasts are Provided in Terms of Value (USD).
| Single-Touch Attribution |
| Multi-Touch Attribution |
| Algorithmic and Probabilistic Attribution |
| Cloud |
| On-Premises |
| Hybrid |
| Large Enterprises |
| Small and Medium-Sized Enterprises |
| Retail and E-commerce |
| BFSI |
| IT and Telecommunications |
| Media and Entertainment |
| Healthcare and Life Sciences |
| Travel and Hospitality |
| Consumer Goods |
| Other End-User Industries |
| North America | United States |
| Canada | |
| Mexico | |
| South America | Brazil |
| Argentina | |
| Chile | |
| Rest of South America | |
| Europe | Germany |
| United Kingdom | |
| France | |
| Italy | |
| Spain | |
| Rest of Europe | |
| Asia-Pacific | China |
| Japan | |
| India | |
| South Korea | |
| Australia | |
| Rest of Asia-Pacific | |
| Middle East | Saudi Arabia |
| United Arab Emirates | |
| Qatar | |
| Rest of Middle East | |
| Africa | South Africa |
| Egypt | |
| Nigeria | |
| Rest of Africa |
| By Attribution Model | Single-Touch Attribution | |
| Multi-Touch Attribution | ||
| Algorithmic and Probabilistic Attribution | ||
| By Deployment Mode | Cloud | |
| On-Premises | ||
| Hybrid | ||
| By Organization Size | Large Enterprises | |
| Small and Medium-Sized Enterprises | ||
| By End-User Industry | Retail and E-commerce | |
| BFSI | ||
| IT and Telecommunications | ||
| Media and Entertainment | ||
| Healthcare and Life Sciences | ||
| Travel and Hospitality | ||
| Consumer Goods | ||
| Other End-User Industries | ||
| By Geography | North America | United States |
| Canada | ||
| Mexico | ||
| South America | Brazil | |
| Argentina | ||
| Chile | ||
| Rest of South America | ||
| Europe | Germany | |
| United Kingdom | ||
| France | ||
| Italy | ||
| Spain | ||
| Rest of Europe | ||
| Asia-Pacific | China | |
| Japan | ||
| India | ||
| South Korea | ||
| Australia | ||
| Rest of Asia-Pacific | ||
| Middle East | Saudi Arabia | |
| United Arab Emirates | ||
| Qatar | ||
| Rest of Middle East | ||
| Africa | South Africa | |
| Egypt | ||
| Nigeria | ||
| Rest of Africa | ||


Key Questions Answered in the Report
What is the current value of marketing attribution services?
The marketing attribution services market was valued at USD 5.68 billion in 2025, is estimated at USD 6.52 billion in 2026, and is forecast to reach USD 13.01 billion by 2031 at a 14.80% CAGR. The forecast reflects continuing investment in measurement approaches that can operate across fragmented media environments and under more restrictive data conditions, as advertisers seek more reliable evidence for budget allocation, campaign testing, channel comparison, and longer-term planning across digital and offline activity.
What is driving demand for marketing attribution services?
Privacy-related signal loss, retail media growth, first-party data use, clean rooms, and the need for faster budget decisions are increasing demand. These factors are pushing advertisers to use several measurement methods rather than relying on final-click reporting alone, especially when channel data is incomplete.
Which attribution model has the largest share?
Multi-Touch Attribution (MTA) held a 48.24% market share in 2025, supported by its established use for journey-level channel optimization. Its use remains strongest where advertising and customer data can be linked across channels with sufficient consistency.
Which customer group is growing fastest?
SMEs are projected to grow at a 16.52% CAGR through 2031 as self-service tools and prebuilt integrations lower adoption barriers. Open-source frameworks can lower software costs, although organizations still need sufficient data quality and analytical support. Providers that reduce setup time and give practical help can make these capabilities useful for teams with limited technical staff.
Which end-user sector is growing fastest?
Healthcare and Life Sciences is forecast to expand at a 16.23% CAGR through 2031 as marketers adopt multi-touch and hybrid measurement. The shift reflects the need to understand longer, more regulated paths to patient and professional engagement across channels.
Which region is expanding fastest?
Asia-Pacific is projected to grow at a 16.32% CAGR through 2031, supported by e-commerce, mobile-first buyer journeys, and privacy-first measurement needs. Local privacy laws are adding to demand for approaches that can work without unrestricted movement of individual-level data between platforms and regions.
Page last updated on:





