Live Commerce Platforms Market Size and Share
Market Overview
| Study Period | 2019 - 2030 |
|---|---|
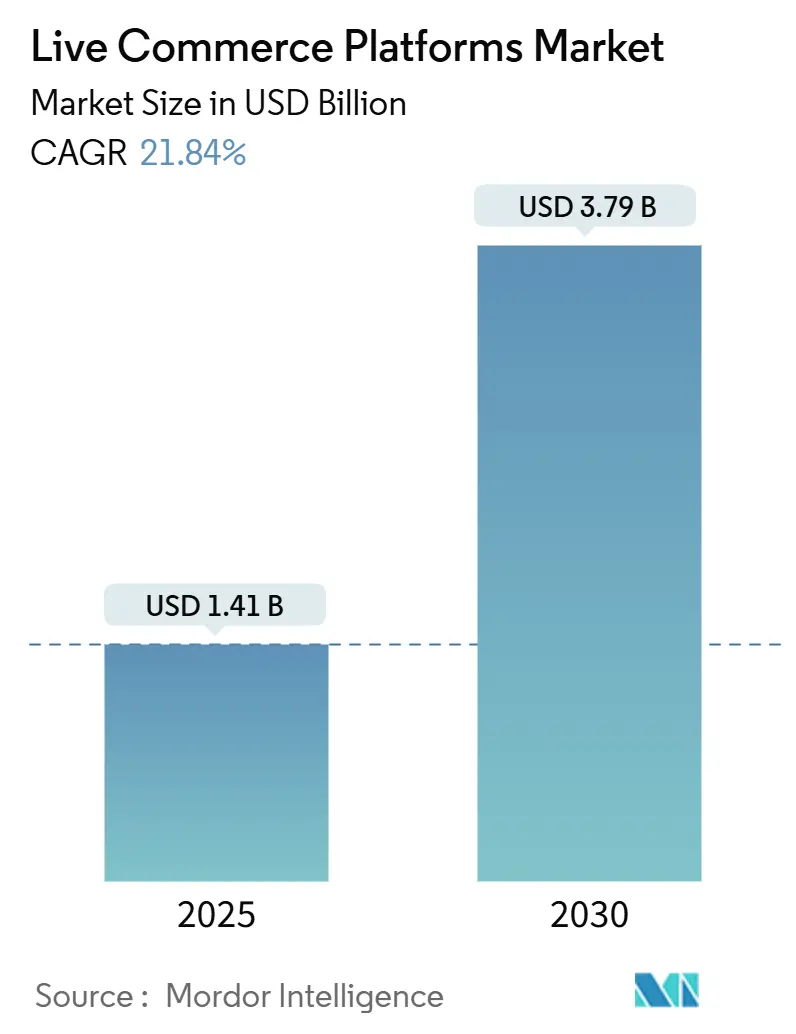
| Market Size (2025) | USD 1.41 Billion |
| Market Size (2030) | USD 3.79 Billion |
| Growth Rate (2025 - 2030) | 21.84% CAGR |
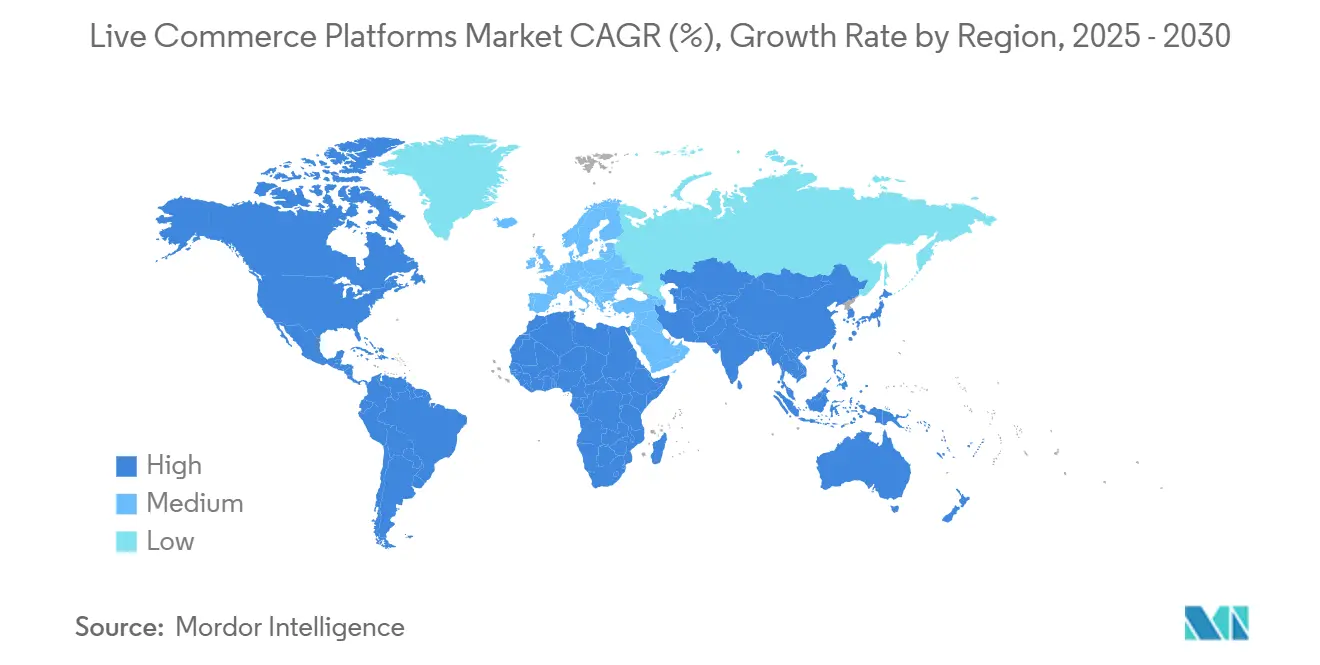
| Fastest Growing Market | Africa |
| Largest Market | Asia Pacific |
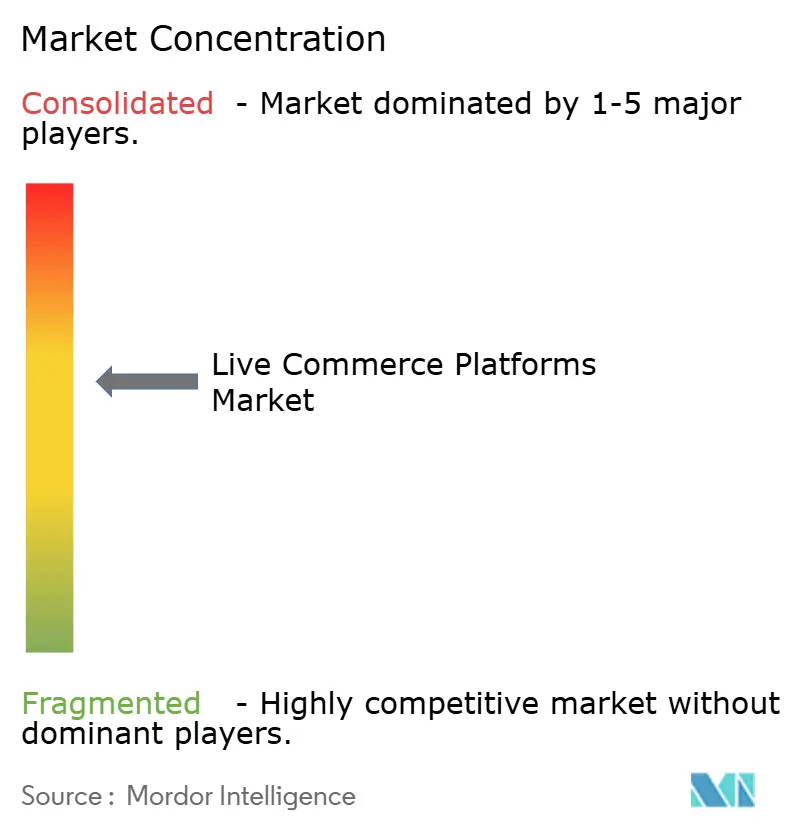
| Market Concentration | Medium |
Major Players *Disclaimer: Major Players sorted in no particular order Image © Mordor Intelligence. Reuse requires attribution under CC BY 4.0. | |
Live Commerce Platforms Market Analysis by Mordor Intelligence
The Live Commerce Platforms market size is valued at USD 1.41 billion in 2025 and is projected to reach USD 3.79 billion by 2030, translating into a 21.84% CAGR over the forecast period. Widespread 5G deployment, AI-driven recommendation engines, and mobile-first shopping habits are reshaping the Live Commerce Platforms market by blending real-time video engagement with one-click purchasing. Mobile applications currently account for a 54.89% share of the Live Commerce Platforms market, as faster networks eliminate latency and support high-definition streams that keep viewers engaged. AI personalization boosts average order values by showcasing relevant products mid-broadcast, while embedded shopping plugins encourage retailers to integrate live commerce features into existing web stores rather than launching standalone apps. The Asia Pacific holds a leading 46.92% share, yet Africa is expanding fastest as mobile penetration bypasses legacy retail channels. Competitive intensity remains moderate because social media titans, specialist start-ups, and white-label software vendors all vie for attention with differentiated content formats and data-driven merchandising.
Key Report Takeaways
- By product type, livestream marketplace platforms commanded 37.64% of the Live Commerce Platforms market share in 2024, whereas embedded livestream shopping plugins are expected to advance at a 22.78% CAGR through 2030.
- By business model, the B2C segment led with a 44.83% of the Live Commerce Platforms market share in 2024, while hybrid platforms are forecasted to expand at a 22.67% CAGR through 2030.
- By industry vertical, fashion and apparel captured 32.74% of the Live Commerce Platforms market size in 2024; however, beauty and personal care is set to grow at a 22.91% CAGR between 2025 and 2030.
- By platform type, mobile applications accounted for a 54.89% share of the Live Commerce Platforms market in 2024, and cross-platform omnichannel solutions are projected to rise at a 22.53% CAGR through 2030.
- By geography, Asia Pacific retained a 46.92% share of the Live Commerce Platforms market size in 2024, whereas Africa is expected to post a 22.78% CAGR through 2030.
Note: Market size and forecast figures in this report are generated using Mordor Intelligence’s proprietary estimation framework, updated with the latest available data and insights as of January 2026.
Global Live Commerce Platforms Market Trends and Insights
Drivers Impact Analysis*
| Driver | (~) % Impact on CAGR Forecast | Geographic Relevance | Impact Timeline |
|---|---|---|---|
| Proliferation of 5G networks | +4.2% | North America, China, South Korea | Medium term (2-4 years) |
| Rising smartphone penetration in emerging markets | +3.8% | Asia Pacific core, Middle East and Africa, Latin America | Long term (≥ 4 years) |
| Integration of AI-powered recommendation engines | +3.5% | Global, highest in developed economies | Short term (≤ 2 years) |
| Growing influence of Gen Z and millennials | +3.1% | Global, denser impact in urban areas | Medium term (2-4 years) |
| Expansion of cross-border fulfillment | +2.9% | Asia Pacific exporters to North America and Europe | Long term (≥ 4 years) |
| Brand adoption of in-house live studios | +2.7% | North America and Europe, seeding in Asia Pacific | Medium term (2-4 years) |
| Source: Mordor Intelligence | |||
Proliferation of 5G Networks Enhancing Video Streaming Quality
Ultra-low-latency 5G eliminates buffering that has historically caused viewer drop-off, allowing hosts to respond instantly to shopper questions. Mobile apps process 73% of live-commerce checkouts because 5G handles high-definition streams and interactive overlays without delays.[1]Qualcomm Technologies, “Qualcomm Announces Fourth Quarter and Fiscal 2024 Results,” investor.qualcomm.com Consumer electronics and beauty demonstrations benefit most from crisp detail and smooth motion, as these enhancements improve product assessment. Network providers confirm live commerce consumes 40% more bandwidth than standard video, yet 5G capacity absorbs the spike while sustaining quality across large concurrent audiences. Higher reliability persuades brands to schedule longer broadcasts that deepen storytelling and upsell opportunities, pushing the Live Commerce Platforms market toward mainstream retail adoption.
Rising Smartphone Penetration in Emerging Economies
Smartphone ownership now exceeds 54% in sub-Saharan Africa and 73% in Southeast Asia, allowing consumers to leapfrog desktop shopping and interact directly with live broadcasts.[2]GSMA Intelligence, “Mobile Economy Sub-Saharan Africa 2024,” gsma.com Localized payment wallets, vernacular audio tracks, and influencer hosts familiar with regional dialects raise engagement among first-time e-commerce users. Platforms active in these regions report conversion rates 2.3 times higher than in mature economies because live commerce simultaneously satisfies curiosity, fosters social bonding, and builds trust. The trend widens seller reach as niche artisans stream from rural areas, fueling grassroots participation and reinforcing mobile as the default channel for the Live Commerce Platforms market.
Integration of AI-Powered Product Recommendation Engines
Machine-learning models analyze chat keywords, viewing duration, and purchase histories to display real-time upsell banners, increasing average order values by 34%.[3]NVIDIA, “NVIDIA Announces Financial Results for Fourth Quarter and Fiscal 2024,” nvidianews.nvidia.com Predictive stock allocation prevents sell-outs during viral moments by reallocating inventory to warehouses nearest surging demand. Natural-language processing gauges sentiment and cues hosts to pivot at the right moment, keeping sessions lively. AI also automates closed captioning and multilingual translation, allowing broadcasters to scale across borders without duplicating production efforts. These capabilities reinforce stickiness and unlock monetization models ranging from dynamic pricing to personalized flash deals, accelerating revenue growth for the Live Commerce Platforms market.
Growing Influence of Gen Z and Millennial Shopping Behaviors
Digital-native cohorts value authenticity and social proof, spending 23 minutes per session watching live streams, compared to 8 minutes on conventional sites. Peer comments sway 78% of Gen Z buyers, turning chat into the modern endorsement engine. Integrated wallets support one-click in-stream purchases, reducing cart abandonment and increasing Live Commerce Platforms' market conversion rates. Younger viewers share clips 45% more often than older viewers, amplifying reach through viral loops at nearly zero marketing cost. Their demand for transparency also encourages platforms to display ethical sourcing details and sustainability badges live, boosting trust while elevating brands that align with their values.
Restraints Impact Analysis*
| Restraint | (~) % Impact on CAGR Forecast | Geographic Relevance | Impact Timeline |
|---|---|---|---|
| High customer acquisition costs | -2.8% | Global, most severe in saturated markets | Short term (≤ 2 years) |
| Regulatory scrutiny over influencer transparency | -2.1% | North America and Europe, spreading worldwide | Medium term (2-4 years) |
| Fragmented payment and logistics ecosystems | -1.9% | Middle East and Africa, Latin America, parts of Asia Pacific | Long term (≥ 4 years) |
| Livestream content fatigue | -1.6% | Mature markets with dense live content | Medium term (2-4 years) |
| Source: Mordor Intelligence | |||
High Customer Acquisition Costs for Platform Operators
As content volume climbs, viewer attention becomes scarce, driving average acquisition outlays to USD 47 per user in developed regions, nearly quadruple standard e-commerce benchmarks. Production-quality expectations push platforms to hire professional hosts and studios, inflating fixed costs ahead of monetization. Social networks that integrate live shopping features leverage existing communities at a lower incremental spend, squeezing smaller firms that rely on paid ads to attract audiences. Sustaining high engagement thus requires a delicate balance between marketing budgets and creator incentives, tempering the near-term expansion of the Live Commerce Platforms market.
Regulatory Scrutiny Over Influencer Endorsement Transparency
Stricter disclosure rules require hosts to flag paid partnerships in real-time, thereby increasing compliance overhead and potentially diminishing the persuasive appeal. Platforms must also store audit trails of algorithmic recommendations under the European Union’s Digital Services Act, prompting costly system upgrades and legal reviews. Failure to meet standards risks fines or forced feature changes, which can complicate global rollouts where requirements diverge by jurisdiction. Although transparency can boost long-term trust, short-term uncertainty slows platform experimentation and deters some advertisers from fully funding live initiatives.
*Our forecasts treat driver/restraint impacts as directional, not additive. The impact forecasts reflect baseline growth, mix effects, and variable interactions.
Segment Analysis
By Product Type: Embedded Solutions Drive Platform Integration
Embedded livestream shopping plugins accounted for 22.78% of the Live Commerce Platforms market size in 2024 and are forecast to post the fastest CAGR through 2030. Retailers prefer augmenting existing websites with plug-and-play modules rather than migrating to new ecosystems, protecting prior IT investments and preserving SEO authority. Seamless checkout within branded storefronts prevents traffic leakage, while real-time APIs feed inventory status to on-screen product cards. Livestream marketplace platforms still hold a 37.64% market share in Live Commerce Platforms, thanks to their built-in audiences; however, embedded options entice heritage brands that demand full control over customer data and visual identity. Social media live commerce tools sit between these extremes, monetizing vast user bases by integrating shoppable tags during influencer broadcasts. White-label suites cater to enterprises seeking multi-region compliance and in-depth analytics, highlighting the diverse paths that fuel revenue growth across the Live Commerce Platforms market.
Hybrid offerings that package marketplace discovery with embeddable widgets are gaining momentum because they let sellers simulcast on multiple domains while centralizing order management. AI-driven moderation filters comments to shield brand reputation, and low-code design studios democratize video banner creation for non-technical teams. These advantages shorten deployment cycles from months to weeks, freeing marketing budgets for on-air talent and paid amplification. As plugin libraries mature, they will anchor omnichannel strategies that sync in-store events, web pop-ups, and social promotions under one dashboard, cementing embedded solutions as a structural pillar of the Live Commerce Platforms market.


By Business Model: Hybrid Platforms Reshape Commerce Architecture
The B2C format captured 44.83% of 2024 revenue, serving brand-owned stores that value direct data capture and streamlined fulfillment. In contrast, hybrid platforms blending B2C and C2C supply are expanding at a 22.67% CAGR as they unlock broader catalog depth and dynamic pricing. Consumers appreciate the variety of official launches alongside peer-resale bargains within a single session, boosting stickiness and average watch time. Sellers leverage elastic commission structures, shifting between fixed fees and revenue shares based on inventory risk tolerance. This flexibility appeals to mid-sized labels and independent creators alike, enlarging the addressable pool of broadcasters on Live Commerce Platform market venues.
C2C live commerce excels in Asia Pacific, where community trust supersedes brand authority, enabling micro-entrepreneurs to stream from home and clear inventory quickly. B2B adoption remains niche, but it is rising for industrial tools and raw materials, where live demos clarify specifications more effectively than static catalogs. Overall, hybridization signals the maturation of the Live Commerce Platforms market, evolving from siloed verticals into fluid ecosystems that mirror offline bazaar dynamics online.
By Industry Vertical: Beauty Accelerates Past Fashion Leadership
Fashion and apparel retained a 32.74% market share of Live Commerce Platforms in 2024, owing to its inherent reliance on visual storytelling. Hosts layer styling tips, size guidance, and limited-time discounts that resolve typical e-commerce hesitations about fit and return hassle. Beauty and personal care, however, is scaling faster at a 22.91% CAGR because real-time swatching and influencer trust sharply reduce perceived risk in color selection. Skin-tone matching filters and close-up cams convert curiosity into confident purchases, often within minutes of product reveal. Beauty brands also schedule pulse events around new-season drops, generating appointment viewing that spikes the Live Commerce Platforms market size momentarily and establishes recurring revenue peaks.
Consumer electronics leverage live Q&A sessions to demystify specs, while home and living broadcasts enable interior designers to virtually stage rooms, sparking complementary basket additions. Food and grocery players stream cooking tutorials that weave brand provenance into recipe narratives, fostering loyalty. Cross-category platforms, therefore, harness synergies between fashion, beauty, and lifestyle content, driving longer sessions that boost cross-sell ratios and cement the appeal of Live Commerce Platforms to advertisers seeking multi-vertical exposure.

By Platform Type: Omnichannel Solutions Bridge Digital Divides
Mobile apps accounted for 54.89% of the 2024 Live Commerce Platforms market share, underscoring the always-on companion role smartphones play in modern retail journeys. Yet cross-platform omnichannel solutions are growing at 22.53% CAGR because shoppers drift among mobile, web, and connected TV without linear paths. Single sign-on profiles carry wish-lists across devices, while cloud sync resumes paused streams on larger screens for group viewing experiences. Brands use QR hand-off codes on smart TVs to redirect checkouts back to phones, reducing remote-control friction and maintaining payment security. Web-based dashboards continue to attract professional buyers who require detailed spec sheets, while smart-TV apps appeal to older demographics with their lean-back comfort. Such versatility confirms that omnichannel frameworks will dictate future feature roadmaps in the Live Commerce Platforms market.
Voice commands and gesture recognition enhance accessibility, allowing viewers with mobility constraints to shop hands-free. Contextual ad engines personalize overlay offers based on household profiles, raising monetization opportunities. As 5G fixed wireless and Wi-Fi 7 expand bandwidth to living rooms, connected TV commerce will graduate from experimental to essential. Platform operators that integrate analytics across every screen will secure richer first-party data, thereby strengthening their bargaining power with advertisers and supply partners who pursue granular audience segments.
Geography Analysis
The Asia Pacific generated 46.92% of 2024 revenue, driven by China’s mature ecosystems and the rapid adoption in Indonesia, Vietnam, and Thailand, where social commerce norms favor interactive shopping. Domestic e-wallets and same-day fulfillment services streamline the checkout and delivery process, reinforcing loyalty and increasing frequency. African markets contribute a modest base yet post the highest 22.78% CAGR, driven by the affordability of mobile data and entrepreneurial sellers transforming broadcast rooms into digital stalls. Partnerships with telecom operators offering zero-rated streaming packages further widen reach.
North America’s growth relies on technology giants integrating live features into existing social networks, reducing friction for both users and merchants. U.S. brands are increasingly operating studio spaces adjacent to warehouses to accelerate the pick-pack-ship cycle, thereby enhancing the perceived immediacy.
Europe lags in adoption due to stricter privacy regulations, yet it records strong performance in luxury, where limited-edition drops and exclusive backstage content justify premium price points. Latin America is seeing traction in Brazil and Mexico as localized payment gateways achieve scale, while the cultural emphasis on storytelling aligns well with host-led product narratives.
The Middle East leverages high disposable incomes and an appetite for exclusive goods; duty-free live tours and personal shopper streams cater to affluent audiences seeking bespoke service. Such regional nuances validate a diversified go-to-market strategy for any entrant eyeing the Live Commerce Platforms market.

Competitive Landscape
The Live Commerce Platforms market remains moderately fragmented, with no single entity owning more than one-third of global revenue. Social media leaders repurpose vast user bases by attaching shoppable overlays, while specialist vendors differentiate through vertical expertise and white-label flexibility. Recent acquisitions, such as Alibaba’s purchase of Livescale, demonstrate consolidation aimed at bundling technology stacks and accelerating cross-border expansion. Creator funds from Meta and Amazon incentivize influencers to produce exclusive shows, sharpening content arsenals that drive viewer loyalty. AI personalization, latency optimization, and compliance readiness constitute the three dominant competitive axes.
Niche players carve out defensible turf by focusing on collectibles, automotive accessories, or regional languages underserved by megaplatforms. Enterprise suites target B2B sectors with tailored onboarding, bulk pricing modules, and CRM integrations. Price competition centers on commission rates and advertising packages, rather than subscription fees, as platforms primarily monetize through sales take rates and sponsored product boosts.
Regulatory alignment, particularly in terms of disclosure and data security, has become a significant market-entry barrier; operators with proactive governance frameworks are more likely to secure partnerships with multinational brands that are wary of reputational risk. Overall, alliances among payment processors, logistics providers, and telecoms underpin a co-opetitive environment that is likely to persist as the Live Commerce Platforms market matures.
Live Commerce Platforms Industry Leaders
Alibaba Group Holding Limited
Amazon.com, Inc.
ByteDance Ltd.
Kuaishou Technology
Meta Platforms, Inc.
- *Disclaimer: Major Players sorted in no particular order

Recent Industry Developments
- August 2025: Alibaba debuted AI-generated avatar hosts on Tmall Live, enabling 24-hour programming that dynamically adjusts product recommendations based on viewer engagement metrics.
- June 2025: Google rolled out instant multi-language captioning for YouTube Shopping Live, using on-device AI to translate and display subtitles in 15 languages during a single broadcast.
- April 2025: Meta activated end-to-end encrypted payments for WhatsApp Live Shopping in Brazil and India, letting small businesses host shoppable broadcasts that settle transactions directly within chat.
- March 2025: Amazon introduced Prime Live Deals, embedding one-click checkout and real-time inventory updates into Prime Video’s live shopping shows, allowing viewers to complete a purchase without leaving the stream.


Global Live Commerce Platforms Market Report Scope
| Livestream Marketplace Platforms |
| Embedded Livestream Shopping Plugins |
| Social Media Live Commerce Tools |
| White-Label Live Shopping Software |
| Other Product Type |
| Business-to-Consumer (B2C) Platforms |
| Business-to-Business (B2B) Platforms |
| Consumer-to-Consumer (C2C) Platforms |
| Hybrid Platforms |
| Fashion and Apparel |
| Beauty and Personal Care |
| Consumer Electronics |
| Home and Living |
| Food and Grocery |
| Other Industry Vertical |
| Web-Based Platforms |
| Mobile Applications |
| Cross-Platform Omni Channel Solutions |
| Smart TV and OTT Applications |
| North America | United States | |
| Canada | ||
| Mexico | ||
| Europe | Germany | |
| United Kingdom | ||
| France | ||
| Russia | ||
| Rest of Europe | ||
| Asia-Pacific | China | |
| Japan | ||
| India | ||
| South Korea | ||
| Australia | ||
| Rest of Asia-Pacific | ||
| Middle East and Africa | Middle East | Saudi Arabia |
| United Arab Emirates | ||
| Rest of Middle East | ||
| Africa | South Africa | |
| Egypt | ||
| Rest of Africa | ||
| South America | Brazil | |
| Argentina | ||
| Rest of South America | ||
| By Product Type | Livestream Marketplace Platforms | ||
| Embedded Livestream Shopping Plugins | |||
| Social Media Live Commerce Tools | |||
| White-Label Live Shopping Software | |||
| Other Product Type | |||
| By Business Model | Business-to-Consumer (B2C) Platforms | ||
| Business-to-Business (B2B) Platforms | |||
| Consumer-to-Consumer (C2C) Platforms | |||
| Hybrid Platforms | |||
| By Industry Vertical | Fashion and Apparel | ||
| Beauty and Personal Care | |||
| Consumer Electronics | |||
| Home and Living | |||
| Food and Grocery | |||
| Other Industry Vertical | |||
| By Platform Type | Web-Based Platforms | ||
| Mobile Applications | |||
| Cross-Platform Omni Channel Solutions | |||
| Smart TV and OTT Applications | |||
| By Geography | North America | United States | |
| Canada | |||
| Mexico | |||
| Europe | Germany | ||
| United Kingdom | |||
| France | |||
| Russia | |||
| Rest of Europe | |||
| Asia-Pacific | China | ||
| Japan | |||
| India | |||
| South Korea | |||
| Australia | |||
| Rest of Asia-Pacific | |||
| Middle East and Africa | Middle East | Saudi Arabia | |
| United Arab Emirates | |||
| Rest of Middle East | |||
| Africa | South Africa | ||
| Egypt | |||
| Rest of Africa | |||
| South America | Brazil | ||
| Argentina | |||
| Rest of South America | |||


Key Questions Answered in the Report
What revenue can Live Commerce Platforms generate by 2030?
Forecasts point to USD 3.79 billion by 2030, reflecting a 21.84% CAGR from 2025.
Which region leads adoption of live shopping broadcasts?
Asia Pacific commands 46.92% share due to China and rapid uptake in Southeast Asian nations.
Why are embedded livestream shopping plugins important?
They let retailers add live commerce to existing sites, fueling the fastest 22.78% CAGR among product types.
How fast is the beauty segment growing in live commerce?
Beauty and personal care revenue is set to climb at a 22.91% CAGR, outpacing fashion.
What challenges do operators face with influencer marketing rules?
Stricter disclosure and algorithm transparency raise compliance costs and can reduce short-term conversion effectiveness.
Which business model shows the highest growth momentum?
Hybrid platforms mixing brand and peer-to-peer supply are projected to rise at a 22.67% CAGR through 2030.
Page last updated on:


