Lithuania Data Center Market Size and Share
Market Overview
| Study Period | 2019 - 2030 |
|---|---|
| Forecast Data Period | 2025 - 2030 |
| Historical Data Period | 2019 - 2023 |
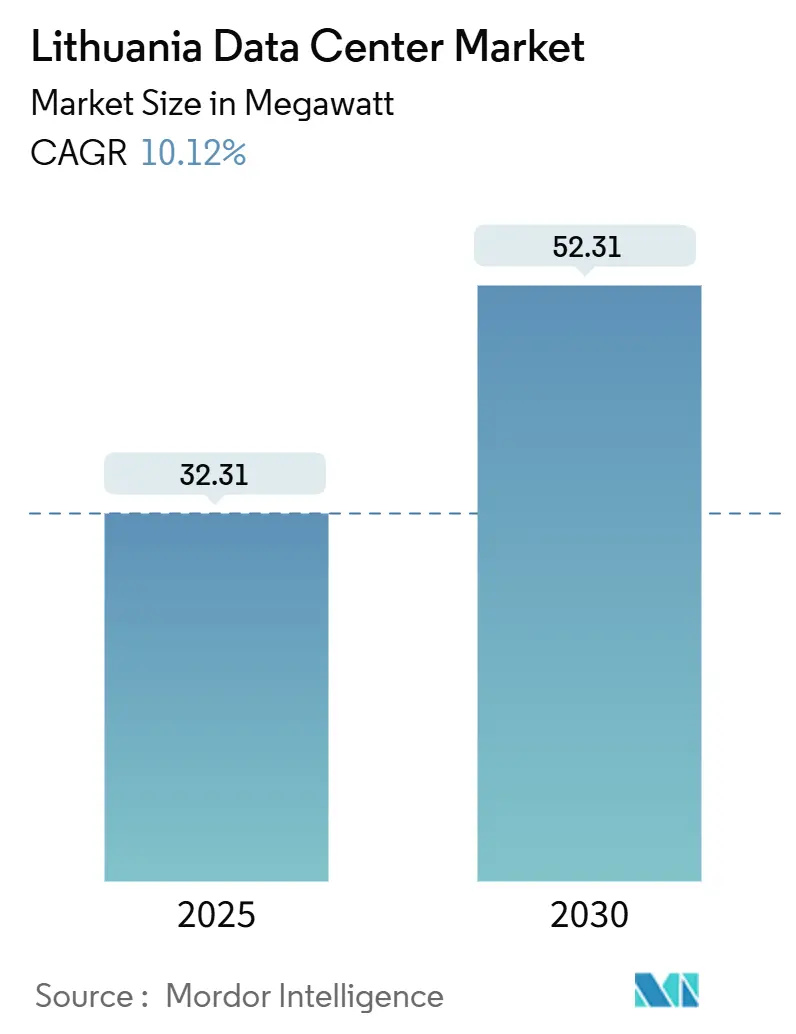
| Market Volume (2025) | 32.31 megawatt |
| Market Volume (2030) | 52.31 megawatt |
| Growth Rate (2025 - 2030) | 10.12% CAGR |
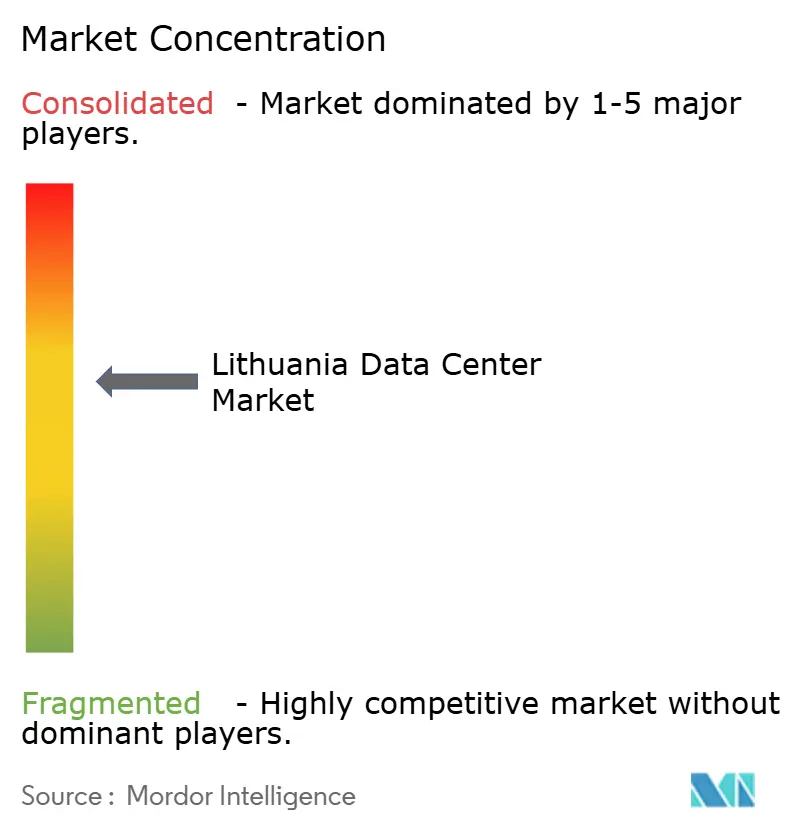
| Market Concentration | Medium |
Major Players *Disclaimer: Major Players sorted in no particular order Image © Mordor Intelligence. Reuse requires attribution under CC BY 4.0. | |
Lithuania Data Center Market Analysis by Mordor Intelligence
The Lithuania data center market size stood at 32.31 MW in 2025 and is forecast to reach 52.31 MW by 2030, expanding at a 10.12% CAGR over the period. Robust capacity additions position the country as a Baltic digital infrastructure hub, thanks to its strategic location between Eastern and Western Europe, exceptional fiber-optic penetration, and near-universal 5G coverage. Demand is concentrated in Vilnius, where 70% of the installed power is already live, while Klaipėda is accelerating on the back of port-driven connectivity projects and the completion of the 3,000 km Baltic Highway, which delivers 35 ms latency to Frankfurt. Clear policy support, including EUR 147 million (USD 170.56 million) earmarked for public-sector digitalization in 2025, and renewable-energy targets of 30% by 2025, underpin investor confidence. Operators, however, face rising construction costs of EUR 10-12 million (USD 11.60 - 13.92 million) per MW for Tier III builds and pockets of limited grid redundancy outside the capital.
Key Report Takeaways
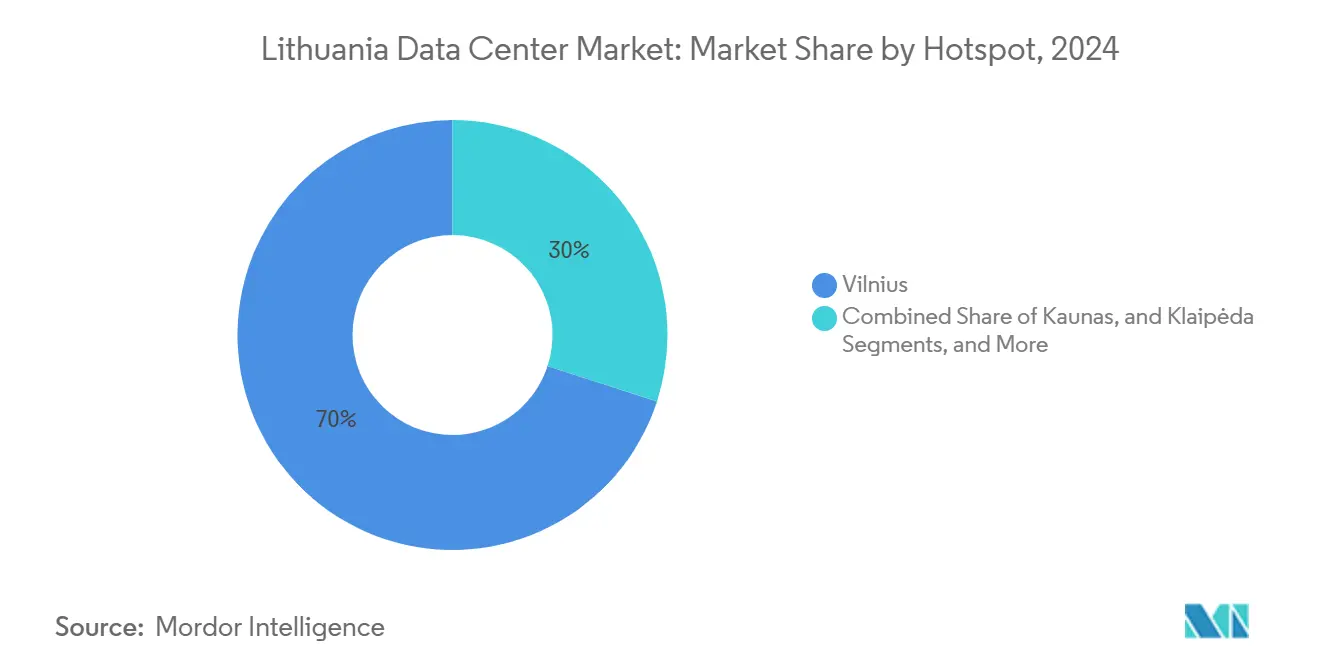
- By hotspot, Vilnius led with a 70% Lithuania data center market share in 2024, while Klaipėda recorded the fastest CAGR at 11.09% through 2030.
- By data-center size, large facilities captured 49% share of the Lithuania data center market size in 2024 and mega sites are projected to expand at 10.3% CAGR to 2030.
- By tier, Tier III accounted for 71% of capacity in 2024, whereas Tier IV is advancing at an 11.5% CAGR on hyperscale demand.
- By absorption, utilized-hyperscale capacity posted a 12.6% CAGR, lifting the utilized slice to 53% of the market in 2024.
Lithuania Data Center Market Trends and Insights
Drivers Impact Analysis*
| Driver | (~) % Impact on CAGR Forecast | Geographic Relevance | Impact Timeline |
|---|---|---|---|
| Cloud and hyperscale-adoption boom | +2.8% | Vilnius and Kaunas | Medium term (2-4 years) |
| 5G-enabled edge-computing rollout | +2.1% | Nationwide; early gains in Vilnius, Kaunas, Klaipėda | Short term (≤2 years) |
| EU Digital Single Market and Baltic connectivity incentives | +1.9% | Baltic region with EU spillover | Long term (≥4 years) |
| Renewable-energy surplus for green computing | +1.7% | Coastal and rural areas | Medium term (2-4 years) |
| AI start-up HPC colocation demand in Vilnius | +1.2% | Vilnius, secondary in Kaunas | Short term (≤2 years) |
| Lithuania as route-diversity node for new Baltic subsea cables | +0.5% | Coastal regions | Long term (≥4 years) |
| Source: Mordor Intelligence | |||
Cloud and Hyperscale-Adoption Boom
Businesses are shifting from legacy on-premises IT to hybrid and multi-cloud setups, and more than 900 fintech and software start-ups clustered in Vilnius now require scalable compute resources that conventional enterprise rooms cannot provide. Public-sector workloads add further tailwinds, with EUR 147 million (USD 170.56 million) in government funds accelerating cloud migration.[1]Invest Lithuania, “Lithuania Europe’s No. 1 in Fibre-Optic Internet Penetration,” investlithuania.com Hyperscale providers view the Lithuania data center market as a latency-efficient alternative to Amsterdam or Frankfurt, underpinning a 12.6% utilized-hyperscale CAGR.
5G-Enabled Edge-Computing Rollout
Telia has lit 1,580 base stations, providing the nation with 99% population coverage and an average mobile downlink of 250.9 Mb/s.[2]Ericsson, “Telia Achieves 99 Percent 5G Coverage in Lithuania,” ericsson.com Sub-10 ms latencies unlock micro-data center demand for manufacturing, public safety, and smart city services, with Teltonika already shipping industrial 5G routers for on-site deployments.
EU Digital Single Market and Baltic Connectivity Incentives
Completion of the 3,000 km Baltic Highway diversifies north-south routes and cuts round-trip latency to Frankfurt to 35 ms, giving operators a GDPR-compliant hosting node inside the EU core. The NordBalt HVDC link adds 700 MW of import flexibility and lets data centers procure Nordic green power.[3]Hitachi Energy, “NordBalt,” hitachienergy.com
Renewable-Energy Surplus for Green Computing
Wind and solar output rose 79.4% year-on-year in 2024, lifting renewables to 24.9% of inland consumption. Power Purchase Agreements let operators hedge energy costs and market carbon-neutral services, a strategy underscored by Delska’s “most sustainable data center in the Baltics” claim.
Restraints Impact Analysis*
| Restraint | (~) % Impact on CAGR Forecast | Geographic Relevance | Impact Timeline |
|---|---|---|---|
| Limited grid redundancy outside Vilnius metro | -1.8% | Kaunas, Klaipėda, rural zones | Medium term (2-4 years) |
| Rising construction and financing costs | -1.5% | National | Short term (≤2 years) |
| Bilingual certified-engineer talent shortage | -1.2% | National | Long term (≥4 years) |
| Emerging local data-sovereignty clauses | -0.8% | National | Medium term (2-4 years) |
| Source: Mordor Intelligence | |||
Limited Grid Redundancy Outside Vilnius Metro
Electricity demand reached 13.4 TWh in 2025, yet 64.2% of supply was imported, exposing secondary cities to supply risks during peaks. Lacking dual feeds, operators in Kaunas and Klaipėda incur 15-20% higher capital outlays for backup systems.
Rising Construction and Financing Costs
Building a Tier III hall now costs EUR 10-12 million (USD 11.60-13.92 million) per MW, a 40-50% premium over leasing, due to material inflation and skilled labor scarcity. Tighter work visa quotas, at 1.4% of the population, inflate wages for specialist trades.
*Our forecasts treat driver/restraint impacts as directional, not additive. The impact forecasts reflect baseline growth, mix effects, and variable interactions.
Segment Analysis
By Hotspot: Vilnius Dominance Drives Regional Expansion
Vilnius controlled 70% of the installed power in 2024, a share underpinned by its proximity to regulators, financial institutions, and the Tech Zity start-up district. Klaipėda grew at a 11.09% CAGR due to port-led fiber upgrades, while Kaunas held a 15% share as a manufacturing node. The Lithuania data center market anticipates deeper geographic spread as nationwide 5G narrows urban–rural connectivity gaps.
A second wave of investment targets secondary cities where land costs are lower and municipal incentives include tax holidays. European Investment Bank financing of EUR 50 million (USD 58.01 million) for Teltonika’s Molėtai IoT campus signals confidence in distributed architectures.


By Data-Center Size: Large Facilities Lead Market Maturation
Large halls made up 49% of capacity in 2024, reflecting economies of scale in power, cooling, and carrier density. Mega sites, though fewer, are forecast to post a 10.3% CAGR on hyperscale and AI cluster demand, while small and medium sites remain relevant for edge and disaster-recovery use cases. The Lithuania data center market size for mega builds will benefit from renewable PPAs that lock in long-term power pricing.
Operators deploying ≥20 MW campuses adopt wet-film and intelligent modular cooling patents to fit dense, >30 kW racks without breaching 1.2 PUE targets. Smaller facilities pivot toward sector-specific compliance, such as health-data zones that require local residency.
By Tier Standard: Tier III Reliability Meets Tier IV Innovation
Tier III supplied 71% of Lithuanian capacity in 2024 because it balances four-nines uptime with lower capex. Lithuania data center market share for Tier IV, however, is on a steep 11.5% CAGR as banks and state systems push for zero-downtime SLAs. Strict GDPR enforcement-illustrated by a EUR 2.4 million (USD 2.78 million) fine on Vinted-reinforces demand for certified, high-security halls.
Continuous cooling and modular UPS blocks help Tier IV builds keep power overheads in check. Skilled labor, buoyed by EU-leading ICT literacy rates, supports the complex operations these facilities require.

By Absorption: Utilized Capacity Drives Hyperscale Growth
Utilized racks represented 53% of installed power in 2024, and hyperscale footprints grew 12.6% annually, boosted by Telia’s national 800 Gb/s backbone. Retail colocation kept pace with SME cloud migration, while wholesale blocks found buyers in media-streaming and crypto-asset operators compliant with MiCA.
The Lithuania data center market expects speculative shells to fall from 47% vacancy to the low 30s by 2027 as new cables and PPAs reach commercial operation.
Geography Analysis
The Lithuania data center market remains city-centric, yet its future lies in a network of smaller edge nodes. Vilnius enjoys resilient dual-feed grids and the densest carrier hotels, sustaining a 70% stronghold. Kaunas and Klaipėda are gaining momentum due to their logistics corridors and maritime trade. Nationwide fiber penetration highest in Europe-confers a unique advantage to rural municipalities pursuing Industry 4.0 applications.
Port facilities are early adopters of standalone 5G and containerized micro-data centers for real-time cargo tracking, aligning with Klaipėda’s 11.09% CAGR. In Kaunas, electronics manufacturing generates low-latency demand for computer vision quality control. The NordBalt link equalizes grid access across regions, allowing new sites to source 100% hydropower at Nordic spot prices.
Edge builds in tourist districts such as Druskininkai emerge to serve seasonal surges in streaming and gaming traffic, demonstrating that the Lithuania data center market can balance core and edge growth without sacrificing SLA integrity.
Competitive Landscape
The Lithuania data center industry hosts a mosaic of telecom incumbents, specialist colocation firms, and incoming cloud giants. Telia leverages integrated fiber-mobile assets and invested USD 73.81 million in 2024 to harden its backbone. Delska differentiates itself through 100% renewable PPAs and innovative cooling solutions.
International platforms such as Vantage size the Lithuania data center market as an overflow node for Northern Europe, chasing customers that require sub-50 ms round trips but reject the higher costs of legacy FLAP hubs.
Competition centers on energy efficiency, carrier-neutral ecosystems, and sovereign-cloud credentials. Patent-backed cooling systems, recycled-heat urban-heating loops, and build-to-suit hyperscale shells are the leading strategic levers. Fragmentation remains moderate; the top five operators control near-45% of live MW, leaving room for consolidation once utilization tightens.
Lithuania Data Center Industry Leaders
IBM (CSP)
BaCloud
Data Logistics Center
AmberCore Data Center
Baltneta
- *Disclaimer: Major Players sorted in no particular order

Recent Industry Developments
- January 2025: Baltic Highway fiber-optic network began operations, slashing Vilnius–Frankfurt latency to 35 ms.
- February 2025: Vantage Data Centers disclosed a EUR 1.4 billion (USD 1.62 billion) expansion budget for its EMEA platform.
- October 2024: Delska topped out a carbon-neutral facility branded the Baltics’ most sustainable.
- July 2024: Telia Lithuania posted 4.8% revenue growth and 19.7% EBITDA uplift on strong IT-services demand.


Lithuania Data Center Market Report Scope
| Vilnius |
| Kaunas |
| Klaipėda |
| Rest of Lithuania |
| Small |
| Medium |
| Large |
| Mega |
| Tier I–II |
| Tier III |
| Tier IV |
| Utilized | By Colocation Type | Hyperscale |
| Retail | ||
| Wholesale | ||
| By End-User | BFSI | |
| Cloud | ||
| E-Commerce | ||
| Government | ||
| Manufacturing | ||
| Media and Entertainment | ||
| Telecom | ||
| Other End-User | ||
| Non-Utilized | ||
| By Hotspot | Vilnius | ||
| Kaunas | |||
| Klaipėda | |||
| Rest of Lithuania | |||
| By Data-Center Size | Small | ||
| Medium | |||
| Large | |||
| Mega | |||
| By Tier Standard | Tier I–II | ||
| Tier III | |||
| Tier IV | |||
| By Absorption | Utilized | By Colocation Type | Hyperscale |
| Retail | |||
| Wholesale | |||
| By End-User | BFSI | ||
| Cloud | |||
| E-Commerce | |||
| Government | |||
| Manufacturing | |||
| Media and Entertainment | |||
| Telecom | |||
| Other End-User | |||
| Non-Utilized | |||


Key Questions Answered in the Report
How large is the Lithuania data center market in 2025?
Installed IT power reached 32.31 MW in 2025 and is forecast to rise to 52.31 MW by 2030.
Which city leads data-center deployment?
Vilnius hosts 70% of national capacity due to superior grid redundancy and carrier density.
What is the fastest-growing hotspot?
Klaipėda posts an 11.09% CAGR through 2030, driven by port-based fiber upgrades.
Why are operators choosing Lithuania over FLAP hubs?
Lower latency to Nordics, abundant renewable energy, and GDPR compliance attract hyperscale builds
How much does it cost to build a Tier III MW of capacity?
Total development outlay is EUR 10-12 million per MW, up 15-20% since 2024
What share of power uses renewable energy?
Renewable sources already cover 24.9% of inland consumption, on track for the 30% target by 2025.
Page last updated on:


