Life Science And Chemical Instrumentation Market Size and Share
Market Overview
| Study Period | 2020 - 2031 |
|---|---|
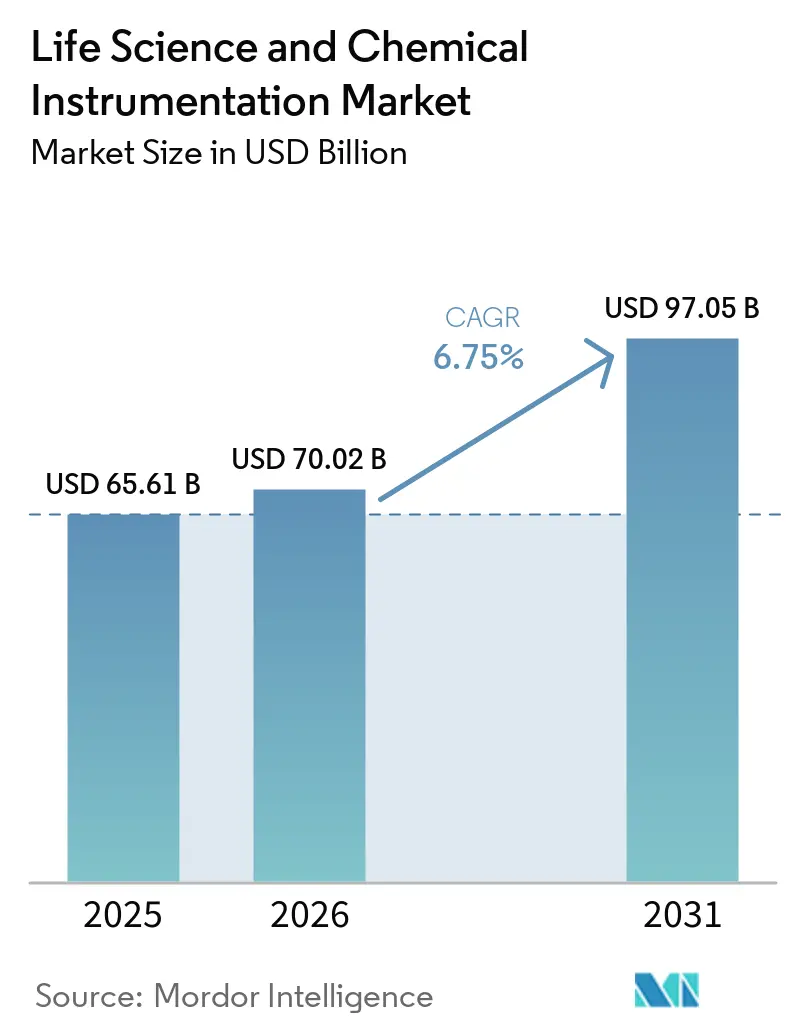
| Market Size (2026) | USD 70.02 Billion |
| Market Size (2031) | USD 97.05 Billion |
| Growth Rate (2026 - 2031) | 6.75% CAGR |
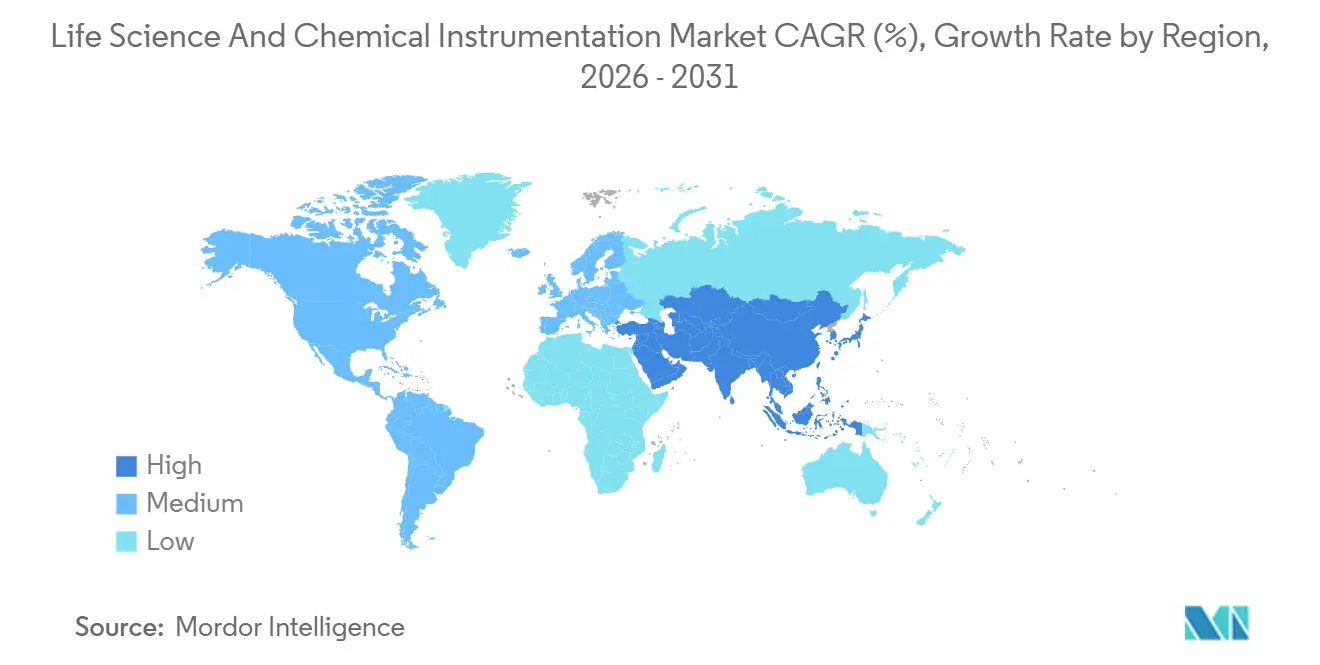
| Fastest Growing Market | Asia-Pacific |
| Largest Market | North America |
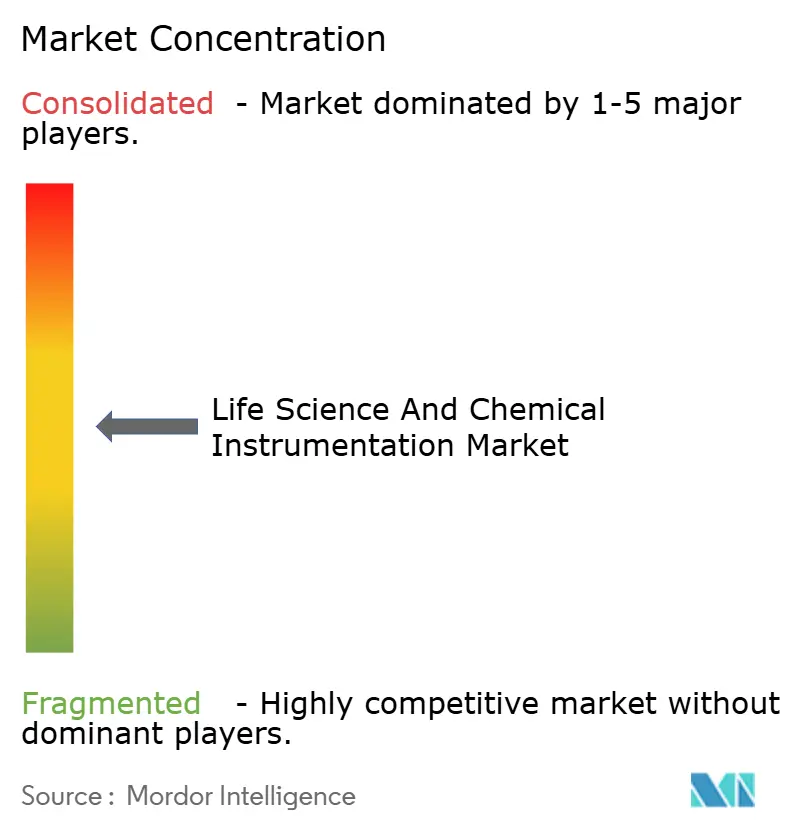
| Market Concentration | Medium |
Major Players *Disclaimer: Major Players sorted in no particular order Image © Mordor Intelligence. Reuse requires attribution under CC BY 4.0. | |
Life Science And Chemical Instrumentation Market Analysis by Mordor Intelligence
The Life Science And Chemical Instrumentation Market size is projected to be USD 65.61 billion in 2025, USD 70.02 billion in 2026, and reach USD 97.05 billion by 2031, growing at a CAGR of 6.75% from 2026 to 2031.
Demand is rising as pharmaceutical and biotechnology sponsors shift capital from fixed-asset ownership toward subscription models that bundle chromatography, mass spectrometry, and sequencing platforms with uptime guarantees, easing cash-flow constraints while locking buyers into proprietary consumables. New regulatory guidelines that favor organ-on-chip assays and real-time pharmacovigilance accelerate the replacement of legacy spectrometers, creating space for cloud-connected, data-integrity–ready instruments offered by vertically integrated suppliers. Asia-Pacific governments deploy production-linked incentives and capital subsidies that cut the total cost of ownership by up to 20%, encouraging multinationals to open regional application laboratories that shorten service lead times and enable local-currency leasing. At the same time, vendor competition is migrating from hardware margins toward lifecycle revenues from consumables, software subscriptions, and instrument-as-a-service contracts that guarantee uptime and analytics support.
Key Report Takeaways
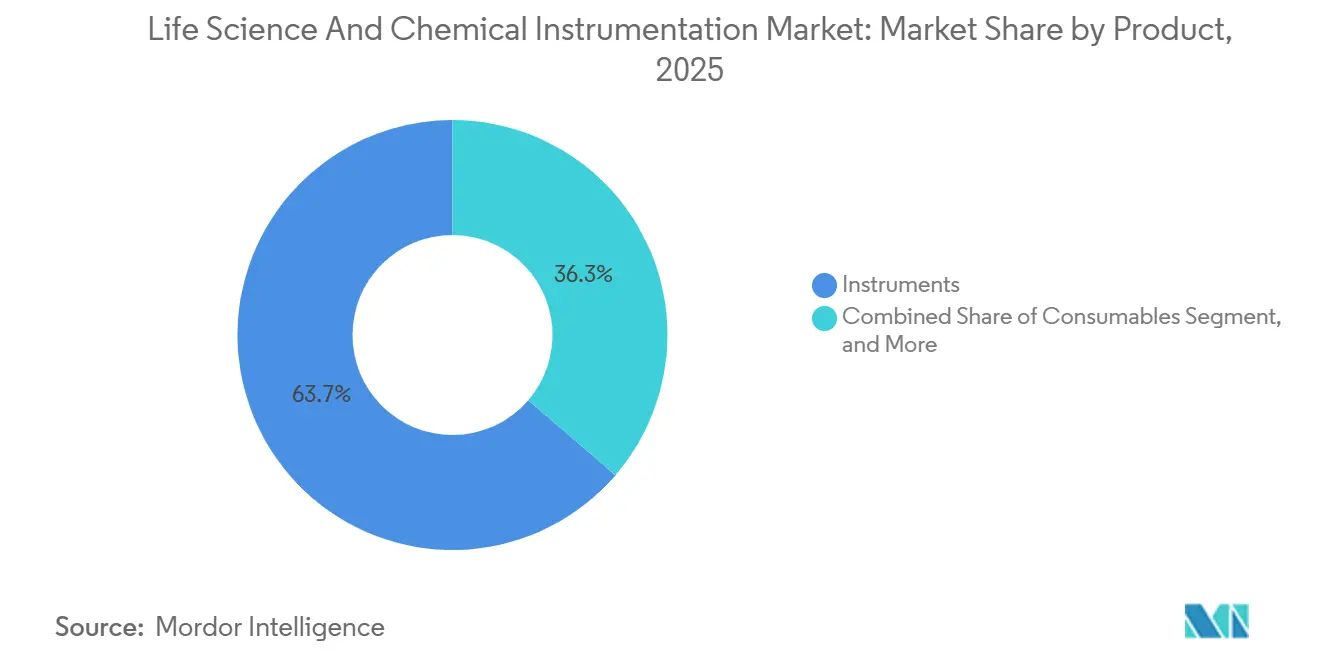
- By product, instruments accounted for 63.66% of the life science and chemical instrumentation market size in 2025, whereas consumables will be the fastest-growing component at a 7.23% CAGR to 2031.
- By technology, chromatography led with 32.50% of the life science and chemical instrumentation market share in 2025, while polymerase chain reaction systems are forecast to expand at a 7.01% CAGR through 2031.
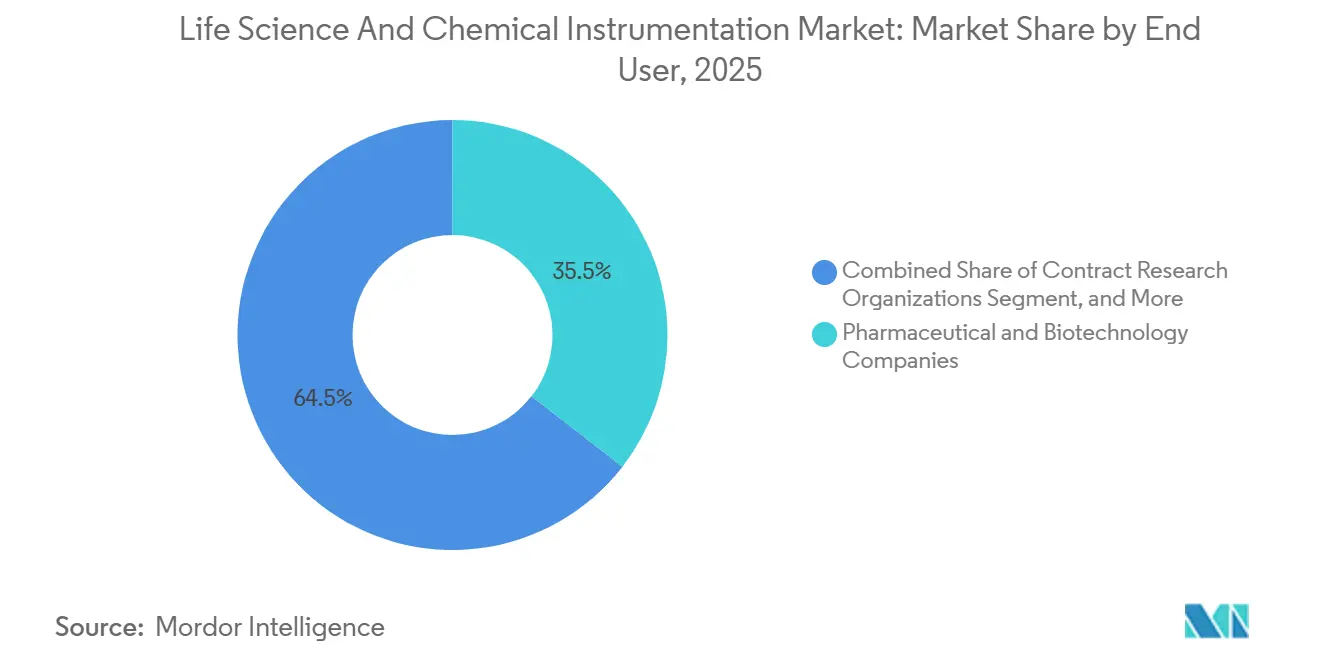
- By end-user, pharmaceutical and biotechnology companies held 35.50% revenue share in 2025; contract research organizations are projected to grow the fastest at 8.50% CAGR to 2031.
- Geographically, North America maintained 42.20% share of the life science and chemical instrumentation market in 2025; Asia-Pacific is positioned to expand at an 8.45% CAGR through 2031.
Note: Market size and forecast figures in this report are generated using Mordor Intelligence’s proprietary estimation framework, updated with the latest available data and insights as of January 2026.
Global Life Science And Chemical Instrumentation Market Trends and Insights
Drivers Impact Analysis*
| Driver | (~) % Impact on CAGR Forecast | Geographic Relevance | Impact Timeline |
|---|---|---|---|
| Surging pharmaceutical & biotech R&D budgets | +1.2% | Global, concentrated in North America, Europe, China | Medium term (2-4 years) |
| Stringent global regulatory & quality-control requirements | +1.5% | Global, early adoption in North America & EU | Short term (≤2 years) |
| Rapid adoption of automation & miniaturization in laboratories | +1.3% | Global, spill-over from North America & APAC | Medium term (2-4 years) |
| Expansion of precision-medicine & multi-omics workflows | +1.4% | North America, Europe, APAC | Long term (≥4 years) |
| Government incentives for domestic instrument manufacturing | +0.9% | APAC—China & India | Medium term (2-4 years) |
| Subscription-based instrument-as-a-service models | +0.8% | North America & Europe, emerging in APAC | Short term (≤2 years) |
| Source: Mordor Intelligence | |||
Surging Pharmaceutical & Biotech R&D Budgets
Global R&D spending rebounded unevenly in 2025; companies with obesity and GLP-1 franchises raised budgets by double digits, channeling extra capital toward ultra-high-performance liquid chromatography and high-parameter flow cytometry that characterize antibody-drug conjugates and CAR-T products. Oncology now captures 31.5% of outsourced discovery, compelling CROs to expand digital PCR and next-generation sequencing capacity that quantifies low-frequency tumor mutations in plasma.[1]Bio-Rad Laboratories, “QX600 Droplet Digital PCR,” bio-rad.com Nine of the top 10 biopharma deals in 2023 included precision-medicine assets, signaling a durable preference for analytical platforms that resolve single-cell heterogeneity and multi-omic signatures. These dynamics ensure sustained purchase cycles for chromatography, mass spectrometry, and sequencing systems across both sponsor and service-provider ecosystems. Vendors that embed Bayesian algorithms to automate method development further improve utilization, making them preferred choices for labs battling labor shortages.
Stringent Global Regulatory & Quality-Control Requirements
The FDA’s 2024 New Approach Methodologies guidance explicitly endorses organ-on-chip and high-content imaging, driving immediate procurement of microfluidic and automated microscopy instruments and rendering many legacy bench spectrometers obsolete. Europe’s Adverse Event Management System mandates real-time data uploads, compelling CROs to retrofit chromatography and mass spectrometry units with cloud connectors that add electronic signatures and audit trails. Compliance retrofits cost USD 50,000-150,000 per unit, a burden smaller labs struggle to shoulder, which steers demand toward integrated platforms that ship with 21 CFR Part 11 and GDPR modules out-of-the-box. ISO 17025 accreditation timelines have doubled to one year as auditors scrutinize cybersecurity, intensifying upgrade cycles that favor vendors with secure firmware and remote-monitoring capabilities. Collectively, these rules move purchasing criteria beyond analytical performance toward traceability, data integrity, and cybersecurity maturity.
Rapid Adoption of Automation & Miniaturization in Laboratory Analytical Instruments
Shimadzu’s Nexera FV UHPLC, launched in 2024, integrates analytical and preparative flows within one chassis, cutting lab footprint by 40% and saving CROs urban rental expense.[2]Shimadzu Corp., “Nexera FV UHPLC,” shimadzu.com CDS Analytical’s EmporeOmics 1000 unites sample prep, chromatography, and MS into a 60 cm square unit, reducing cross-contamination risk and boosting throughput for metabolomics studies. University College London validated an autonomous HPLC robot that refines gradients in real time using Bayesian learning, shrinking method-development timelines from weeks to hours.[3]University College London, “Autonomous HPLC Robot,” ucl.ac.uk Vendors now embed self-diagnostics and consumable tracking, which mitigates the shortage of service engineers and elevates uptime to contractually guaranteed levels exceeding 95%. These innovations make premium instrumentation accessible under subscription bundles that spread costs over operating budgets rather than capital appropriations.
Expansion of Precision-Medicine & Multi-Omics Workflows
Illumina’s Connected Multiomics links genomic, transcriptomic, and epigenomic pipelines into one bioinformatics hub, allowing sponsors to correlate drug response with methylation and spatial RNA patterns that lower clinical-trial attrition. With 2,200 sequencers shipped in Q4 2024 and USD 3.48 billion consumables revenue, the company demonstrates how hardware acts as a lock-in gateway to high-margin reagent streams. Oxford Nanopore’s handheld PromethION 2 delivers 14.5 terabases per run, enabling onsite pathogen surveillance that reallocates sequencing budgets from centralized reference labs to point-of-care settings. Proteomics follows suit as mass-spec vendors package protein-quantification platforms alongside genomics workflows, standardizing multi-omic requirements across academic consortia such as the Billion Cell Atlas. These projects cement long-term demand for high-throughput sequencing, spectral flow cytometry, and advanced mass spectrometry within the life science and chemical instrumentation market.
Restraints Impact Analysis*
| Restraint | (~) % Impact on CAGR Forecast | Geographic Relevance | Impact Timeline |
|---|---|---|---|
| High capital & operating costs of advanced instruments | -0.8% | Global, more acute in emerging markets | Short term (≤2 years) |
| Shortage of skilled analytical scientists & service engineers | -0.6% | Global, severe in North America & Europe | Medium term (2-4 years) |
| Supply-chain vulnerability for semiconductor/rare-earth components | -0.5% | Global, acute in APAC & Europe | Short term (≤2 years) |
| Cyber-security & data-integrity compliance burden | -0.3% | North America & Europe, emerging in APAC | Medium term (2-4 years) |
| Source: Mordor Intelligence | |||
High Capital & Operating Costs of Advanced Laboratory Analytical Instruments
Illumina’s NovaSeq X Plus lists above USD 1 million with annual consumable obligations of USD 200,000-300,000, exceeding entire instrumentation budgets for many academic cores. Digital PCR cartridges cost USD 8-12 per sample, about triple the real-time PCR costs, limiting uptake to reimbursable oncology diagnostics. Spectroscopy leases run 1.8-3.3% of list price monthly; a USD 200,000 FTIR, therefore, costs USD 3,600-6,600 per month, a strain when utilization dips under 60%. Mass-spec service contracts average 12-15% of purchase price per year, and vendors increasingly require bundled software subscriptions that push total annual spend above USD 50,000 per LC-MS unit. These economic slow refresh cycles are especially prevalent in emerging markets that lack grant or venture funding.
Shortage of Skilled Analytical Scientists & Service Engineers
U.K. job posts for analytical chemists grew 6.5% annually, outpacing graduate supply by 30%. The United States projects a 5% rise in chemical-technician roles from 2023 to 2033 but already faces a cumulative shortfall of 30,000 positions, with attrition near 15%. Median salaries reach USD 131,000 for PhD chemists, rates impossible for many academic and small CRO budgets. Vendors respond by embedding automation, remote diagnostics, and AI-driven troubleshooting, yet implementation requires additional IT talent that remains scarce, perpetuating the constraint.
*Our forecasts treat driver/restraint impacts as directional, not additive. The impact forecasts reflect baseline growth, mix effects, and variable interactions.
Segment Analysis
By Product: Consumables Outpace Instruments as Razor-Blade Models Dominate
Instruments still generated 63.66% of 2025 revenue, but consumables posted the highest trajectory at a 7.23% CAGR, reflecting the razor-blade economics underpinning modern vendor strategies. Chromatography columns require replacement every 500-2,000 injections, while Bio-Rad’s droplet-generation cartridges secure an annuity stream priced three to five times conventional PCR reagents.
Software, the smallest category by dollars, is expected to rise fastest in percentage terms as vendors charge USD 5,000-15,000 annually per instrument for cloud data storage, predictive maintenance, and compliance reporting. Gross margins surpass 80%, encouraging firms to bundle software into instrument subscription contracts that promise 99% uptime, creating sticky, high-margin relationships.


By Technology: Digital PCR Gains as Liquid Biopsy Matures
Chromatography accounted for 32.50% of the life science and chemical instrumentation market share in 2025, buttressed by strict pharmacopeial methods that still mandate HPLC for assay and impurity testing. The life science and chemical instrumentation market size for polymerase chain reaction platforms is set to grow fastest at a 7.01% CAGR, propelled by digital PCR’s ability to quantify circulating tumor DNA below 1% variant allele frequency. Bio-Rad’s FDA-cleared QX600 partitions samples into 20,000 droplets per well, enabling six-color multiplex oncology panels, while QIAGEN’s QIAcuity offers 26,000 partitions in a nanoplate format that balances precision with throughput.
Illumina’s NovaSeq X Plus achieved USD 200 per genome at 20,000 genomes annually, reducing the cost barrier for national sequencing programs, whereas Oxford Nanopore’s PromethION 2 pushes into rapid, in-field pathogen surveillance. Spectral flow cytometry advances with BD’s 40-parameter FACSDiscover S8 and Cytek’s 64-parameter Aurora, each essential for dissecting immunotherapy response. Spectroscopy, microscopy, electrophoresis, and centrifuges fill niche but indispensable roles, ranging from Raman polymorph screening to cryo-EM of viral capsids, keeping the technology mix diversified.
By End User: CROs Absorb Capital Expenditure as Pharma Outsources
Pharmaceutical and biotechnology sponsors represented 35.50% of total spend in 2025, yet their share is sliding as they delegate early discovery and bioanalytical tasks to contract research organizations. CROs’ life science and chemical instrumentation market size is projected to expand at an 8.50% CAGR to 2031. Thermo Fisher’s USD 1 billion acquisition of Clario exemplifies a vendor push into service domains to secure captive demand for their platform ecosystems.
Hospitals and diagnostics labs sustain modest growth via point-of-care molecular testing, while universities rely on shared core facilities with utilization above 80%, increasingly financed through subscription bundles that guarantee mid-contract upgrades without renewed capital approvals. This realignment reinforces CROs as the fastest-growing buyer cohort, influencing vendors to prioritize service models that dovetail with outsourced workflows.
Geography Analysis
North America retained 42.20% share in 2025, driven by tightly regulated pharmaceutical manufacturing, NIH-funded research infrastructure, and a concentrated vendor base that supports rapid service response. Although the region’s growth decelerates relative to emerging markets, a vast installed base ensures steady replacement as FDA guidance pushes labs toward organ-on-chip and high-content imaging solutions. Canada’s biomanufacturing incentives and Mexico’s nearshoring gains add incremental demand for chromatography and spectroscopy platforms.
Asia-Pacific is projected to record an 8.45% CAGR through 2031. India’s Production Linked Incentive scheme unlocked USD 26 billion in investment across 191 bulk-drug intermediates, each requiring chromatography and mass spectrometry for quality control. Karnataka’s Industrial Policy offers 25% capital subsidies, slicing the life science and chemical instrumentation market's total cost of ownership by up to 20% and enticing Agilent, Waters, and Thermo Fisher to open application labs in Bengaluru and Hyderabad. China’s subsidies for domestic instrument builders spur double-digit local growth despite geopolitical risks tied to rare-earth export controls. Japan, South Korea, and Australia contribute stable but smaller volumes linked to pharmaceutical production and academic research.
Europe sits third by value. Germany’s process-analytical-technology requirements, the UK’s shared core-facility model, and France’s oncology research underpin demand. EMA data-integrity mandates push adoption of cloud-connected chromatography and mass spectrometry with embedded audit trails. South America and Middle East & Africa remain nascent, yet GCC hospital expansions and Brazil’s biotech clusters lift regional orders, especially where leasing and instrument-as-a-service models bridge capital constraints.

Competitive Landscape
Five leaders, Thermo Fisher Scientific, Danaher, Agilent Technologies, Waters Corporation, and Illumina, controlled a significant market share of the life science and chemical instrumentation market in 2025, while no single firm exceeded 15%, leaving space for specialists in digital PCR, spatial transcriptomics, and cryo-electron microscopy. Thermo Fisher’s integration of clinical-trial services via Clario, Danaher’s broad portfolio spanning chromatography and flow cytometry, and Agilent’s AI-enabled chromatography differentiate offerings on workflow depth rather than hardware alone.
Emerging disruptors include Oxford Nanopore, whose portable sequencers facilitate near-real-time pathogen surveillance, and Element Biosciences, which markets an open-chemistry benchtop sequencer with lower consumable costs, appealing to budget-constrained labs. Vendors weaponize regulatory compliance; Bio-Rad’s FDA-cleared QX600 commands premium pricing in oncology diagnostics, while Illumina’s MiSeqDx enjoys entrenched clinical adoption. ISO 17025 and ISO 27001 certifications now act as de facto entry tickets for suppliers addressing pharmaceutical and CRO markets, raising barriers for start-ups.
M&A momentum remains strong as CRO consolidation (Worldwide Clinical Trials purchasing Catalyst for USD 500 million) pulls instrumentation vendors into bundled service plays. Meanwhile, AI-driven maintenance forecasting by Waters and Bayesian optimization from Agilent enhance customer stickiness and shield recurring revenue.
Life Science And Chemical Instrumentation Industry Leaders
Agilent Technologies Inc.
Bio-Rad Laboratories Inc.
Illumina Inc.
Thermo Fisher Scientific Inc.
QIAGEN N.V.
- *Disclaimer: Major Players sorted in no particular order

Recent Industry Developments
- April 2026: Bruker Corporation has expanded its business operations through a majority investment in RECIPE Chemicals + Instruments GmbH, based in Munich, Germany. RECIPE is a leading European provider of vendor-agnostic therapeutic drug monitoring (TDM) and other clinical in vitro diagnostic kits for LC-MS/MS, HPLC, and ICP-MS assays.
- July 2025: Bio-Rad Laboratories announced a significant development with the launch of four new platforms for its Droplet Digital PCR (ddPCR) technology. This development includes the introduction of Bio-Rad’s QX Continuum ddPCR system and the QX700 series of ddPCR platforms, which were integrated into the company’s portfolio following its recent acquisition of digital PCR innovator, Stilla Technologies.
- November 2025: Integrated DNA Technologies and Beckman Coulter Life Sciences expand capabilities to enhance cancer research with automated NGS workflows.


Global Life Science And Chemical Instrumentation Market Report Scope
The life science and chemical instrumentation market consists of the sales of specialized laboratory tools, devices, and associated software/services used to analyze, measure, and monitor the chemical, biological, and physical properties of substances. It encompasses technologies crucial for research and development (R&D), diagnostic testing, and quality control across pharmaceutical, biotechnology, academic, and environmental sectors.
The life science and chemical instrumentation market report is segmented by product, technology, and end user. By product, the market is segmented into instruments, consumables, and software. By technology, the market is segmented into spectroscopy, chromatography, PCR, NGS, flow cytometry, microscopy, electrophoresis, and centrifuges. By end-user, the market is segmented into pharmaceutical & biotechnology companies, hospitals & diagnostic centers, CROs, academia & research institutes. By geography, the market is segmented into North America, Europe, Asia-Pacific, Middle East & Africa, and South America. The market forecasts are provided in terms of value (USD).
| Instruments |
| Consumables |
| Software |
| Spectroscopy |
| Chromatography |
| Polymerase Chain Reaction (PCR) |
| Next-Generation Sequencing (NGS) |
| Flow Cytometry |
| Microscopy |
| Electrophoresis |
| Centrifuges |
| Pharmaceutical & Biotechnology Companies |
| Hospitals & Diagnostic Centers |
| Contract Research Organizations (CROs) |
| Academia & Research Institutes |
| North America | United States |
| Canada | |
| Mexico | |
| Europe | Germany |
| United Kingdom | |
| France | |
| Italy | |
| Spain | |
| Rest of Europe | |
| Asia-Pacific | China |
| Japan | |
| India | |
| Australia | |
| South Korea | |
| Rest of Asia-Pacific | |
| Middle East & Africa | GCC |
| South Africa | |
| Rest of Middle East & Africa | |
| South America | Brazil |
| Argentina | |
| Rest of South America |
| By Product | Instruments | |
| Consumables | ||
| Software | ||
| By Technology | Spectroscopy | |
| Chromatography | ||
| Polymerase Chain Reaction (PCR) | ||
| Next-Generation Sequencing (NGS) | ||
| Flow Cytometry | ||
| Microscopy | ||
| Electrophoresis | ||
| Centrifuges | ||
| By End-User | Pharmaceutical & Biotechnology Companies | |
| Hospitals & Diagnostic Centers | ||
| Contract Research Organizations (CROs) | ||
| Academia & Research Institutes | ||
| By Geography | North America | United States |
| Canada | ||
| Mexico | ||
| Europe | Germany | |
| United Kingdom | ||
| France | ||
| Italy | ||
| Spain | ||
| Rest of Europe | ||
| Asia-Pacific | China | |
| Japan | ||
| India | ||
| Australia | ||
| South Korea | ||
| Rest of Asia-Pacific | ||
| Middle East & Africa | GCC | |
| South Africa | ||
| Rest of Middle East & Africa | ||
| South America | Brazil | |
| Argentina | ||
| Rest of South America | ||


Key Questions Answered in the Report
How large will the life science and chemical instrumentation market be by 2031?
The market is projected to reach USD 97.05 billion by 2031, expanding at a 6.75% CAGR over 2026-2031.
Which geographic region is expected to post the fastest growth through 2031?
Asia-Pacific is forecast to advance at an 8.45% CAGR, buoyed by India’s Production Linked Incentive scheme and China’s domestic-instrument subsidies.
What is driving laboratories toward instrument-as-a-service contracts?
Subscription bundles spread costs over operating budgets, guarantee uptime above 95%, and include consumables, making them attractive amid tight capital budgets and rapid tech cycles.
Why are contract research organizations increasing their instrument purchases?
Drug sponsors outsource early discovery and biomarker work, pushing CRO instrumentation spend to an 8.5% CAGR as they absorb capital expenditure once borne by pharmaceutical firms.
Which technology category is forecast to grow the fastest through 2031?
Polymerase chain reaction platforms, especially digital PCR, are set to grow at a 7.01% CAGR as liquid-biopsy testing demands sub-1% variant detection accuracy.
Page last updated on:


