Kenya Data Center Market Size and Share
Market Overview
| Study Period | 2019 - 2030 |
|---|---|
| Forecast Data Period | 2025 - 2030 |
| Historical Data Period | 2019 - 2023 |
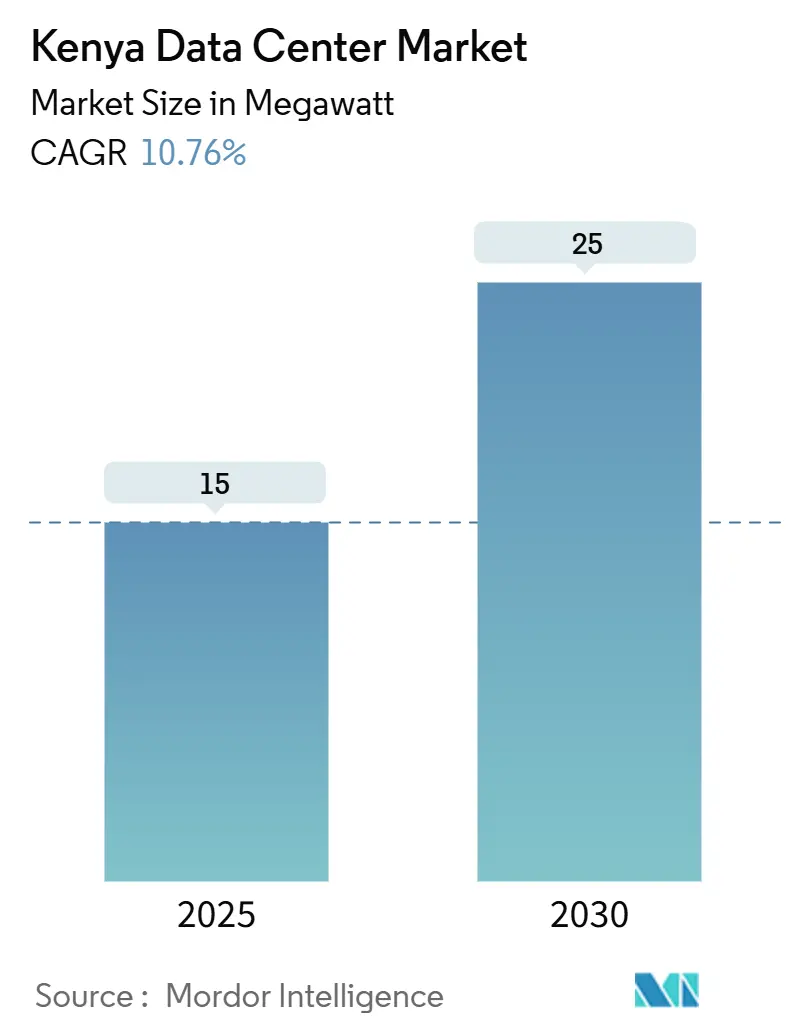
| Market Volume (2025) | 15 megawatt |
| Market Volume (2030) | 25 megawatt |
| Growth Rate (2025 - 2030) | 10.76% CAGR |
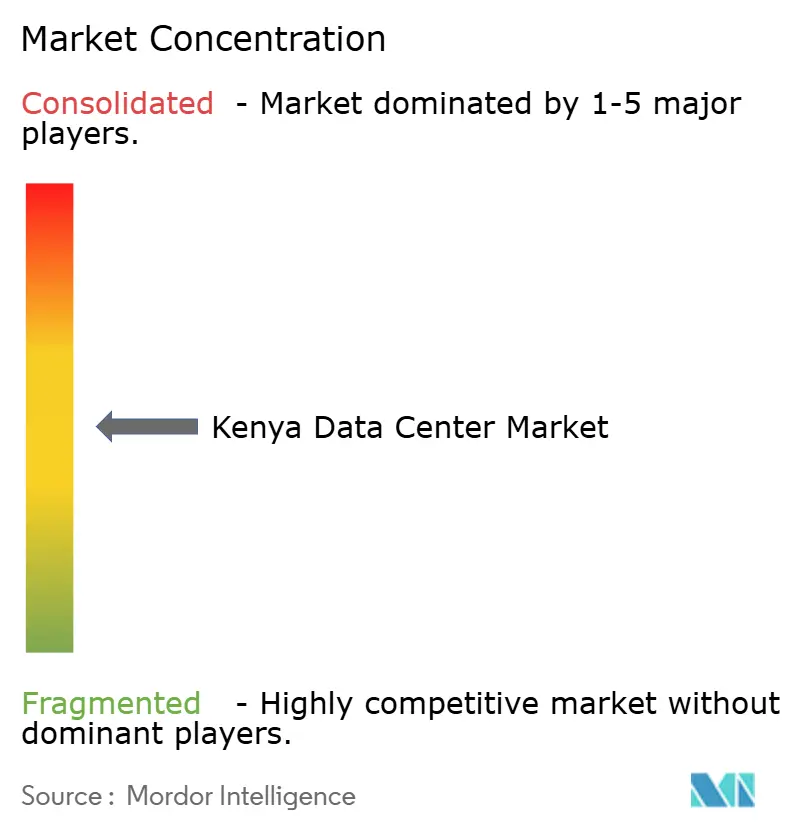
| Market Concentration | Medium |
Major Players *Disclaimer: Major Players sorted in no particular order Image © Mordor Intelligence. Reuse requires attribution under CC BY 4.0. | |
Kenya Data Center Market Analysis by Mordor Intelligence
The Kenya data center market size stands at 15 MW in 2025 and is forecast to reach 25 MW by 2030, reflecting a 10.76% CAGR that outpaces most peer economies in East Africa. Rising enterprise cloud adoption, ambitious public-sector digitalization programs, and hyperscaler commitments to geothermal-powered capacity anchor this growth trajectory. National fiber expansion, the landing of new submarine cables, and direct renewable-energy sourcing lower latency while containing carbon footprints, strengthening Kenya’s appeal as the region’s digital gateway. Sustained fintech activity generating USD 314 billion in annual mobile-money volume, together with e-commerce revenues approaching USD 900 million, inject continual workloads into colocation racks. Meanwhile, policy tools within the Digital Economy Blueprint and Konza Technopolis SEZ provide fiscal incentives that attract foreign direct investment into the Kenya data center market.
Key Report Takeaways
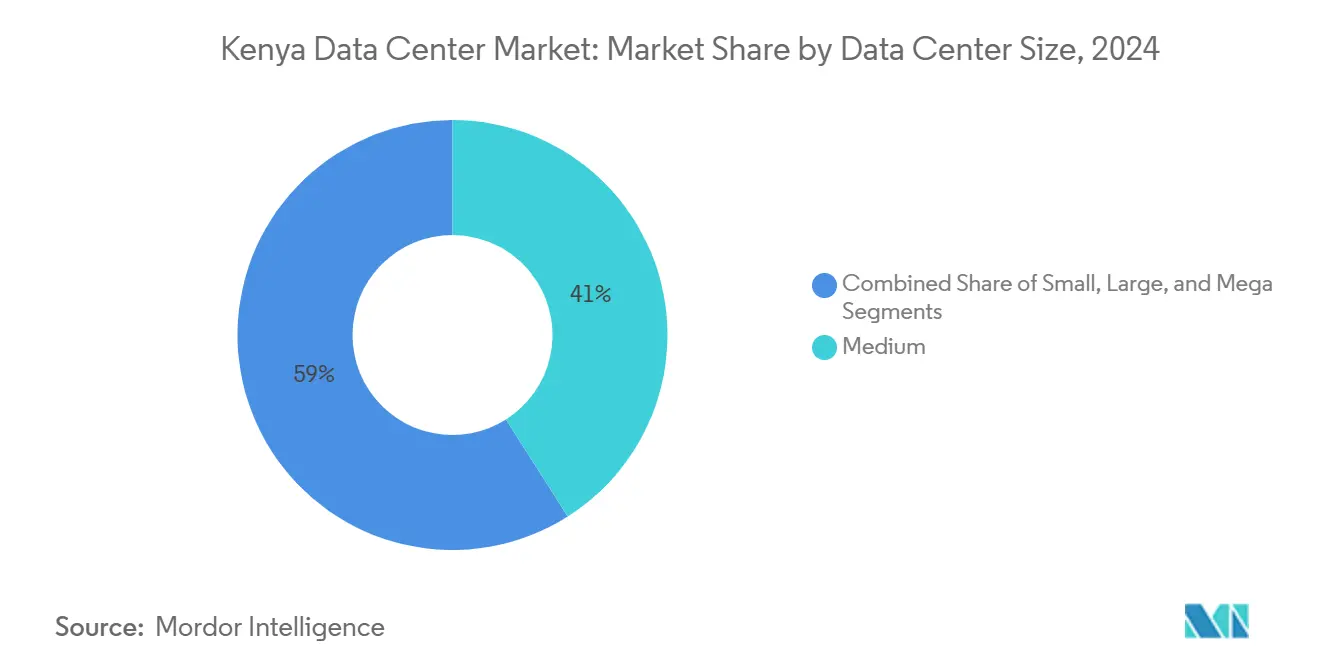
- By data-center size, the medium segment led with 41% share of the Kenya data center market size in 2024, whereas the mega-scale category is projected to expand at 11.5% CAGR during 2025-2030.
- By tier type, Tier III facilities accounted for 59% of the Kenya data center market size in 2024; Tier IV deployments are forecast to rise at a 12.2% CAGR through 2030.
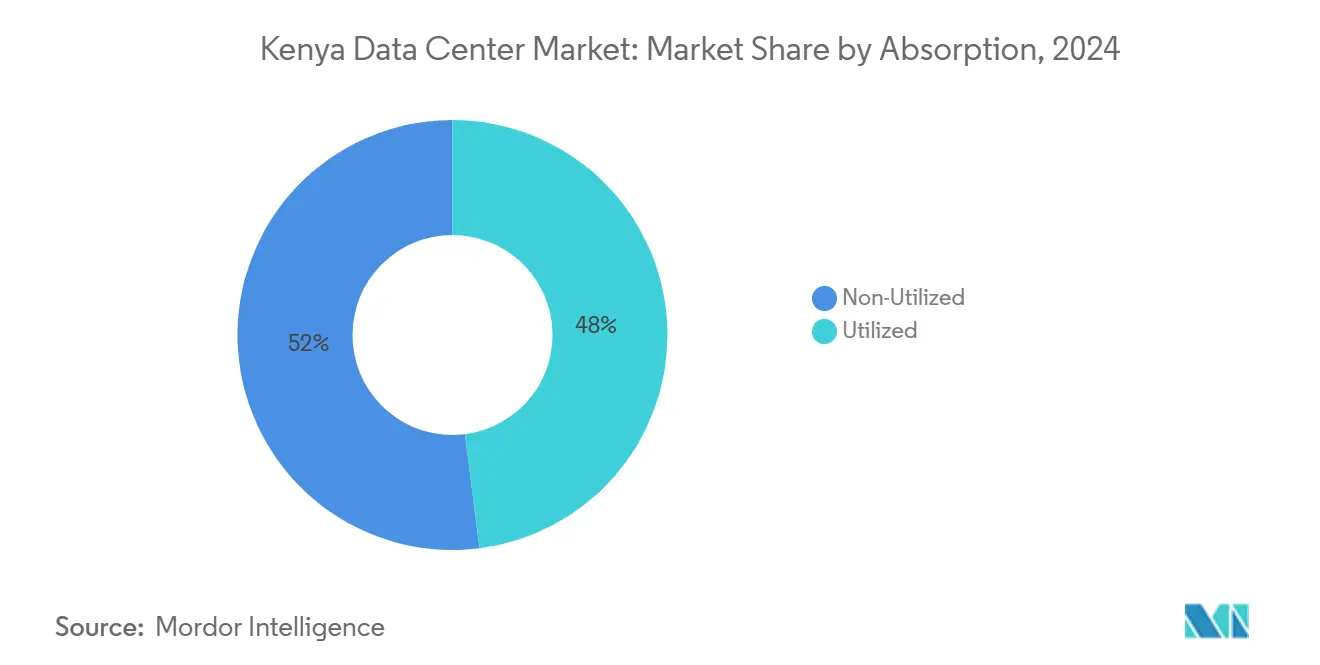
- By absorption, utilized-hyperscale colocation represented the fastest-growing slice, advancing at a 13.1% CAGR to 2030, and already held 48% share of active capacity in 2024.
- By hotspot, Nairobi commanded 65% of Kenya data center market share in 2024, while Mombasa posted the fastest regional growth at an 11.8% CAGR through 2030.
- Microsoft and G42’s USD 1 billion geothermal campus marks the single largest capital outlay in the Kenya data center market and crystallizes the entry of global cloud regions.
Kenya Data Center Market Trends and Insights
Drivers Impact Analysis*
| Driver | (~) % Impact on CAGR Forecast | Geographic Relevance | Impact Timeline |
|---|---|---|---|
| National fiber backbone expansion | +2.1% | Nairobi and Mombasa corridors | Medium term (2-4 years) |
| Surge in fintech and mobile-money use | +1.8% | National, urban centers | Short term (≤ 2 years) |
| Global cloud and content provider entry | +2.3% | Nairobi primary, Mombasa secondary | Medium term (2-4 years) |
| Abundant geothermal power | +1.4% | Nairobi-Nakuru, Menengai | Long term (≥ 4 years) |
| Kenya–Ethiopia–South Sudan corridor | +0.9% | Northern cross-border areas | Long term (≥ 4 years) |
| Tax holidays in Konza Technopolis SEZ | +0.7% | Konza SEZ | Medium term (2-4 years) |
| Source: Mordor Intelligence | |||
National Fiber Backbone Expansion Under the Digital Economy Blueprint
Kenya’s Digital Superhighway program targets 100,000 km of new fiber and 25,000 public Wi-Fi hotspots by 2027, embedding high-capacity backhaul into virtually every county and magnifying edge-data-center demand as last-mile latency thresholds tighten. More than 9,000 km of fiber was already delivered by 2024, and ministries deployed 1 million learner devices that rely on low-latency cloud access.[1]ICT Authority, “Fiber Optics Roll-Out,” icta.go.ke Private carriers are layering dark-fiber rings onto this backbone, giving hyperscalers path diversity for inter-availability-zone replication inside the Kenya data center market. As local governments onboard e-procurement and e-health platforms, revenue visibility for wholesale colocation leases improves, shortening payback periods for new builds.
Surge in Fintech and Mobile-Money Transactions Raising Low-Latency Compute Demand
M-Pesa’s 51 million customers generated USD 314 billion in annual value, and the Central Bank’s National Payments Vision 2025 requires sub-second fraud detection built on AI-centric workloads.[2]National Payments System Vision and Strategy 2021-2025,” centralbank.go.ke That traffic overwhelms legacy on-premises rooms and funnels transactions into cloud nodes inside the Kenya data center market for rapid scaling. Telcos report 53.7 million mobile-data subscriptions, a base that fuels real-time credit scoring, insurtech offerings, and loyalty platforms requiring edge caching. As e-commerce revenue approaches USD 900 million, online retailers demand consistent <100 ms round-trip times to close shopping-cart conversions, further anchoring capacity absorption.
Entry of Global Cloud and Content Providers Establishing Nairobi Edge Zones
Google’s first Africa cloud region went live in early 2024, Microsoft is building a geothermal-powered Azure region in Naivasha, and Oracle has earmarked Nairobi for its next cloud site. Each deployment obliges mirror sites, cold-storage arrays, and multi-tenant interconnection fabrics, enlarging the Kenya data center market beyond traditional enterprise caging. Combined with Google’s Umoja cable linking Kenya to Australia, the hyperscaler wave resets latency expectations for SaaS and content-delivery firms across eight eastern African nations.
Abundant Geothermal Power Enabling Low-Carbon Operations
Geothermal already supplies 42% of Kenya’s grid and offers predictable pricing at roughly KES 7/kWh, undercutting thermal peers by more than 60%. With 799 MW commissioned and 5,000 MW targeted by 2030, data-center operators secure direct-use power purchase agreements that bypass retail tariffs. Microsoft’s USD 1 billion build confirmed geothermal’s viability for Tier IV uptime, and smaller colocation firms leverage Naivasha steam fields for carbon-neutral marketing, differentiating offerings across the Kenya data center market.
Restraints Impact Analysis*
| Restraint | (~) % Impact on CAGR Forecast | Geographic Relevance | Impact Timeline |
|---|---|---|---|
| High electricity tariffs vs. regional peers | -1.9% | National | Short term (≤ 2 years) |
| Grid instability driving diesel redundancy | -1.2% | National, Tier IV sites | Medium term (2-4 years) |
| Limited local project-finance depth | -0.8% | National | Long term (≥ 4 years) |
| Scarcity of Uptime-certified staff | -0.6% | Nairobi-centric | Medium term (2-4 years) |
| Source: Mordor Intelligence | |||
High Electricity Tariffs Versus Regional Peers
Operators pay an average retail rate of USD 0.26/kWh, higher than Uganda, Tanzania, and Ethiopia, squeezing EBITDA margins during initial ramp-up phases.[3]Business Daily Africa, “Kenyan homes pay highest electricity bills,” businessdailyafrica.com Tariffs include volatile fuel-cost and forex adjustments, complicating financial modeling for 10-year colocation contracts. While direct geothermal PPAs offer relief, only hyperscalers with balance-sheet strength can negotiate them, leaving mid-sized firms exposed to price shocks that dampen Kenya data center market expansion in the near term.
Grid Instability Driving Costly Diesel Redundancy
Voltage sags and nationwide blackouts force operators to maintain N+1 or N+2 diesel sets, inflating both capex and Scope 1 emissions footprints. Tier IV builds demand 99.995% uptime, making fuel contracts and on-site storage obligatory. These redundancies erode the cost advantage that geothermal promised, and until grid-modernization projects under MTP-IV finalize, risk premiums will linger.
*Our forecasts treat driver/restraint impacts as directional, not additive. The impact forecasts reflect baseline growth, mix effects, and variable interactions.
Segment Analysis
By Data Center Size: Medium Leads as Mega Scales Rise
Medium-sized buildings (1-10 MW) account for 41% of Kenya data center market size, housing regulated workloads from banks and ministries that require dedicated cages but not hyperscale economics. These facilities typically offer 1.5 PUE and deploy modular pods for rapid capacity step-ups, aligning with Kenya’s hybrid-cloud adoption curve.
Mega-scale campuses (greater than 30 MW) are registering the fastest expansion at an 11.5% CAGR to 2030, as Microsoft, Oracle, and potentially AWS reserve pre-leased blocks that lock in future demand. Africa Data Centres and Teraco source syndicated debt to erect multi-hall complexes, positioning the Kenya data center market as a regional export platform for SaaS into Uganda, Rwanda, and Ethiopia.


By Tier Type: Tier III Prevails While Tier IV Gains Traction
Tier III sites held 59% of 2024 capacity because their 99.982% availability meets legislative and audit norms for most industries while keeping opex manageable. Konza Technopolis’s National Data Centre exemplifies this sweet spot, supporting SME tenants and e-government portals within sovereign borders.
Tier IV footprints, although smaller today, rise at 12.2% CAGR as cross-listed banks, telcos, and hyperscalers demand fault-tolerant redundancy. Microsoft’s geothermal campus signals Tier IV architecture migration, embedding 2N+1 electrical designs and advanced aqueous-cooling loops. This shift anchors premium pricing inside the Kenya data center market but aligns with global SLA benchmarks.
By Absorption: Utilized Capacity Drives Hyperscale Uptake
Utilized racks represented 48% of installed power in 2024, reflecting a tight supply-demand balance and disciplined speculative builds by local operators. Safaricom’s OpenShift private-cloud fit-out pushed utilization rates upward, while G42’s initial 100 MW tranche will immediately enter the utilised column once Azure workloads migrate.
Within that utilized bucket, hyperscale colocation grows fastest, clocking 13.1% CAGR to 2030, as cloud giants prefer build-to-suit shells over retail leases to control network fabrics and security postures. Non-utilized inventory remains healthy but moderate, ensuring the Kenya data center market avoids price-war dynamics while retaining surge capacity for green-field workloads.
By Hotspot: Nairobi Dominates While Mombasa Accelerates
Nairobi contributed 65% of Kenya data center market share in 2024, underpinned by its concentration of financial institutions, government agencies, and multinational headquarters that require low-latency links to cloud regions. Hyperscalers favor the capital for initial availability zones because it hosts carrier-neutral interconnection exchanges, subsea backhaul POPs, and a depth of certified engineers. Growth continues as the e-Citizen platform processes KES 350 million daily and banks deploy AI-based credit engines, locking future workloads into Nairobi racks.
Mombasa, despite having a smaller base, is on an 11.8% CAGR trajectory through 2030, driven by six submarine cables that land within 10 km of its data center cluster. Content networks position cache nodes at iColo MBA2 to serve streaming traffic into Eastern and Central Africa, shortening round-trip times by up to 40%. A new LINX internet exchange reduces cross-border transit fees, while tax concessions on imported HVAC equipment further augment the size of the Kenya data center market in the coastal city.
Geography Analysis
Nairobi’s primacy is unlikely to wane in the forecast period because it benefits from dense metro-fiber rings, dual power feeds, and proximity to decision-makers who steward digital-transformation budgets. The city will also host redundancies for Azure, Google Cloud, and Oracle regions, solidifying its role as the gravitational center of the Kenya data center market. Upcoming municipal 5G rollouts guarantee a continuous stream of latency-sensitive applications, such as telemedicine and autonomous mobility pilots.
Mombasa leverages the diversity of cable networks, including SEACOM, TEAMS, EASSy, LION2, DARE1, and PEACE, to position itself as the hand-off point for international traffic. Content delivery networks replicate libraries at the coast to sidestep congested Nairobi backhauls, which trims buffer times for high-definition video into landlocked neighbors. As more eyeballs shift to streaming, the Kenya data center market size on the coast is projected to double its rack count by 2030.
Rest-of-Kenya provinces emerge as edge clusters tethered to the Digital Superhighway. Konza Technopolis pairs STEM universities with incubator labs, yielding organic compute demand from AI startups, while Naivasha maximizes geothermal adjacency to attract low-carbon colocation. Northern corridor projects that interlink with Ethiopia and South Sudan unleash cross-border e-commerce flows, creating incremental capacity requirements in Isiolo and Moyale. Collectively, secondary cities lift national redundancy and distribute workloads, ensuring that the Kenya data center market develops resilience against single-zone outages.
Competitive Landscape
Competition remains moderately fragmented: no single provider controls more than 20% of installed power, but first movers differentiate on connectivity ecosystems rather than brute capacity. IXAfrica brands itself as East Africa’s most technologically advanced site with carrier-dense meet-me rooms, whereas Africa Data Centres courts global tenants through peering fabrics that include Asteroid IXP. Digital Realty’s iColo subsidiary bank-rolls coastal builds, betting on cable-linked latency advantages.
Strategic partnerships shape rivalry more than pure head-to-head leasing. Microsoft aligns with G42 for renewable power procurement, Google funds Umoja for trans-oceanic capacity, and AWS invests in talent pipelines. Local challenger Siscom deploys a crowd-investment model that enables citizens to co-own servers, addressing capital constraints while fostering brand advocacy. This mosaic keeps pricing rational yet stimulates service innovation across the Kenya data center market.
Entry barriers revolve around licensed spectrum for carrier-grade links, Uptime certification expertise, and renewable-energy offtake deals. The government's designation of data centers as “critical infrastructure” raises compliance thresholds, favoring incumbents with ISO 27001 and PCI-DSS certifications. Over the forecast horizon, consolidation is plausible as private-equity vehicles aggregate mid-sized assets to gain bargaining power with hyperscalers, but abundant green-field land and tax relief in SEZs temper buy-out urgency.
Kenya Data Center Industry Leaders
Africa Data Centres
Safaricom PLC
iColo Ltd (Digital Realty)
IXAfrica Data Centre
Telkom Kenya Ltd
- *Disclaimer: Major Players sorted in no particular order

Recent Industry Developments
- July 2025: Siscom launched Siscom Nodes enabling citizens to invest KES 20,000–2,000,000 in co-owned high-performance servers, potentially creating 10,000 direct jobs.
- May 2025: Airtel and Starlink partnered to extend satellite internet coverage, offering redundancy pathways for data-center clients.
- April 2025: AWS opened a cloud-skills center at the University of Nairobi to deepen the talent pool.
- March 2025: EcoCloud and G42 signed an MoU with Kenya’s presidency to construct a 1 GW geothermal campus in Naivasha.


Kenya Data Center Market Report Scope
The Kenya Data Center Market Report is Segmented by Data Center Size (Small, Medium, Large, Mega, Massive), Tier Standard (Tier I and II, Tier III, and Tier IV), Absorption (Non-Utilized, Utilized (Colocation Type (Hyperscale, Retail, Wholesale), End-User (BFSI, Cloud Service Providers, E-Commerce, Government, Manufacturing, Media and Entertainment, Telecom, and Other End-Users)), and Hotspot (Nairobi, Mombasa, Rest of Kenya). The Market Forecasts are Provided in Terms of Volume (MW Capacity).
| Small |
| Medium |
| Large |
| Mega |
| Tier I and II |
| Tier III |
| Tier IV |
| Non-Utilized | ||
| Utilized | By Colocation Type | Hyperscale |
| Retail | ||
| Wholesale | ||
| By End-User | BFSI | |
| Cloud Service Providers | ||
| E-Commerce | ||
| Government | ||
| Manufacturing | ||
| Media and Entertainment | ||
| Telecom | ||
| Other End-Users | ||
| Nairobi |
| Mombasa |
| Rest of Kenya |
| By Data-Center Size | Small | ||
| Medium | |||
| Large | |||
| Mega | |||
| By Tier Type | Tier I and II | ||
| Tier III | |||
| Tier IV | |||
| By Absorption | Non-Utilized | ||
| Utilized | By Colocation Type | Hyperscale | |
| Retail | |||
| Wholesale | |||
| By End-User | BFSI | ||
| Cloud Service Providers | |||
| E-Commerce | |||
| Government | |||
| Manufacturing | |||
| Media and Entertainment | |||
| Telecom | |||
| Other End-Users | |||
| By Hotspot | Nairobi | ||
| Mombasa | |||
| Rest of Kenya | |||


Key Questions Answered in the Report
What is the 2025 capacity of Kenya’s data-center sector?
The Kenya data center market size stands at 15 MW of installed power in 2025.
How fast will capacity grow through 2030?
Capacity is projected to reach 25 MW by 2030, implying a 10.76% CAGR.
Which city holds the largest concentration of facilities?
Nairobi controls 65% of active power thanks to dense fiber, skilled labor, and enterprise demand.
Why are hyperscalers investing in Kenya instead of neighboring countries?
Kenya offers 799 MW of geothermal generation, robust legal data-protection frameworks, and multiple subsea-cable landings that provide latency and sustainability advantages.
What obstacle most constrains new entrants?
High retail electricity tariffs averaging USD 0.26/kWh raise operating costs until developers secure direct geothermal PPAs.
How important is Mombasa in international connectivity?
Six submarine cables terminate in Mombasa, making it East Africa’s principal gateway for trans-oceanic traffic and a rising hub for edge caches.
Page last updated on:


