IT Observability Platforms Market Size and Share
Market Overview
| Study Period | 2020 - 2031 |
|---|---|
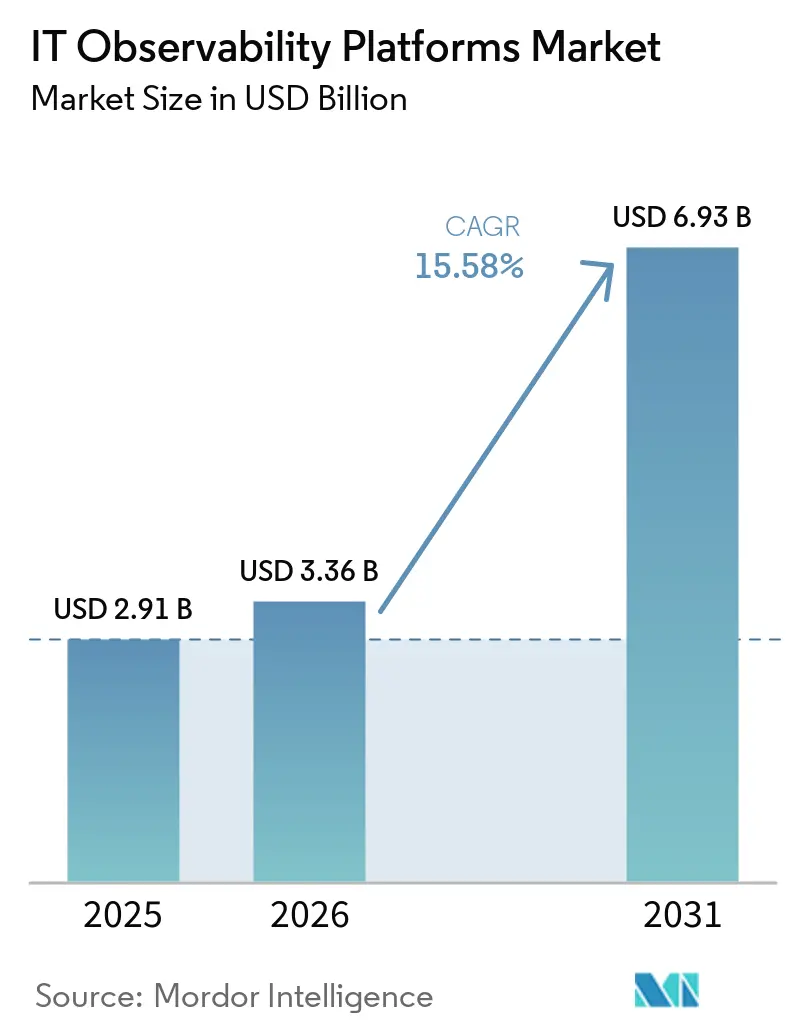
| Market Size (2026) | USD 3.36 Billion |
| Market Size (2031) | USD 6.93 Billion |
| Growth Rate (2026 - 2031) | 15.58% CAGR |
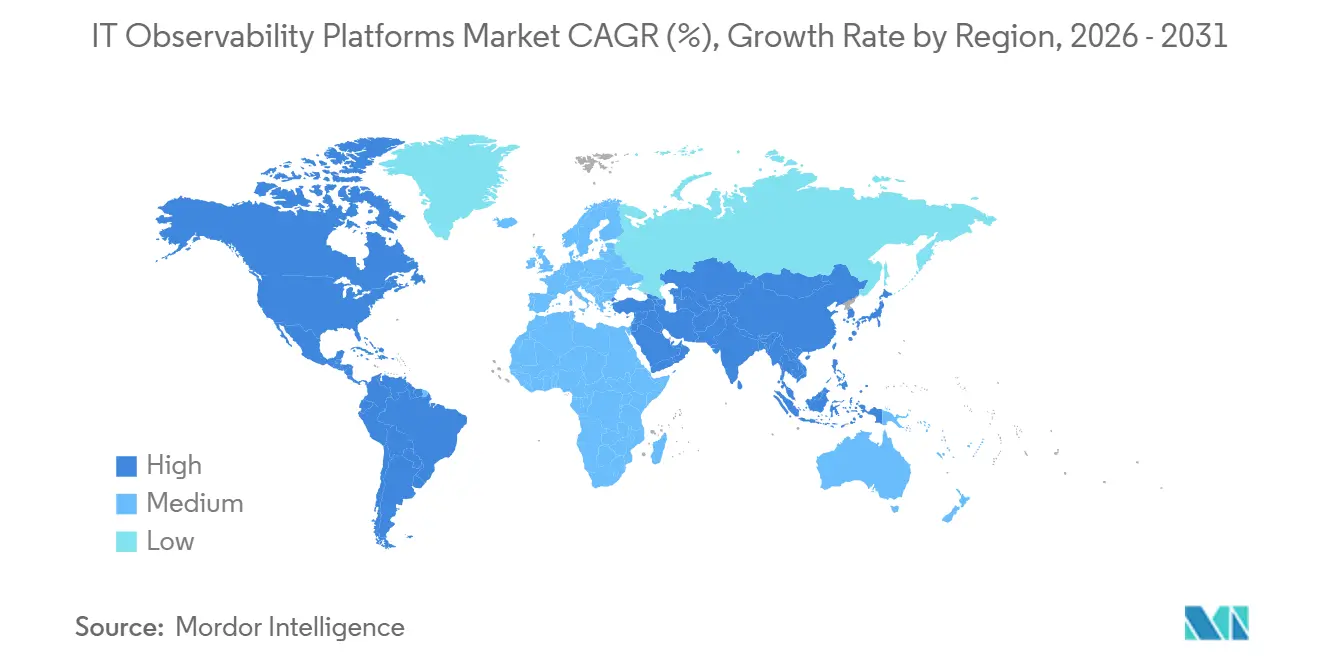
| Fastest Growing Market | Asia Pacific |
| Largest Market | North America |
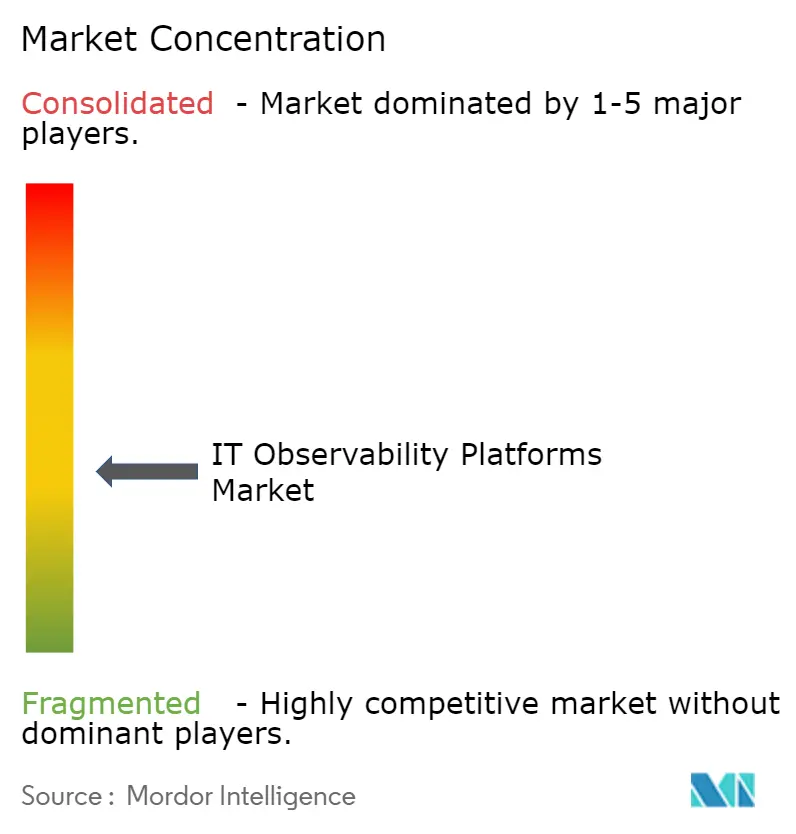
| Market Concentration | Medium |
Major Players *Disclaimer: Major Players sorted in no particular order Image © Mordor Intelligence. Reuse requires attribution under CC BY 4.0. | |
IT Observability Platforms Market Analysis by Mordor Intelligence
The IT Observability Platforms market size is expected to increase from USD 2.91 billion in 2025 to USD 3.36 billion in 2026 and reach USD 6.93 billion by 2031, growing at a CAGR of 15.58% over 2026-2031. Surging telemetry from Kubernetes, serverless, and edge workloads is encouraging enterprises to replace siloed monitoring with full-stack, AI-augmented visibility that correlates logs, metrics, and traces across hybrid estates. OpenTelemetry is rapidly becoming the default instrumentation layer, easing vendor migration and spurring tool consolidation as organizations lower ingestion costs and avoid lock-in. Consumption-based pricing now resonates with small and medium enterprises that once lacked the capital for premium suites, while regulated industries favor hybrid deployments to keep sensitive data on-premises while still benefiting from SaaS analytics. Competition is intensifying as incumbents add security telemetry and AIOps features to fend off open-core challengers, and mergers such as Palo Alto Networks’ purchase of Chronosphere indicate an accelerating convergence of observability and cybersecurity.
Key Report Takeaways
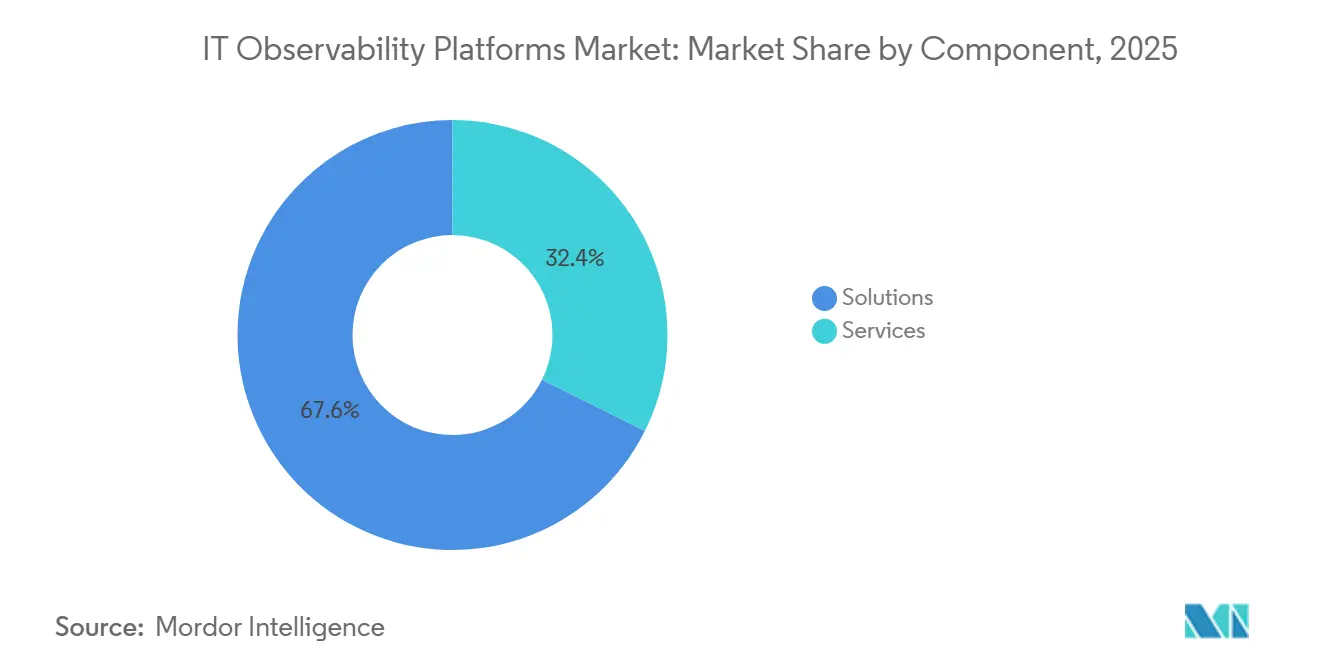
- By component, solutions led with 67.63% revenue share in 2025, while services are forecast to expand at an 18.28% CAGR through 2031.
- By application, application performance monitoring accounted for 43.12% of 2025 revenue, whereas AI operations is the fastest-growing segment, with a 22.49% CAGR to 2031.
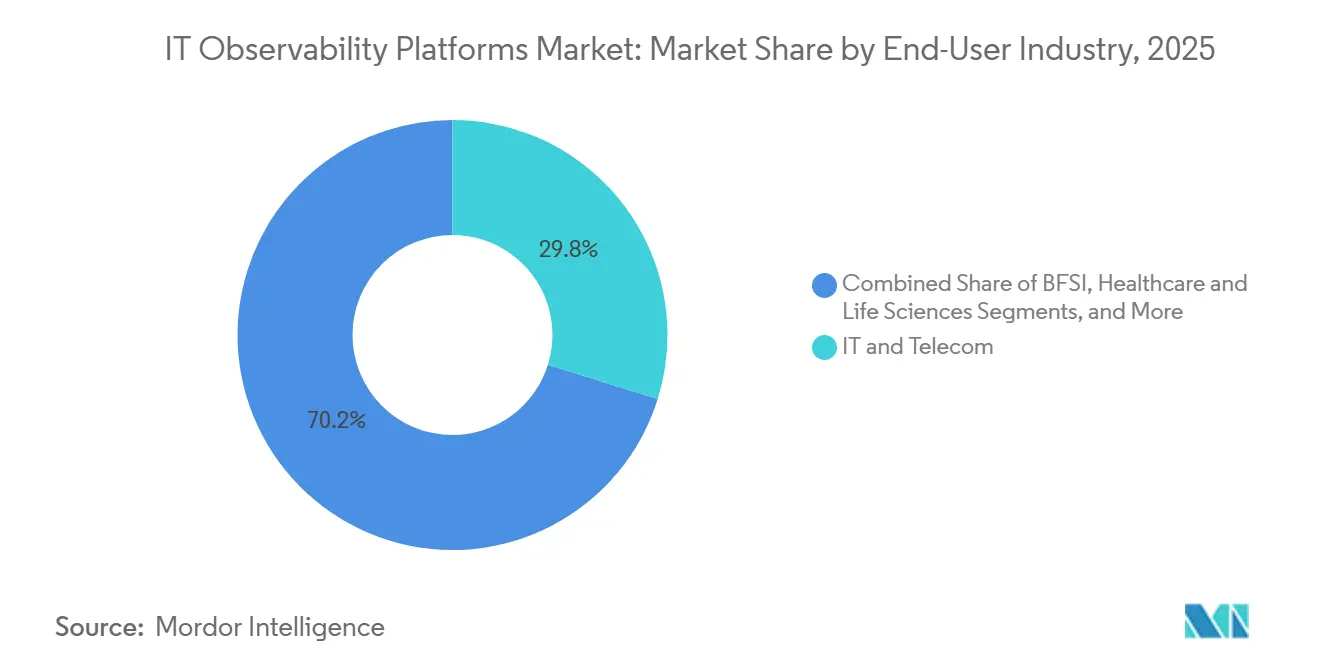
- By end-user industry, IT and telecom held 29.82% of 2025 revenue, while healthcare and life sciences are anticipated to grow at a 21.92% CAGR over 2026-2031.
- By organization size, large enterprises accounted for 64.11% of 2025 revenue, yet small and medium enterprises are set to grow at a 18.67% CAGR through 2031.
- By geography, North America commanded 36.74% of 2025 spend, but Asia-Pacific is expected to register a 19.61% CAGR through 2031.
Note: Market size and forecast figures in this report are generated using Mordor Intelligence’s proprietary estimation framework, updated with the latest available data and insights as of January 2026.
Global IT Observability Platforms Market Trends and Insights
Driver Impact Analysis*
| Driver | (~) % Impact on CAGR Forecast | Geographic Relevance | Impact Timeline |
|---|---|---|---|
| Growing Adoption of Cloud-Native Architectures | +3.8% | Global, with North America and Asia-Pacific leading | Medium term (2-4 years) |
| Integration of AI and ML for Predictive Insights | +3.5% | Global, particularly Europe and North America | Short term (≤ 2 years) |
| Standardization Around OpenTelemetry Reducing Vendor Lock-In | +2.9% | Global, with accelerated adoption in Europe and Asia-Pacific | Medium term (2-4 years) |
| Expansion of DevOps and Site Reliability Engineering Practices | +2.6% | North America, Europe, and Asia-Pacific core markets | Medium term (2-4 years) |
| Shift Toward Consumption-Based Pricing Models | +1.9% | Global, with SME concentration in North America and Europe | Short term (≤ 2 years) |
| Rising Demand for Real-Time Security and Compliance Monitoring | +1.7% | Europe (GDPR), North America (SOC2), Asia-Pacific (data sovereignty) | Long term (≥ 4 years) |
| Source: Mordor Intelligence | |||
Growing Adoption of Cloud-Native Architectures
Kubernetes clusters, serverless functions, and service meshes create ephemeral resources that break traditional host-centric monitoring. Vendors now build elastic ingestion pipelines capable of petabyte-scale trace capture, while enterprises in Asia-Pacific report a 78% positive ROI from cloud-native observability. LogicMonitor’s 2025 release added cost-optimization dashboards that correlate GPU usage with sustainability targets, aligning FinOps and GreenOps metrics. Organizations lacking unified telemetry suffer weekly high-impact outages in 41% of cases, almost double the 24% rate among full-stack adopters. As cloud-native maturity rises, demand for IT Observability Platforms accelerates, cementing this driver’s medium-term strength.
Integration of AI and ML for Predictive Insights
AIOps is shifting from simple alert correlation toward autonomous remediation. ScienceLogic’s Skylar Advisor, launched in 2026, reasons across tickets and documentation to recommend or execute fixes, shrinking mean time to resolution. Elastic’s AI SOC Engine fuses observability and security telemetry, letting teams interrogate incidents in natural language. Europe saw AI monitoring adoption jump to 50% in 2025, with France leading at 62%.[1]New Relic Research, “2025 Observability Report (EMEA),” New Relic, newrelic.com Manufacturing case studies show a 2.6× ROI when predictive maintenance combines IT and operational data. The clear productivity payoff explains the short-term impact on the IT Observability Platforms market.
Standardization Around OpenTelemetry Reducing Vendor Lock-In
81% of government agencies in Europe and the Middle East use or test OpenTelemetry, signaling a mass pivot away from proprietary agents.[2]Elastic Report, “Elastic Observability Survey 2025,” Elastic, elastic.co The Cloud Native Computing Foundation’s stewardship ensures broad language support, letting small firms instrument once and stream data to multiple backends. Datadog, Dynatrace, Elastic, and Honeycomb already ingest OpenTelemetry Protocol natively, pushing competition to insight quality rather than data capture. Yet schema drift still complicates attribute naming, leading vendors to add AI-assisted tag normalization. As lock-in fears fade, platform churn rises, expanding addressable spend for the IT Observability Platforms market.
Expansion of DevOps and Site Reliability Engineering Practices
SRE principles, error budgets, post-mortems, and service-level objectives are spreading from hyperscalers to traditional sectors, embedding observability into daily routines. LogicMonitor integrated OpenAI models in 2025 to auto-generate runbooks and reduce human toil. The U.S. Department of Agriculture Forest Service cut mean time to resolution by 60% after deploying unified telemetry. European surveys show 88% of organizations plan to add at least one new observability capability within a year. Because mature observability yields a median annual value above USD 5 million, DevOps expansion will keep market growth elevated through the medium term.
Restraint Impact Analysis*
| Restraint | (~) % Impact on CAGR Forecast | Geographic Relevance | Impact Timeline |
|---|---|---|---|
| High Telemetry Storage and Ingestion Costs | -2.1% | Global, with acute pressure in North America and Europe | Short term (≤ 2 years) |
| Talent Shortage in Cloud and Observability Skill Sets | -1.8% | Global, particularly acute in Asia-Pacific and emerging markets | Medium term (2-4 years) |
| Tool-Chain Sprawl Complicating Unified Visibility | -1.3% | North America and Europe, where legacy monitoring persists | Medium term (2-4 years) |
| Vendor Lock-In Concerns Limiting Portability | -0.9% | Global, with heightened sensitivity in regulated sectors | Long term (≥ 4 years) |
| Source: Mordor Intelligence | |||
High Telemetry Storage and Ingestion Costs
Telemetry volumes climb by more than 250% each year, yet 70% of budgets go to logs that are never queried, straining financial models. Elastic found 97% of public-sector bodies faced surprise bills in 2025 due to verbose pipelines. Vendors now offer intelligent sampling and cold-storage tiers, but governance maturity lags. Sumo Logic’s 2024 Flex Licensing, which decouples ingestion from query pricing, reduces bill shock yet still demands process change. Unless economics improve, some enterprises may delay platform upgrades, capping near-term growth.
Talent Shortage in Cloud and Observability Skill Sets
Only a small pool of engineers can instrument OpenTelemetry, tune AIOps, and manage distributed tracing. 9% of projects stall due to a lack of expertise. SolarWinds introduced a natural-language AI agent in 2025 to let junior staff query telemetry without SQL or DSL knowledge. Germany shows the steepest gap, with 28% of firms uncertain about the business value of observability. Vendors that embed automation and offer managed services will help offset skills shortages, but hiring constraints still temper the expansion of the IT Observability Platforms industry.
*Our forecasts treat driver/restraint impacts as directional, not additive. The impact forecasts reflect baseline growth, mix effects, and variable interactions.
Segment Analysis
By Component: Services Gain Momentum as Integration Grows Complex
Services revenue is growing at a 18.28% CAGR, outpacing overall IT Observability Platforms market growth. In 2025, solutions accounted for 67.63% of spending; however, enterprises are increasingly prioritizing professional and managed services to streamline multi-cloud telemetry integration and automate AIOps workflows. For instance, LogicMonitor’s AWS migration program highlights the growing demand for vendor-led expertise in managing complex IT environments. Additionally, government agencies adopting generative AI technologies are seeking advisory packages to monitor model drift and ensure compliance, further driving the uptake of services in this market.
Managed services are particularly appealing to SMEs that often lack the in-house expertise required for effective IT observability. Consumption-based bundles, which include ingestion, storage, and support, help these businesses overcome capital expenditure barriers while significantly reducing deployment timelines. Furthermore, compliance requirements under the EU Data Act are creating new opportunities for services related to audit, data masking, and governance. As open-core platforms continue to lower software costs, service revenue is emerging as a strategic hedge for vendors, helping ensure the IT Observability Platforms market size continues to expand even if license revenue growth stabilizes.


By Application: AI Operations Leads Future Spend
Application performance monitoring accounted for 43.12% of 2025 revenue, yet AI operations are experiencing rapid growth, with a compound annual growth rate (CAGR) of 22.49%, making it the fastest-growing segment among applications. Edwin AI, available in the AWS Marketplace, is a prime example of agentic automation that can reduce alert noise by up to 90%. Enterprises struggling with mean time to resolution (MTTR) exceeding 30 minutes are increasingly adopting AIOps solutions to efficiently triage incidents and execute scripts autonomously, thereby improving operational efficiency and reducing downtime.
Log management, on the other hand, is undergoing pricing commoditization following Sumo Logic’s introduction of an unlimited ingestion model. This shift has redirected the segment's focus toward improving the speed and performance of analytics. Honeycomb’s planned general availability of its Metrics feature in March 2026 marks a significant milestone in its transition to unified telemetry, positioning the company to capture a larger share of AI-driven budgets.[3]Charity Majors, “Honeycomb Metrics GA,” Honeycomb, honeycomb.io Meanwhile, security and compliance monitoring are becoming increasingly critical as platforms integrate Security Information and Event Management (SIEM) capabilities with observability tools. This integration highlights the ongoing convergence trend within the broader IT Observability Platforms market, where the demand for comprehensive and seamless solutions continues to grow.
By End-User Industry: Healthcare Registers the Fastest Uptake
IT and telecom accounted for the largest share of 2025 revenue, contributing 29.82%, primarily due to the early adoption of DevOps practices. However, the healthcare and life sciences sector is projected to grow at a robust 21.92% CAGR through 2031. The modernization of electronic health records, the expansion of telehealth services, and the increasing use of real-time patient monitoring systems are driving data influxes that rival those seen in trading systems. Cisco has highlighted how observability plays a critical role in ensuring uptime for essential healthcare services, making visibility a necessity for clinical operations.
Financial institutions remain significant investors in observability platforms, with 94% currently piloting generative AI monitoring solutions. The retail sector benefits by linking latency issues to cart conversion rates, while the manufacturing industry integrates IT and OT telemetry to enable predictive maintenance strategies. Government agencies are increasingly adopting observability solutions to meet their digital service delivery goals. These agencies often rely on managed contracts, which are driving growth in the IT Observability Platforms market within the public sector.

By Organization Size: SMEs Catch Up Via Consumption Pricing
Large enterprises accounted for 64.11% of 2025 spend, yet SMEs are expanding at a 18.67% CAGR as SaaS bundles eliminate upfront costs. OpenTelemetry’s plug-and-play libraries enable startups to instrument code efficiently without relying on proprietary agents, making it easier for smaller organizations to adopt observability practices. Additionally, vendor-managed pipelines allow lean teams to achieve mature observability capabilities without the need for dedicated Site Reliability Engineering (SRE) squads, significantly lowering the barriers to entry for SMEs.
Meanwhile, Fortune 500 firms are increasing their investments in advanced observability tools, such as distributed tracing and multi-cloud analytics, which are driving the IT Observability Platforms market's share of high-end capabilities. Vendors are strategically tailoring their offerings to meet diverse customer needs, offering usage-based pricing tiers for SMEs and enterprise agreements for global corporations. This dual-track approach not only broadens the total addressable market but also supports sustained, robust growth in the IT Observability Platforms market by addressing the unique requirements of both small and large enterprises.
Geography Analysis
North America accounted for the largest share of 36.74% in 2025, driven by the presence of hyperscale cloud providers and a well-established DevOps culture. The region's median high-impact outage costs, estimated at USD 2 million per hour, have encouraged continuous investments in advanced solutions. Full-stack platforms have already demonstrated their ability to significantly reduce these losses, with many enterprises reporting a 50% reduction. Additionally, the United States federal market has been a key driver of spending, as vendors actively pursue FedRAMP authorizations to meet stringent government requirements.
Europe demonstrates a strong regulatory influence on the market. The implementation of GDPR and the upcoming Data Act mandate that companies manage telemetry flows effectively, thereby increasing demand for platforms equipped with built-in masking and audit-trail capabilities. France leads the region with median annual budgets nearing USD 2 million, reflecting the highest spending levels in Europe. In contrast, Germany remains more cautious, with 28% of firms still uncertain about the value proposition of observability. As a result, vendors across the continent are focusing on tool consolidation and ROI dashboards to address these concerns and enhance adoption rates.
Asia-Pacific is the fastest-growing geography, with a compound annual growth rate (CAGR) of 19.61%. The region's growth is fueled by digital sovereignty laws in countries such as China, India, and Japan, which require data storage within the country and have prompted the adoption of hybrid solutions. Notably, 78% of organizations in the region report positive returns on investment (ROI), and 62% have already implemented AI-driven monitoring systems. Startups in India and Indonesia are rapidly adopting cloud-native architectures, bypassing legacy tools and driving the expansion of the IT Observability Platforms market from a relatively low base. Emerging regions, including South America, the Middle East, and Africa, are also experiencing growth, driven by telecom modernization and public-sector digitalization initiatives. However, challenges such as skills shortages and budget constraints continue to limit market penetration in these areas.

Competitive Landscape
The IT Observability Platforms market remains moderately fragmented, with a mix of established players and emerging competitors. Leading the market are Datadog, Dynatrace, and Splunk, which dominate the top tier due to their robust product offerings and strong market presence. However, open-source vendors such as Grafana Labs, Elastic, and Honeycomb are gaining traction by attracting customers through permissive licensing models and flexible deployment options, which cater to diverse organizational needs. The market also witnessed a significant development when Palo Alto Networks acquired Chronosphere for USD 3.35 billion in January 2026. This acquisition underscores the growing convergence between security and observability, signaling a trend toward further consolidation as companies seek to integrate these functionalities to enhance operational efficiency and address evolving market demands.
Strategic differentiation now hinges on AI depth, security alignment, and multi-cloud reach rather than data collection alone. LogicMonitor’s OpenAI integration generates remediation steps in natural language, while Dynatrace’s 2025 pact with Crest Data Systems fuses threat intelligence with application telemetry.[4]Dynatrace Press, “Dynatrace and Crest Data Systems Partnership,” Dynatrace, dynatrace.com Edge observability and AI infrastructure monitoring emerge as white-space plays, with specialists such as Acceldata pursuing data-pipeline analytics at petabyte scale.
OpenTelemetry significantly reduces switching costs, compelling vendors to differentiate themselves by focusing on delivering faster time-to-value and ensuring seamless ecosystem connectivity. This shift in dynamics has led to the growing adoption of consumption-based pricing models, as customers increasingly prioritize pricing transparency and flexibility. Additionally, certifications such as SOC2 and ISO 27001 have become essential prerequisites for securing large-enterprise deals, while compliance with frameworks like FedRAMP or their regional equivalents serves as critical entry barriers in specific geographic markets. As competition continues to intensify, the industry is expected to witness heightened rivalry among players. However, the ongoing trend of platform consolidation is anticipated to gradually increase switching barriers, making it more challenging for customers to transition between providers over time.
IT Observability Platforms Industry Leaders
Datadog, Inc.
Splunk Inc.
Dynatrace, Inc.
New Relic, Inc.
Cisco Systems, Inc.
- *Disclaimer: Major Players sorted in no particular order

Recent Industry Developments
- April 2026: Honeycomb announced general availability of Metrics, finalizing its move to a unified log-metric-trace model.
- January 2026: Palo Alto Networks completed its USD 3.35 billion acquisition of Chronosphere, adding cloud-native observability to its security stack.
- October 2025: Dynatrace partnered with Crest Data Systems to integrate observability and security analytics.
- August 2025: Elastic launched the AI SOC Engine with context-aware alert correlation.


Global IT Observability Platforms Market Report Scope
The IT Observability Platforms Market encompasses software solutions and associated services designed to provide comprehensive visibility into the performance, availability, and health of IT systems, applications, and infrastructure across modern digital environments. These platforms collect, correlate, and analyze telemetry data, including metrics, logs, traces, and events, to enable real-time monitoring, root-cause analysis, and proactive issue resolution across complex, distributed systems.
The IT Observability Platforms Market Report is Segmented by Component (Solutions, and Services), Application (Application Performance Monitoring, Infrastructure Monitoring, Log Management, Security and Compliance Monitoring, and AI Operations), End-user Industry (IT and Telecom, BFSI, Retail and E-commerce, Healthcare and Life Sciences, Manufacturing, Government and Public Sector, Media and Entertainment, and Other End-user Industries), Organization Size (Large Enterprises, and Small and Medium Enterprises), and Geography (North America, South America, Europe, Asia-Pacific, and Middle East and Africa). The Market Forecasts are Provided in Terms of Value (USD).
| Solutions (Platforms/Tools) | |
| Services | Consulting and Advisory |
| Integration and Deployment | |
| Support and Maintenance |
| Application Performance Monitoring |
| Infrastructure Monitorng |
| Log Management and Analytics |
| Security and Compliance Monitoring |
| Digital Experience Monitoring |
| IT and Telecom |
| BFSI |
| Retail and E-commerce |
| Healthcare and Life Sciences |
| Manufacturing |
| Government and Public Sector |
| Media and Entertainment |
| Other End-user Industries |
| Large Enterprises |
| Small and Medium Enterprises |
| North America | United States | |
| Canada | ||
| Mexico | ||
| South America | Brazil | |
| Argentina | ||
| Rest of South America | ||
| Europe | United Kingdom | |
| Germany | ||
| France | ||
| Italy | ||
| Spain | ||
| Rest of Europe | ||
| Asia-Pacific | China | |
| Japan | ||
| India | ||
| South Korea | ||
| Rest of Asia-Pacific | ||
| Middle East and Africa | Middle East | United Arab Emirates |
| Saudi Arabia | ||
| Rest of Middle East | ||
| Africa | South Africa | |
| Egypt | ||
| Rest of Africa | ||
| By Component | Solutions (Platforms/Tools) | ||
| Services | Consulting and Advisory | ||
| Integration and Deployment | |||
| Support and Maintenance | |||
| By Application | Application Performance Monitoring | ||
| Infrastructure Monitorng | |||
| Log Management and Analytics | |||
| Security and Compliance Monitoring | |||
| Digital Experience Monitoring | |||
| By End-user Industry | IT and Telecom | ||
| BFSI | |||
| Retail and E-commerce | |||
| Healthcare and Life Sciences | |||
| Manufacturing | |||
| Government and Public Sector | |||
| Media and Entertainment | |||
| Other End-user Industries | |||
| By Organization Size | Large Enterprises | ||
| Small and Medium Enterprises | |||
| By Geography | North America | United States | |
| Canada | |||
| Mexico | |||
| South America | Brazil | ||
| Argentina | |||
| Rest of South America | |||
| Europe | United Kingdom | ||
| Germany | |||
| France | |||
| Italy | |||
| Spain | |||
| Rest of Europe | |||
| Asia-Pacific | China | ||
| Japan | |||
| India | |||
| South Korea | |||
| Rest of Asia-Pacific | |||
| Middle East and Africa | Middle East | United Arab Emirates | |
| Saudi Arabia | |||
| Rest of Middle East | |||
| Africa | South Africa | ||
| Egypt | |||
| Rest of Africa | |||


Key Questions Answered in the Report
How fast is spending on AI operations growing within the IT Observability Platforms market?
AI operations is projected to rise at a 22.49% CAGR between 2026-2031, the highest rate among all application segments.
Which region is expanding the fastest for observability investments?
Asia-Pacific is forecast to grow at 19.61% CAGR, propelled by digital-sovereignty laws in China, India, Japan, and South Korea.
What cost challenges inhibit wider observability rollout?
Telemetry storage and ingestion consume 70% of budgets, and unexpected bills have affected 97% of surveyed public-sector bodies.
How are small and medium enterprises adopting observability?
SMEs favor consumption-based bundles and OpenTelemetry libraries, enabling an 18.67% CAGR without large upfront investments.
What opportunities are emerging from the convergence of observability and cybersecurity?
The integration of observability with security, like SIEM and SOC capabilities, drives unified platforms for monitoring and threat detection, fostering new revenue streams and platform consolidation.
Page last updated on:


