Market Overview
| Study Period | 2019 - 2030 |
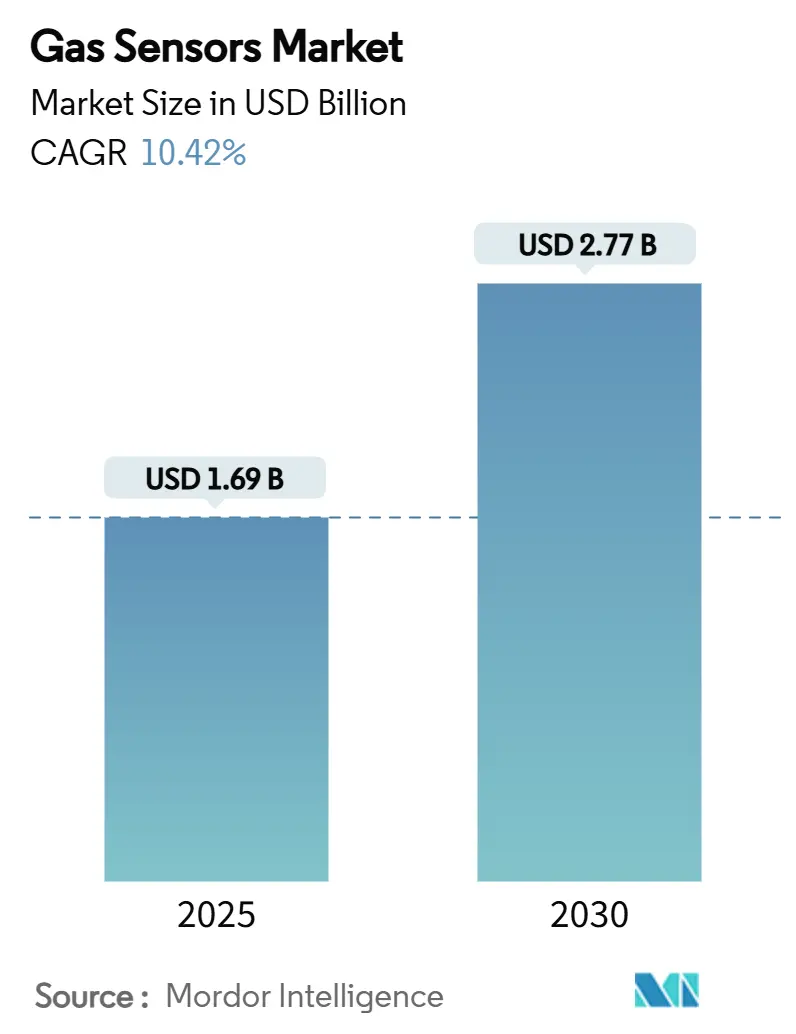
| Market Size (2025) | USD 1.69 Billion |
| Market Size (2030) | USD 2.77 Billion |
| Growth Rate (2025 - 2030) | 10.42% CAGR |
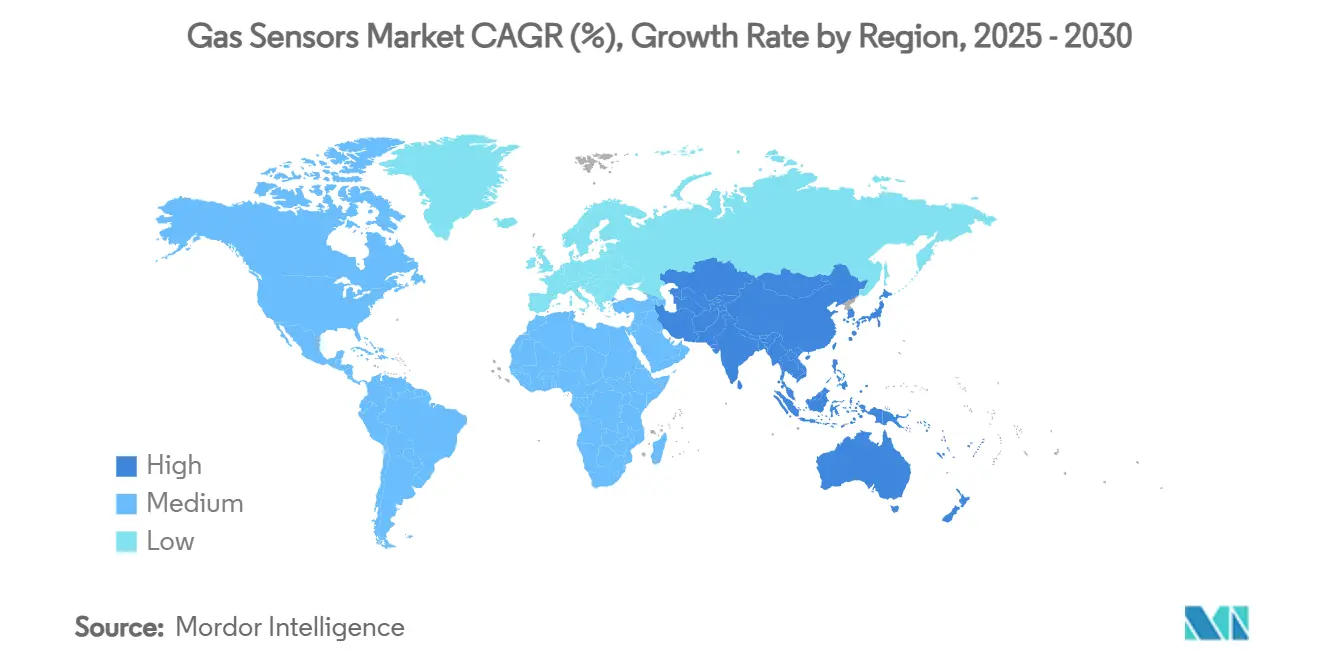
| Fastest Growing Market | Asia Pacific |
| Largest Market | Asia Pacific |
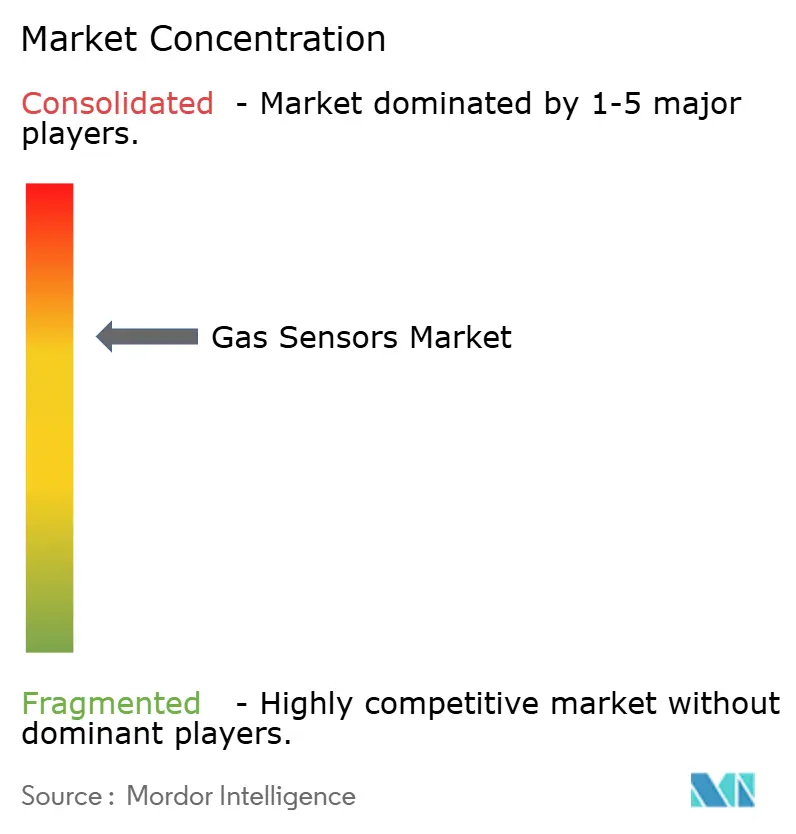
| Market Concentration | Medium |
Major Players*Disclaimer: Major Players sorted in no particular order Image © Mordor Intelligence. Reuse requires attribution under CC BY 4.0. |
|
Gas Sensors Market Analysis by Mordor Intelligence
The gas sensors market stands at USD 1.69 billion in 2025 and is forecast to reach USD 2.77 billion by 2030, advancing at a 10.42% CAGR. Rapid adoption of Euro 7 on-board diagnostics, stricter workplace safety rules, and smart-city air-quality initiatives are accelerating sensor shipments. Momentum is reinforced by the transition from electrochemical to miniaturized MEMS-semiconductor optical platforms, which boost average selling prices and enable artificial-intelligence-based selectivity. Asia-Pacific commands the largest regional position thanks to its automotive and electronics manufacturing base, while hydrocarbon and volatile-organic-compound devices are the fastest expanding gas type on the back of methane leak regulations. Consolidation among incumbents is reshaping competitive dynamics, yet technical hurdles such as sub-10 ppm cross-sensitivity and wafer-price volatility may curb adoption in cost-sensitive niches. [1]International Council on Clean Transportation, “Euro 7: The New Emission Standard for Light- and Heavy-Duty Vehicles in the European Union,” theicct.org
Key Report Takeaways
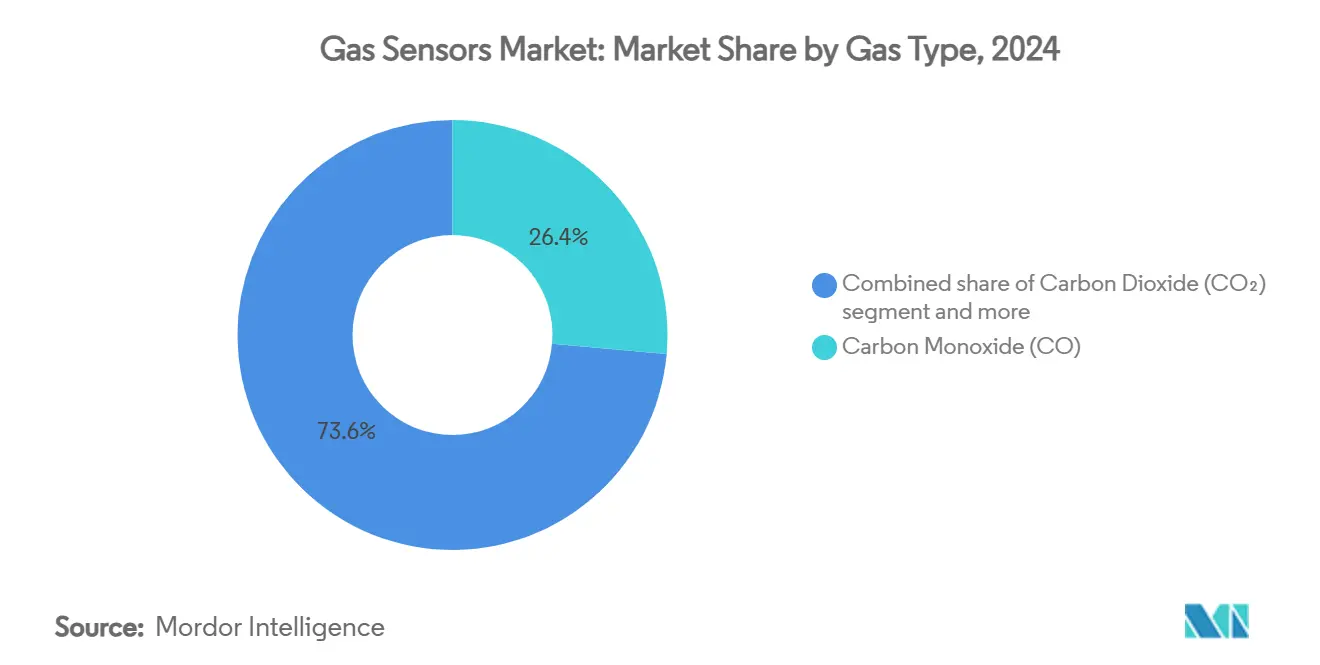
- By gas type, carbon monoxide sensors led with 26.40% revenue share in 2024; hydrocarbon and VOC sensors are projected to climb at a 12.30% CAGR through 2030.
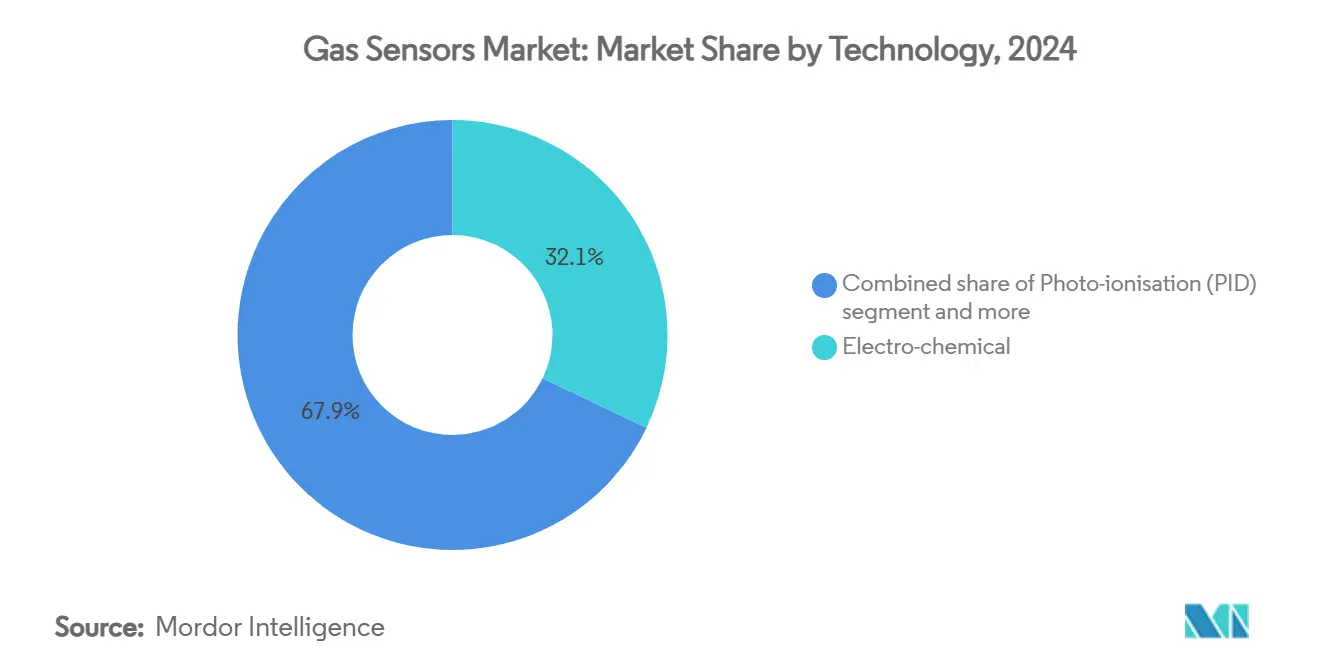
- By technology, electrochemical elements held 32.10% of the gas sensors market share in 2024, while MEMS-semiconductor optical devices are on course for a 16.00% CAGR to 2030.
- By form factor, fixed and in-situ modules dominated with 54.70% of the 2024 gas sensors market size; wearable badges and patches are poised to expand at 15.20% CAGR between 2025-2030.
- By connectivity, wired interfaces retained 82.00% share in 2024, whereas wireless connections are forecast to grow at 16.44% CAGR.
- By end-use industry, industrial safety and process control accounted for 38.20% share of the 2024 gas sensors market size, yet environmental-monitoring nodes should register the fastest 15.21% CAGR.
- By geography, Asia-Pacific led with 43.30% revenue share in 2024 and is expected to post a 14.04% CAGR through 2030.
Global Gas Sensors Market Trends and Insights
Drivers Impact Analysis
| Driver | (~) % Impact on CAGR Forecast | Geographic Relevance | Impact Timeline |
|---|---|---|---|
| Stricter vehicle on-board diagnostics (Euro 7, EPA Tier 3) | 2.10% | Europe, North America, with spillover to APAC | Medium term (2-4 years) |
| Work-place safety mandates (OSHA, REACH, ISO 45001) | 1.80% | Global, with concentration in North America & EU | Short term (≤ 2 years) |
| IoT-enabled air-quality monitoring roll-outs (smart cities) | 2.30% | APAC core, spill-over to MEA | Medium term (2-4 years) |
| Surging demand from H₂ production and fuel-cell value chain (green hydrogen) | 1.40% | Global, early gains in Europe, Japan, California | Long term (≥ 4 years) |
| Emerging methane-leak detection rules for oil & gas (OGMP 2.0) | 1.60% | Global, with focus on North America, Middle East | Short term (≤ 2 years) |
| Miniaturised MEMS-based multi-gas arrays (≤ 3 mm) driving ASP uplift | 1.10% | Global, led by Asia-Pacific manufacturing hubs | Medium term (2-4 years) |
Source: Mordor Intelligence
Understand The Key Trends Shaping This Market
Download PDF
Stricter Vehicle On-Board Diagnostics Drive Sensor Integration
Euro 7 and EPA Tier 3 rules oblige automakers to continuously track nitrogen oxides, particulate matter, and hydrocarbons across the full vehicle life cycle, raising demand for robust, multi-gas arrays rated for -40 °C to 70 °C operation. Bosch’s radar-enabled sensing modules and Honeywell’s battery-safety electrolyte detectors illustrate how compliance requirements now encompass internal combustion and electric platforms alike. Long-term durability mandates of 15 years are pushing solid-state and NDIR solutions, sidelining short-lived electrochemical cells. [2]Honeywell, “Honeywell Debuts New Technologies Across the Electric Vehicle Battery Ecosystem,” automation.honeywell.com
Work-Place Safety Mandates Spur Industrial Uptake
Global adoption of ISO 45001, OSHA’s confined-space norms, and REACH substance caps compels factories to deploy continuous fixed detectors, personal badges, and portable sniffers. Chemical processors, battery-manufacturing lines, and semiconductor cleanrooms are upgrading to MEMS arrays that self-calibrate and log data to cloud dashboards. Integration with plant-wide digital-twin platforms supports predictive interventions that cut downtime and insurance premiums.
IoT-Enabled Smart-City Deployments Accelerate Adoption
Municipal authorities are installing dense networks of low-cost nodes that achieve sub-5 µg/m³ nitrogen-dioxide accuracy after machine-learning calibration. Hyderabad’s 49-node pilot demonstrated block-level pollution visibility, while the EU AirHeritage project combined fixed and mobile sensors to lower operating costs by 40%. LoRaWAN and NB-IoT back-haul permit battery lifetimes exceeding five years, broadening deployments into emerging economies where legacy stations are scarce.Green-Hydrogen Value Chain Creates Premium Opportunities
Green-Hydrogen Value Chain Creates Premium Opportunities
Electrolysis facilities, hydrogen fuelling corridors, and blended-gas pipelines require sensors detecting leaks below 1 ppm. Portable Raman analysers now spot plumes from several meters away. MEMS thermal-conductivity detectors measure 2–25% hydrogen blends with 3% uncertainty, while flexible resistive films enable wearable badges for plant technicians. Alliances such as Dräger Safety’s university partnership highlight incumbents’ moves to corner hydrogen safety niches.[3]Optica, “Portable Raman analyser detects hydrogen leaks from a distance,” phys.org
Restraints Impact Analysis
| Restraint | (~) % Impact on CAGR Forecast | Geographic Relevance | Impact Timeline |
|---|---|---|---|
| Sub-10 ppm cross-sensitivity challenges in mixed-gas matrices | -1.40% | Global, particularly affecting precision applications | Short term (≤ 2 years) |
| Silicon supply volatility inflating wafer prices | -0.90% | Global, with concentration in Asia-Pacific manufacturing | Medium term (2-4 years) |
| Lack of global calibration standards hampers interchangeability | -0.70% | Global, affecting cross-border deployments | Long term (≥ 4 years) |
| Cost-pressure from low-end Chinese electro-chemical suppliers | -1.20% | Global, with focus on price-sensitive segments | Short term (≤ 2 years) |
Source: Mordor Intelligence
Cross-Sensitivity Challenges Limit Precision Applications
Laboratory tests show low-cost formaldehyde cells registering false positives from ozone and nitrogen dioxide, disqualifying them for outdoor stations. Agricultural ammonia monitors face similar interference, while selective tin-doped indium oxide films work only within narrow analyte windows. Metal-organic-framework filters and machine-learning classifiers improve discrimination yet add bill-of-materials cost, restraining uptake in mass-market wearables.
Silicon Supply Chain Volatility Pressures Costs
Wafer pricing swings stemming from post-pandemic foundry constraints squeeze MEMS sensor margins. Although gas sensors often rely on mature ≥ 28 nm nodes, advanced packaging, through-silicon vias, and wafer-level chip-scale encapsulation now tie them to frontline semiconductor capacity. Brands diversify suppliers and invest in local back-end lines, but smaller entrants struggle with pre-payment terms and lengthened qualification cycles, delaying new-product introductions.
Segment Analysis
By Gas Type: Hydrocarbon Sensors Set the Pace
Carbon monoxide devices dominated 2024 volume thanks to household alarms, furnace monitoring, and vehicle cabin safety, securing 26.40% of the gas sensors market share. Hydrocarbon and VOC detectors, however, are projected to outpace all peers with a 12.30% CAGR as OGMP 2.0 methane rules force energy firms to track fugitive emissions. This shift rebalances the gas sensors market toward multi-species arrays that quantify methane, ethane, and benzene simultaneously, decreasing total cost of ownership for oil and gas operators. Emerging nano transistor-based detectors measuring 1–1,000 ppm hydrogen at 300 nW consumption extend monitoring into battery modules, drones, and residential fuel-cell systems.
The hydrocarbon boom widens the addressable gas sensors market size for environmental-monitoring contractors building citywide leak-mapping programs. OEM demand for methane-specific chips also boosts average revenue per unit, partially offsetting price erosion in mature carbon monoxide and oxygen categories. Meanwhile, steady oxygen-deficiency products retain relevance in metallurgy and pulp mills, and carbon-dioxide NDIR cells ride the wave of indoor-air-quality legislation. Specialty sulphur-dioxide and hydrogen-sulphide instruments stay confined to refinery stacks and mining tunnels, yet they anchor niche profitability for high-spec suppliers.
Note: Segment shares of all individual segments available upon report purchase
By Technology: MEMS-Semiconductor Optical Platforms Disrupt Status Quo
Electrochemical elements retained 32.10% share in 2024 due to proven field reliability and low initial cost, keeping them central to the industrial safety-instrument-system ecosystem. The landscape is changing quickly as MEMS-semiconductor optical stacks are forecast to clock a 16.00% CAGR to 2030, driven by their inherent selectivity, drift immunity, and compatibility with machine-learning-based pattern libraries. This surge will lift the gas sensors market size linked to automotive, HVAC, and consumer IoT endpoints that demand calibration-free life cycles.
Hybrid devices blend optical, electrochemical, and metal-oxide principles inside one package, replacing multiple discrete boards and streamlining procurement. Bosch Sensortec’s BME688 “electronic nose” showcases AI-enabled signatures that flag food spoilage and forest-fire precursors. Pulse-driven MEMS heaters coupled with deep neural networks now reach 100% identification accuracy across hydrogen, carbon monoxide, and ammonia. As software weight rises, firmware over-the-air updates become a decisive differentiator, nudging hardware-centric rivals to form alliances with analytics vendors.
By Technology: MEMS-Semiconductor Optical Sensors Disrupt Traditional Markets
Electrochemical sensors held 32.10% of the 2024 total because factories trust their proven safety record and buyers value their low price. MEMS-semiconductor optical sensors are set to grow the fastest at a 16.00% CAGR between 2025 and 2030 since they pick out target gases more precisely and connect easily to cloud dashboards. Solid-state metal-oxide devices stay popular in mass-market consumer electronics, while photo-ionization units keep their niche for tracking volatile organic compounds. Catalytic-bead detectors still watch for explosive gases in legacy plants, and non-dispersive infrared cells are finding fresh demand in carbon-dioxide monitors used by building managers.
The move toward “smart” sensing is changing the competitive game. Pulse-driven MEMS chips that run machine-learning code inside the package can now tell hydrogen, carbon monoxide, and ammonia apart with perfect accuracy nature.com. Bosch Sensortec’s BME688 shows where the field is heading; a single part works like an electronic nose, spotting everything from spoiled food to early fire signs bosch-sensortec.com. Researchers are also coating bulk-acoustic-wave resonators with advanced metal-organic frameworks to push ethanol sensitivity while keeping the devices stable in tough conditions
By End-Use Industry: Environmental Monitoring Drives Future Growth
In 2024, industrial safety and process lines accounted for 38.20% of spending because oil, gas, and chemical sites must meet strict rules year-round. Looking ahead, environmental-monitoring networks placed in smart cities will be the quickest riser with a 15.21% CAGR through 2030. Demand here grows as urban leaders seek real-time air-quality data to guide traffic and public-health actions. Automotive powertrain and HVAC users continue to add sensors to stay within new emission caps, while building-automation and smart-home systems are starting to use the same hardware for comfort control. Clinics and life-science labs are testing breath-analysis tools, and food or cold-chain firms now fit sensors to cut spoilage.
The strength of the environmental segment reflects a mix of stricter laws and cheaper technology. The EU AirHeritage trial cut fuel use by 28% and labor costs by 40% after planners optimized routes for moving sensors.Hyderabad’s grid of 49 low-cost nodes over 4 km² maps pollutants street by street and, with machine-learning calibration, keeps nitrogen-dioxide error inside 3.5 µg/m³ RMSE. On the factory floor, managers are shifting from reactive checks to predictive maintenance that stops failures before they start, while new AI software turns raw parts-per-million readings into clear to-do lists for operators.
Geography Analysis
Asia-Pacific anchors the gas sensors market with a 43.30% revenue share in 2024 and is poised for a 14.04% CAGR through 2030. China’s smart-city blueprints mandate block-level pollution grids that demand tens of thousands of low-cost nodes, while India’s drive to align with ISO 45001 fuels plant-floor retrofits across automotive, cement, and specialty-chemicals sectors. Japan’s hydrogen-society ambitions accelerate orders for sub-ppm safety monitors, and South Korea’s semiconductor expansions seed a domestic MEMS supply chain. Local champions such as Winsen Electronics and Figaro Engineering leverage component clustering and labour arbitrage to serve both export and internal markets, underpinning sustained leadership in the gas sensors market.
North America represents a mature yet innovation-led arena. EPA Tier 3 exhaust limits, the Super Emitter Program, and Canada’s 75% methane-reduction target nurture demand for high-fidelity leak-detection networks. Oil-patch operators in Texas and Alberta deploy optical methane cameras networked to satellite feeds, while battery-gigafactory expansions in the United States Midwest specify multi-gas electro-chemical racks for worker protection. Joint ventures between sensor OEMs and software firms incubate edge-analytics modules that compress data volumes and protect IP, reinforcing value migration toward services.
Europe remains regulation centric. Euro 7 drives NOx after-treatment probes across light and heavy vehicles, and the EU-wide methane regulation adopted in 2024 compels upstream energy players to monitor flares and compressors continually. Germany’s green-steel pilot lines integrate oxygen and hydrogen gauges into closed-loop burners, while Scandinavian cities add NO2 and O3 cells to bikeway air-quality signs connected over 5G. Data-sovereignty statutes encourage on-premises servers and encrypted wireless protocols, shaping procurement specifications for transnational sensor fleets. [4]IOGP Europe, “EU Approves Methane Regulation: What’s Next for the Industry?” iogpeurope.org
Competitive Landscape
The gas sensors market shows medium concentration, with a dynamic mix of multinationals and specialized innovators. Established vendors employ vertical integration to tame semiconductor bottlenecks, as evidenced by SICK partnering with Endress+Hauser in an USD 800 million employee-transfer joint venture that merges analytics software with process instrumentation. Sensirion’s pivot to methane-only data-as-a-service illustrates portfolio pruning aligned with environmental-compliance spending. Honeywell broadened its reach by purchasing Air Products’ LNG technology for USD 1.81 billion, bundling sensors with liquefaction expertise to address energy-transition megaprojects.
Artificial-intelligence-ready hardware is the new battleground. Players integrate Tensor-core micros to run convolutional neural networks in-sensor, cutting latency and data-transmission costs. Collaboration between Honeywell and Qualcomm marries low-power AI chipsets with legacy sensing know-how, offering bundled solutions for oil-rig operators seeking methane leak localization without on-site engineers. New entrants exploit nanomaterials such as graphene and metal-organic frameworks to carve out niches in ultralow-power wearables and disposable food-packaging indicators, prompting incumbents to boost R&D outlays or acquire breakthrough labs.
Price erosion in commoditized carbon-monoxide detectors contrasts with rising premiums for hydrogen and infrared methane products. Suppliers differentiate through extended warranties, cybersecurity certifications, and SaaS dashboards translating parts-per-million readings into compliance KPI dashboards. Overall, competition pivots from unit sales to lifecycle analytics, pushing firms to cultivate recurring-revenue streams via calibration-as-a-service and predictive-maintenance subscriptions.
Gas Sensors Industry Leaders
-
Robert Bosch GmbH
-
Honeywell International Inc. (City Technology)
-
Drägerwerk AG & Co. KGaA
-
Figaro Engineering Inc.
-
Sensirion Holding AG
- *Disclaimer: Major Players sorted in no particular order
Need More Details on Market Players and Competitors?
Download PDF
Recent Industry Developments
- January 2025: Sensirion Connected Solutions acquired Kuva Systems to expand methane-emissions monitoring capabilities.
- November 2024: Sensirion Connected Solutions partnered with Project Canary to introduce MOX-sensor cartridges and cloud analytics in the United States.
- October 2024: Honeywell and Qualcomm began co-developing AI-enabled energy-sector sensing solutions.
- August 2024: SICK AG and Endress+Hauser formed a joint venture covering gas analysis and flow measurement.
Global Gas Sensors Market Report Scope
Gas sensors are electronic devices that can detect and identify the presence and concentration of various hazardous gases and vapors, such as toxic or explosive gases, volatile organic compounds (VOCs), humidity, and odors.
The gas sensors market is segmented by type (oxygen, carbon monoxide (CO), carbon dioxide (CO2), nitrogen oxide, hydrocarbon, other types), technology (electrochemical, photoionization detectors (PID), solid-state/metal oxide semiconductor, catalytic, infrared, semiconductor), application (medical, building automation, industrial, food and beverage, automotive, transportation and logistics, and other applications), and geography (North America [United States, Canada], Europe [Germany, United Kingdom, France, Rest of Europe], Asia Pacific [China, Japan, India, Rest of Asia Pacific], Latin America [Brazil, Argentina, Mexico, Rest of Latin America], Middle East, and Africa [United Arab Emirates, Saudi Arabia, Rest of the Middle East and Africa]). The market sizes and forecasts are provided in terms of value (USD) for all the above segments.
| By Gas Type | Oxygen | ||
| Carbon Monoxide (CO) | |||
| Carbon Dioxide (CO₂) | |||
| Nitrogen Oxides (NOₓ) | |||
| Hydrocarbons (VOC/CH₄) | |||
| Other Gases (SO₂, H₂S, etc.) | |||
| By Technology | Electro-chemical | ||
| Photo-ionisation (PID) | |||
| Solid-state / MOS | |||
| Catalytic Bead | |||
| Non-Dispersive Infra-Red (NDIR) | |||
| MEMS-Semiconductor Optical | |||
| By Form Factor | Fixed / In-situ Modules | ||
| Portable / Hand-held Devices | |||
| Wearable Badges / Patches | |||
| By Connectivity | Wired (4-20 mA, CAN, RS-485) | ||
| Wireless (BLE, NB-IoT, LoRaWAN) | |||
| By End-use Industry | Industrial Safety and?Process (Oil?and?Gas, Chemicals) | ||
| Automotive Powertrain and HVAC | |||
| Building Automation / Smart Homes | |||
| Medical and Life-science Equipment | |||
| Food, Beverage and Cold-chain Logistics | |||
| Environmental Monitoring and Smart City Nodes | |||
| By Geography | North America | United States | |
| Canada | |||
| Mexico | |||
| South America | Brazil | ||
| Argentina | |||
| Europe | Germany | ||
| United Kingdom | |||
| France | |||
| Russia | |||
| Asia-Pacific | China | ||
| Japan | |||
| India | |||
| South Korea | |||
| Middle East and Africa | United Arab Emirates | ||
| Saudi Arabia | |||
By Gas Type
| Oxygen |
| Carbon Monoxide (CO) |
| Carbon Dioxide (CO₂) |
| Nitrogen Oxides (NOₓ) |
| Hydrocarbons (VOC/CH₄) |
| Other Gases (SO₂, H₂S, etc.) |
By Technology
| Electro-chemical |
| Photo-ionisation (PID) |
| Solid-state / MOS |
| Catalytic Bead |
| Non-Dispersive Infra-Red (NDIR) |
| MEMS-Semiconductor Optical |
By Form Factor
| Fixed / In-situ Modules |
| Portable / Hand-held Devices |
| Wearable Badges / Patches |
By Connectivity
| Wired (4-20 mA, CAN, RS-485) |
| Wireless (BLE, NB-IoT, LoRaWAN) |
By End-use Industry
| Industrial Safety and?Process (Oil?and?Gas, Chemicals) |
| Automotive Powertrain and HVAC |
| Building Automation / Smart Homes |
| Medical and Life-science Equipment |
| Food, Beverage and Cold-chain Logistics |
| Environmental Monitoring and Smart City Nodes |
By Geography
| North America | United States |
| Canada | |
| Mexico | |
| South America | Brazil |
| Argentina | |
| Europe | Germany |
| United Kingdom | |
| France | |
| Russia | |
| Asia-Pacific | China |
| Japan | |
| India | |
| South Korea | |
| Middle East and Africa | United Arab Emirates |
| Saudi Arabia |
Need A Different Region or Segment?
Customize Now
Key Questions Answered in the Report
What is the current value of the gas sensors market and its expected size by 2030?
The gas sensors market is valued at USD 1.69 billion in 2025 and is projected to reach USD 2.77 billion by 2030, reflecting a 10.42% CAGR.
Which region commands the largest gas sensors market share today?
Asia-Pacific holds the dominant 43.30% share, propelled by large-scale smart-city deployments and robust manufacturing activity.
Which gas-type segment is expanding the fastest?
Hydrocarbon and volatile-organic-compound detectors lead growth with a forecast 12.30% CAGR as methane-leak rules tighten.
Why are MEMS-semiconductor optical sensors gaining traction?
They deliver higher selectivity, no calibration drift, and seamless AI integration, supporting a 16.00% CAGR through 2030.
How are smart cities influencing sensor demand?
Urban projects deploy dense wireless networks to map air-quality hotspots, lifting sensor volumes and enabling predictive pollution management.
What major obstacle limits precision gas sensing below 10 ppm?
Cross-sensitivity to interfering gases hampers accuracy, compelling research into advanced filtering materials and machine-learning classifiers.
How is consolidation affecting competitive dynamics?
Partnerships and acquisitions, such as SICK’s joint venture with Endress+Hauser and Bosch’s HVAC buyout, reflect a push toward vertically integrated, analytics-rich ecosystems.
Which form factor is expected to outpace others in growth?
Wearable badges and patches will register a 15.20% CAGR, driven by personal safety mandates and breakthroughs in flexible electronics.
Page last updated on: July 10, 2025

