Interactive Streaming Market Size and Share
Market Overview
| Study Period | 2019 - 2030 |
|---|---|
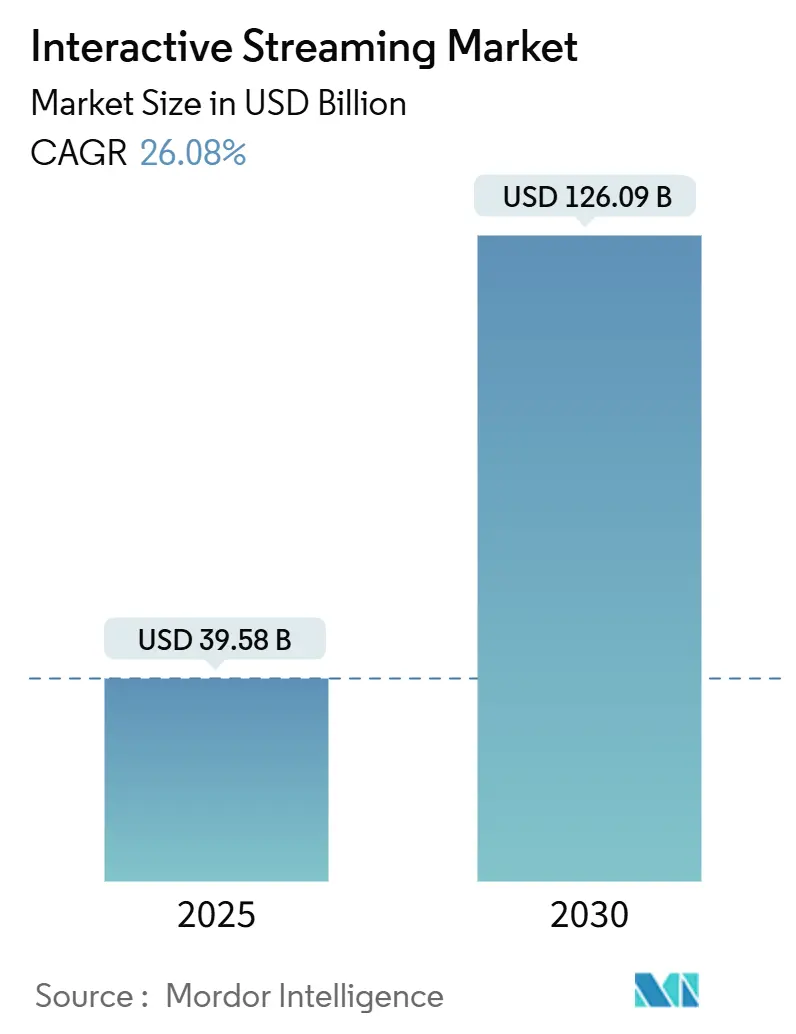
| Market Size (2025) | USD 39.58 Billion |
| Market Size (2030) | USD 126.09 Billion |
| Growth Rate (2025 - 2030) | 26.08% CAGR |
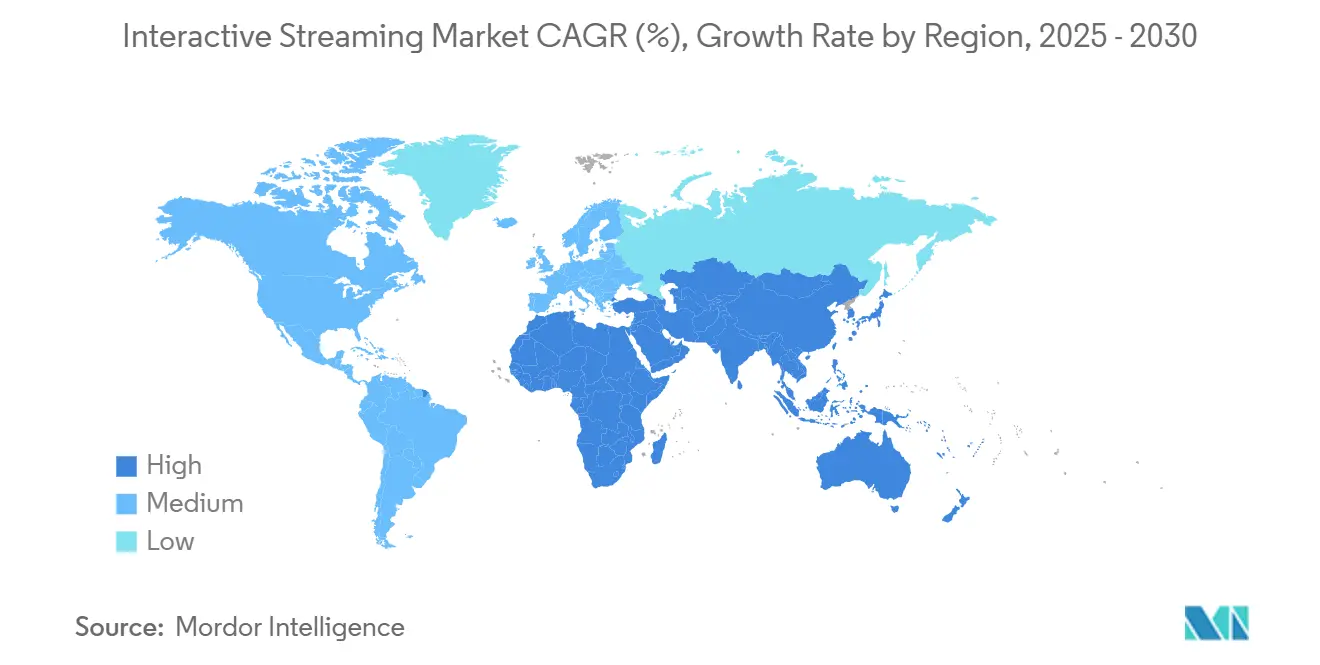
| Fastest Growing Market | Asia Pacific |
| Largest Market | North America |
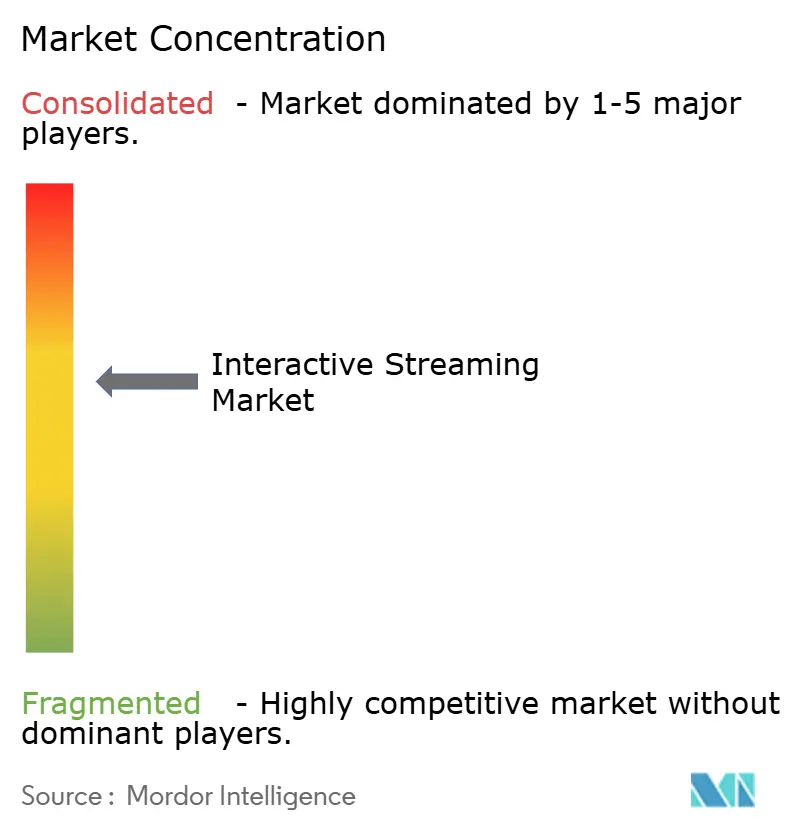
| Market Concentration | Medium |
Major Players *Disclaimer: Major Players sorted in no particular order Image © Mordor Intelligence. Reuse requires attribution under CC BY 4.0. | |
Interactive Streaming Market Analysis by Mordor Intelligence
The interactive streaming market size reached USD 39.58 billion in 2025 and is forecast to expand at a 26.08% CAGR to USD 126.09 billion by 2030, reflecting a decisive shift from passive viewing to real-time participation. The rapid commercialization of cloud gaming, monetization opportunities in the creator economy, and enterprise uptake of virtual town halls form the core demand engines. Network upgrades anchored in 5G standalone and edge computing reduce end-to-end latency and enable console-grade experiences on nearly any device. At the same time, platform providers invest in artificial intelligence to add personalized overlays that deepen engagement and build new revenue streams. Competitive dynamics intensify as gaming publishers, telecommunications carriers, cloud vendors, and audio-visual software firms converge on the same value pools. Regulatory attention on content moderation and user safety increases compliance costs but also encourages the development of differentiated features that win trust in highly regulated jurisdictions.
Key Report Takeaways
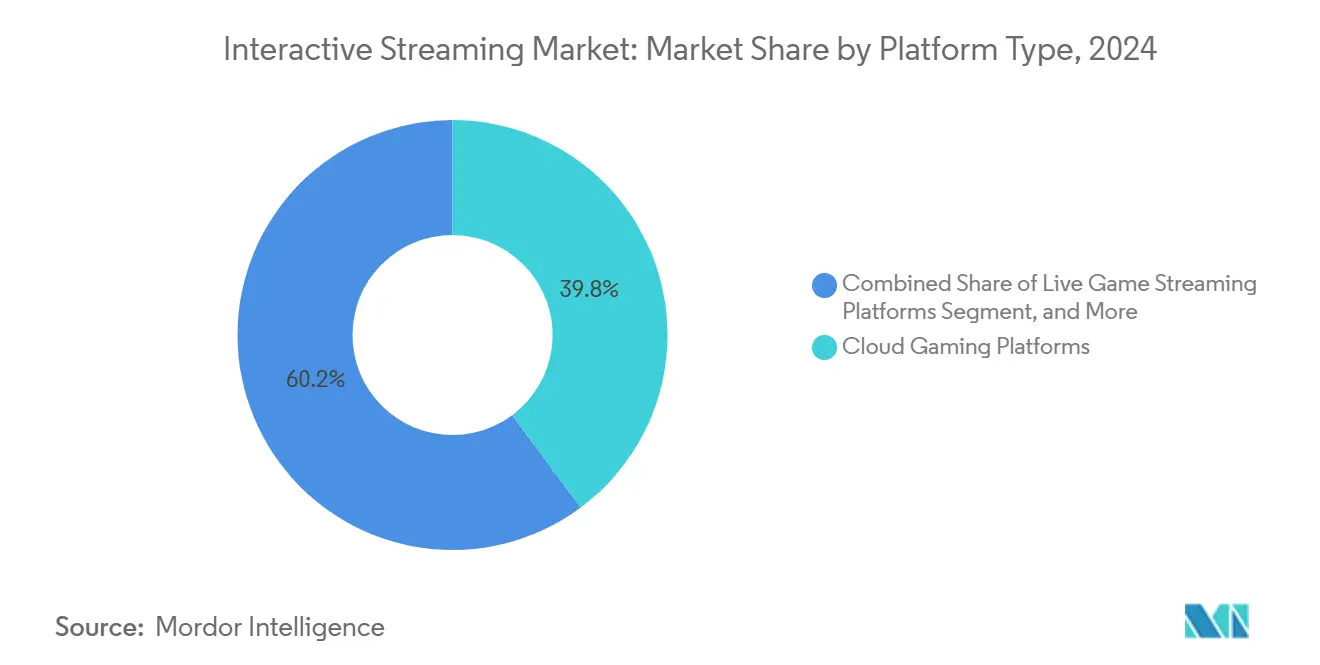
- By platform type, cloud gaming platforms led the interactive streaming market share with 39.83% in 2024, posting the fastest CAGR of 27.11% through 2030.
- By content type, gaming retained the top position with 45.87% of the interactive streaming market size in 2024; sports content is projected to grow at a 27.19% CAGR to 2030.
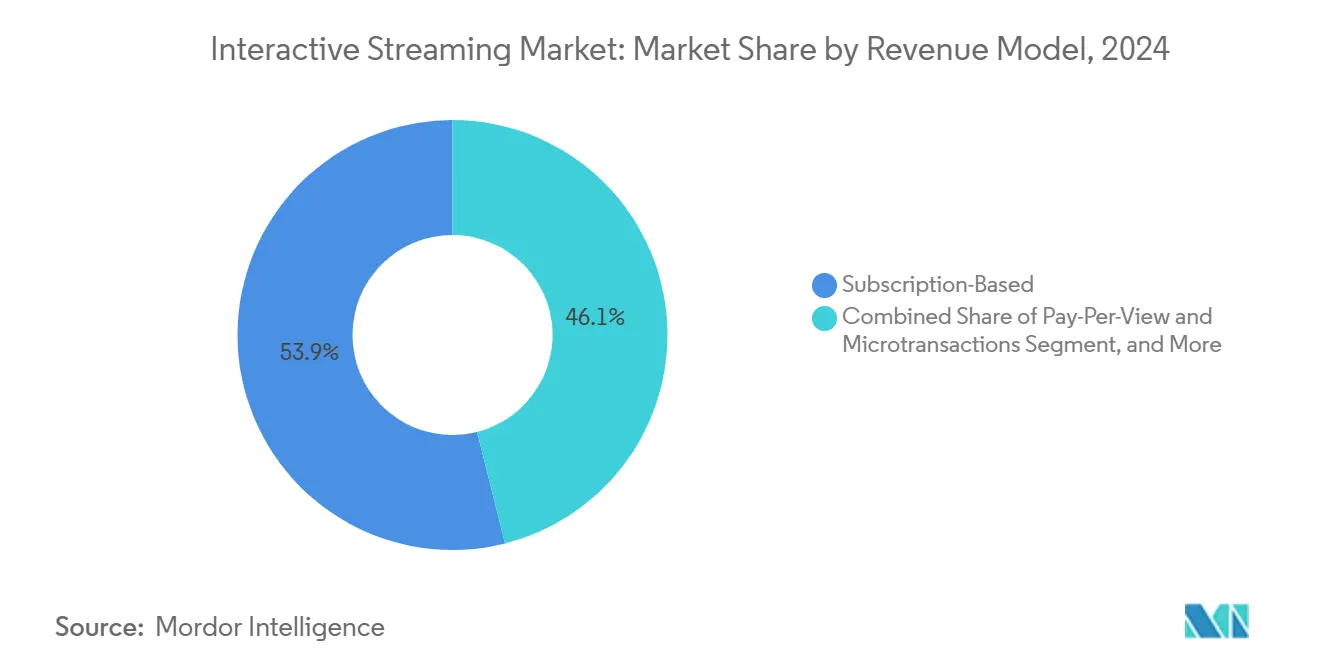
- By revenue model, subscription plans accounted for 53.92% of the interactive streaming market size in 2024; pay-per-view and microtransactions are expected to record the highest 26.89% CAGR during the forecast period.
- By device type, smartphones accounted for 36.93% of the interactive streaming market size in 2024, whereas VR and AR headsets are projected to advance at a 27.04% CAGR through 2030.
- North America commanded 34.18% of the interactive streaming market size in 2024; the Asia-Pacific region exhibits the most rapid growth, with a 27.11% CAGR to the end of the decade.
Note: Market size and forecast figures in this report are generated using Mordor Intelligence’s proprietary estimation framework, updated with the latest available data and insights as of January 2026.
Global Interactive Streaming Market Trends and Insights
Drivers Impact Analysis*
| Driver | (~) % Impact on CAGR Forecast | Geographic Relevance | Impact Timeline |
|---|---|---|---|
| Escalating Cloud Gaming Adoption | +6.2% | Global, with early gains in North America and developed Asia-Pacific markets | Medium term (2-4 years) |
| Creator Economy Monetisation Boom | +5.8% | Global, concentrated in North America, Europe, and urban Asia-Pacific | Short term (≤ 2 years) |
| 5G Network Proliferation Enhancing Low-Latency Experiences | +4.9% | Asia-Pacific core, spill-over to North America and Europe | Medium term (2-4 years) |
| Integration of Generative AI for Real-Time Interactive Overlays | +3.7% | North America and Europe, expanding to developed Asia-Pacific | Long term (≥ 4 years) |
| Growing Gen-Z Preference for Participatory Content | +3.2% | Global, with highest concentration in North America and urban markets | Short term (≤ 2 years) |
| Enterprise Adoption of Interactive Town-Halls and Events | +2.4% | North America and Europe, expanding globally | Medium term (2-4 years) |
| Source: Mordor Intelligence | |||
Escalating Cloud Gaming Adoption
Telecommunications operators are utilizing 5G standalone network slicing to ensure stable data rates for cloud gaming, as demonstrated by Deutsche Telekom’s consumer launch of 5G+ Gaming in 2024.[1]Deutsche Telekom AG, “Gamescom 2024: Deutsche Telekom Presents 5G Innovation for Mobile Cloud Gaming,” telekom.com Regional carriers invest in edge data centers equipped with high-performance GPUs, allowing platforms to stream console-quality titles without local hardware. This architecture compresses the upgrade cycle for consumers and broadens addressable reach to users priced out of dedicated consoles. As more carriers monetize differentiated quality-of-service tiers, publishers secure new distribution models that reduce physical logistics while boosting recurring revenue.
Creator Economy Monetization Boom
Goldman Sachs projects that the global creator base will climb from 67 million in 2025 to 107 million by 2030, outpacing the growth of digital advertising. Interactive platforms offer toolkits for subscriptions, virtual gifting, merchandise integration, and branded segments within a single feed. Advanced analytics guide pricing tiers while automated clip generation lowers production costs and increases posting frequency. Network effects intensify when top creators attract larger audiences, which in turn drives higher spending per viewer and encourages more creators to enter the ecosystem.
5G Network Proliferation Enhancing Low-Latency Experiences
Asia-Pacific reached 62% population coverage for 5G in 2024, up from 3% in 2020, supported by operator participation in the GSMA Open Gateway program.[2]GSMA, “The Mobile Economy Asia Pacific 2024,” gsma.com Exposed network APIs provide streaming services with carrier-grade insights into bandwidth and location, enabling dynamic bitrate adaptation. Enhanced uplink and multicast services in 5G-Advanced releases further reduce round-trip times that are critical for multiplayer gaming and synchronized watch parties. However, the advantages concentrate in urban areas, reinforcing the need for localized edge nodes in emerging regions.
Integration of Generative AI for Realtime Interactive Overlays
Microsoft’s Semantic Kernel now supports WebSocket and WebRTC streaming, allowing conversational agents to layer commentary or assistance directly onto live content. Frameworks such as StreamMind process 100 FPS video dialogue on single GPUs, opening the door to adaptive narratives that shift based on audience sentiment. Platforms monetize through AI-generated virtual goods, ultra-personalized ad placements, and moderated chatbots that improve community hygiene. In the long term, real-time generative overlays reduce content production costs while maintaining higher engagement levels.
Restraints Impact Analysis*
| Restraint | (~) % Impact on CAGR Forecast | Geographic Relevance | Impact Timeline |
|---|---|---|---|
| Bandwidth Cost Inflation in Emerging Markets | -2.8% | Asia-Pacific emerging markets, Africa, Latin America | Medium term (2-4 years) |
| Content Moderation and Safety Compliance Burden | -1.9% | Global, with highest impact in EU and UK markets | Short term (≤ 2 years) |
| Fragmented Monetisation Regulations Across Regions | -1.4% | Global, particularly affecting cross-border platforms operating in EU, Asia-Pacific, and North America | Medium term (2-4 years) |
| Rising Power Consumption of Edge Nodes | -0.9% | Global, with concentrated impact in regions with high energy costs (Europe, developed Asia-Pacific) | Long term (≥ 4 years) |
| Source: Mordor Intelligence | |||
Bandwidth Cost Inflation in Emerging Markets
ITU data show that 10 GB mobile data plans cost 26.3% of the monthly income in low-income economies, versus 0.7% in high-income markets.[3]International Telecommunication Union, “The Affordability of ICT Services 2023,” itu.int High unit costs reduce session lengths and constrain uptake of cloud gaming in regions where consumer spending is already limited. Operators respond by offering zero-rating for specific platforms; however, such initiatives often face regulatory scrutiny. Platforms invest in advanced codecs, dynamic content throttling, and downloadable asset caching to lower the required bitrates while preserving the quality of the experience.
Content Moderation and Safety Compliance Burden
The EU Digital Services Act mandates public transparency reports detailing the volumes of automated and human moderation, with a six-month cadence and a five-year retention period. The United Kingdom Online Safety Act imposes civil penalties up to GBP 782,500 for violations and requires safety-by-default settings for minors. Real-time content generation complicates compliance, as filters must work simultaneously across video, audio, and chat. Smaller providers face disproportionately higher overhead, driving market consolidation around firms that can amortize governance costs.
*Our forecasts treat driver/restraint impacts as directional, not additive. The impact forecasts reflect baseline growth, mix effects, and variable interactions.
Segment Analysis
By Platform Type: Cloud Gaming Extends Leadership
Cloud gaming platforms contributed 39.83% revenue in 2024, supported by operator partnerships that subsidize bandwidth in bundled offers. This leadership is expected to expand, as the segment grows at a 27.11% CAGR to 2030 and captures a larger share of the interactive streaming market size. Consoles also act as streaming sources, but the cloud-centric approach removes hardware barriers, driving faster adoption across emerging consumer segments. Telcos use exclusive game libraries and premium slicing tiers to upsell 5G plans, intertwining mobile ARPU with content engagement. Over the forecast period, live game streaming services maintain stickiness through creator communities, although their growth rate trails that of cloud gaming due to lower incremental monetization per viewer. Enterprise-oriented platforms carve share by embedding compliance tooling requested by global corporations, aligning with the rise of virtual town halls.
Historical data indicate that cloud gaming, once a niche market, accelerated significantly when network latency thresholds dropped below 40 ms. Deutsche Telekom’s 2024 launch of 5G slicing for gaming validated carrier interest in differentiated services. Regulatory oversight remains moderate for gameplay itself, but increases when platforms serve minors, necessitating robust parental controls across both B2C and B2B offerings. As hyperscalers expand their regional edge zones, cloud gaming platforms will focus on achieving latency improvements below 20 ms, further blurring the distinction between local and streamed gameplay.


By Content Type: Gaming Holds, Sports Surges
Gaming content dominated the interactive streaming market share, accounting for 45.87% in 2024, reflecting entrenched ecosystems that integrate chat, tipping, and esports tournaments. Sports, however, is forecast to record the fastest 27.19% CAGR. Rights-holders experiment with multi-camera streams, personalized statistics overlays, and audience voting on commentary angles. These features boost average watch time and open in-stream betting avenues in regulated markets. Education and corporate events continue to expand on the back of growing hybrid learning and demand for enterprise communications. Entertainment shows combine scripted elements with audience participation, supported by AI tools that adjust storylines in real time.
Cross-pollination among content categories intensifies as gaming platforms license sports feeds and sports broadcasters adopt gamified loyalty programs. Compliance varies: sports streams must adhere to regional blackout rules, corporate events must comply with disclosure regulations, and games targeting younger audiences require stricter age verification. This segmentation complexity drives platform investments in granular rights management and real-time geofencing features.
By Revenue Model: Subscriptions Anchor, Microtransactions Accelerate
Subscriptions represented 53.92% of 2024 revenue and remain the backbone because they deliver predictable cash flows that fund content acquisition. Yet pay-per-view and microtransactions show a 26.89% CAGR, tapping impulse purchases such as virtual gifts, premium emotes, and limited-time skins. Advertising generates a stable income as targeting accuracy improves through the use of first-party behavioral data and contextual AI. Hybrid models dominate the strategic roadmap, letting users sample basic features for free while converting power users through layered benefits.
Monetization diversity hedges against regulatory pressure on any single revenue source. For instance, several jurisdictions are considering limiting underage spending on virtual items, prompting platforms to enhance their parental consent workflows. At the same time, data privacy laws in Europe are pushing for a higher reliance on contextual ads. The interactive streaming market size, captured by transactional revenue, is likely to expand as creators bundle physical merchandise and event tickets directly within live sessions.
By Device Type: Smartphones Ubiquitous, VR Rising
Smartphones generated 36.93% of platform revenue in 2024 and are expected to remain dominant, as they seamlessly integrate content consumption with easy broadcasting capabilities through built-in cameras. The proliferation of 5G mid-band coverage makes high-resolution streaming viable even outside Wi-Fi zones. PCs and laptops remain vital for creators who require professional software and peripherals. Smart TVs are gaining market share as native streaming applications introduce interactive features, such as on-screen polls and QR code-based purchases.
VR and AR headsets, although starting from a smaller base, post a 27.04% CAGR, propelled by mixed-reality devices that overlay holographic data on real-world events. IDC expects headset volumes to surpass 9.5 million units in 2025, with mixed reality devices capturing more than 70% of the market by 2028. Interactivity in three-dimensional environments increases bandwidth and computational demands, prompting platforms to pre-render background scenes in the cloud while streaming only incremental user interactions.
Geography Analysis
North America accounted for 34.18% of 2024 revenue and enjoys network maturity that supports advanced latency-sensitive applications. Edge computing rollouts by carriers such as Verizon, combined with regional availability zones by hyperscalers, reduce round-trip times for cloud gaming to below 25 ms in major metropolitan areas. Enterprise spending underpins a steady B2B revenue stream because nearly all large firms integrate live video into communication workflows. Regulatory focus centers on platform accountability, but market depth allows leading providers to amortize compliance costs.
Asia-Pacific shows the highest 27.11% CAGR, driven by broad 5G deployment and youthful demographics. National rollouts are expected to push 5G coverage to 62% of the population by 2024, although adoption costs remain a hurdle in emerging economies. Carriers like Singtel accelerate the regional adoption of GPU-as-a-Service to localize compute and enhance user experience, while handset vendors bundle game passes to encourage uptake. Pricing tiers that compress data rates without visibly harming quality help overcome affordability gaps.
Europe benefits from digital rights regulation that fosters innovation while protecting users. TIM’s EUR 130 million (USD 147 million) data center expansion outside Rome illustrates how local infrastructure investment meets data sovereignty requirements. The European Media Freedom Act and Digital Services Act establish consistent compliance templates, which, although rigorous, streamline cross-border operations for platforms prepared to invest in governance. This balance sustains steady user growth and attracts enterprise clients who require certification under EU data standards.

Competitive Landscape
Market concentration is moderate. Traditional game publishers, telecom carriers, and hyperscale cloud providers all pursue the same audience, leading to alliances and acquisitions. Carriers integrate zero-rated plans to lock in subscribers. Cloud vendors bundle GPU credits to attract developers building interactive overlays. Gaming incumbents are adding short-form creator tools to retain audiences that are migrating to mobile devices. Emerging disruptors focus on AI-driven personalization that recommends clips or spawns synthetic companions, differentiating their offers without large content libraries.
Strategic moves highlight vertical integration. Deutsche Telekom coupled network slicing with an exclusive gaming catalog to upsell premium 5G tiers. TIM’s edge data centers bring compute closer to Italian viewers, enabling sub-20 ms latency for enterprise events. Microsoft invests in African cloud regions to secure latency improvements that will eventually benefit consumer experiences. Regulatory compliance now shapes product roadmaps; platforms that incorporate real-time moderation APIs and granular age verification gain competitive standing in Europe and the United Kingdom.
Over the forecast period, partnerships between handset makers and platforms are expected to deepen, with pre-installed interactive apps bundled into data plans. Consolidation is likely among mid-tier providers who are unable to absorb rising governance costs, prompting them to partner with infrastructure leaders for shared compliance tooling.
Interactive Streaming Industry Leaders
Amazon.com Inc.
DouYu International Holdings Limited
Huya Inc.
Bigo Technology Pte. Ltd.
Caffeine Inc.
- *Disclaimer: Major Players sorted in no particular order

Recent Industry Developments
- October 2025: Zoom upgraded its Events platform with AI-driven live translation in 30 languages and customizable immersive avatars, positioning the service for large-scale hybrid conferences and town halls.
- September 2025: Tencent Games and China Mobile completed nationwide 5G-Advanced edge network slicing for cloud gaming, cutting average latency to 15 ms across 50 mainland Chinese cities.
- June 2025: Microsoft launched an xCloud Premium tier delivering 120 FPS 4K streams via new Azure Edge Zones in 15 metropolitan areas, bundled with Game Pass Ultimate at a higher subscription price.
- April 2025: Twitch introduced interactive shoppable ads that let viewers vote in real time and complete purchases without leaving the stream, debuting across select U.S. channels ahead of a global rollout by year-end.


Global Interactive Streaming Market Report Scope
The Interactive Streaming Market Report is Segmented by Platform Type (Cloud Gaming Platforms, Live Game Streaming Platforms, Interactive Video Entertainment Platforms, E-Learning Interactive Streaming Platforms, Enterprise Interactive Streaming Platforms), Content Type (Gaming, Sports, Entertainment Shows, Education, Corporate Events), Revenue Model (Subscription-Based, Advertising-Supported, Pay-Per-View and Microtransactions, Hybrid), Device Type (Smartphones, Smart TVs, PCs and Laptops, Gaming Consoles, VR and AR Headsets), and Geography (North America, Europe, Asia-Pacific, Middle East and Africa, South America). The Market Forecasts are Provided in Terms of Value (USD).
| Cloud Gaming Platforms |
| Live Game Streaming Platforms |
| Interactive Video Entertainment Platforms |
| E-Learning Interactive Streaming Platforms |
| Enterprise Interactive Streaming Platforms |
| Gaming |
| Sports |
| Entertainment Shows |
| Education |
| Corporate Events |
| Subscription-Based |
| Advertising-Supported |
| Pay-Per-View and Microtransactions |
| Hybrid |
| Smartphones |
| Smart TVs |
| PCs and Laptops |
| Gaming Consoles |
| VR and AR Headsets |
| North America | United States | |
| Canada | ||
| Mexico | ||
| Europe | Germany | |
| United Kingdom | ||
| France | ||
| Russia | ||
| Rest of Europe | ||
| Asia-Pacific | China | |
| Japan | ||
| India | ||
| South Korea | ||
| Australia | ||
| Rest of Asia-Pacific | ||
| Middle East and Africa | Middle East | Saudi Arabia |
| United Arab Emirates | ||
| Rest of Middle East | ||
| Africa | South Africa | |
| Egypt | ||
| Rest of Africa | ||
| South America | Brazil | |
| Argentina | ||
| Rest of South America | ||
| By Platform Type | Cloud Gaming Platforms | ||
| Live Game Streaming Platforms | |||
| Interactive Video Entertainment Platforms | |||
| E-Learning Interactive Streaming Platforms | |||
| Enterprise Interactive Streaming Platforms | |||
| By Content Type | Gaming | ||
| Sports | |||
| Entertainment Shows | |||
| Education | |||
| Corporate Events | |||
| By Revenue Model | Subscription-Based | ||
| Advertising-Supported | |||
| Pay-Per-View and Microtransactions | |||
| Hybrid | |||
| By Device Type | Smartphones | ||
| Smart TVs | |||
| PCs and Laptops | |||
| Gaming Consoles | |||
| VR and AR Headsets | |||
| By Geography | North America | United States | |
| Canada | |||
| Mexico | |||
| Europe | Germany | ||
| United Kingdom | |||
| France | |||
| Russia | |||
| Rest of Europe | |||
| Asia-Pacific | China | ||
| Japan | |||
| India | |||
| South Korea | |||
| Australia | |||
| Rest of Asia-Pacific | |||
| Middle East and Africa | Middle East | Saudi Arabia | |
| United Arab Emirates | |||
| Rest of Middle East | |||
| Africa | South Africa | ||
| Egypt | |||
| Rest of Africa | |||
| South America | Brazil | ||
| Argentina | |||
| Rest of South America | |||


Key Questions Answered in the Report
What is the current value of the interactive streaming market?
The interactive streaming market size is USD 39.58 billion in 2025.
How fast will interactive streaming grow through 2030?
Aggregate revenue is projected to rise at a 26.08% CAGR to USD 126.09 billion by 2030.
Which platform type grows the quickest?
Cloud gaming platforms post the highest 27.11% CAGR thanks to 5G slicing and edge data center rollouts.
Why is Asia-Pacific the fastest-growing region?
Rapid 5G coverage expansion, large youth demographics, and emerging mobile payment ecosystems drive a 27.11% regional CAGR.
How do platforms monetize beyond subscriptions?
Microtransactions, virtual gifting, merchandise, and hybrid pricing models diversify income and reduce churn risk.
What compliance issues most affect providers?
Real-time content moderation, transparency reporting under the EU Digital Services Act, and child safety obligations under the UK Online Safety Act significantly add operational costs.
Page last updated on:


