
Interactive OTT Advertising Market Size and Share
Market Overview
| Study Period | 2020 - 2031 |
|---|---|
| Market Size (2026) | USD 6.11 Billion |
| Market Size (2031) | USD 13.05 Billion |
| Growth Rate (2026 - 2031) | 16.39 % |
| Fastest Growing Market | Asia-Pacific |
| Largest Market | North America |
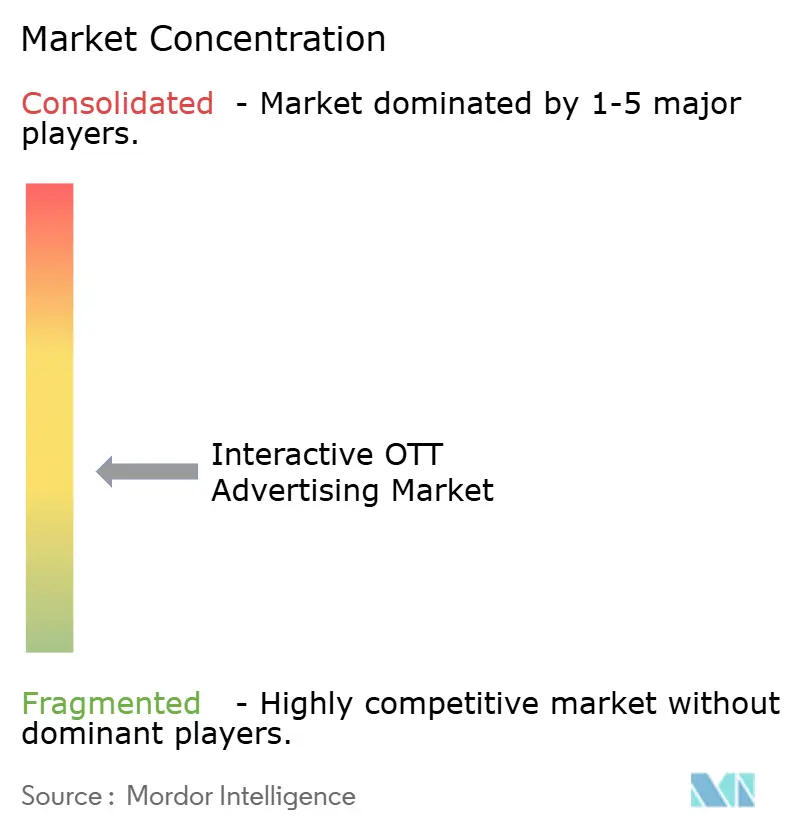
| Market Concentration | Medium |
Major Players *Disclaimer: Major Players sorted in no particular order Image © Mordor Intelligence. Reuse requires attribution under CC BY 4.0. | |
Interactive OTT Advertising Market Analysis by Mordor Intelligence
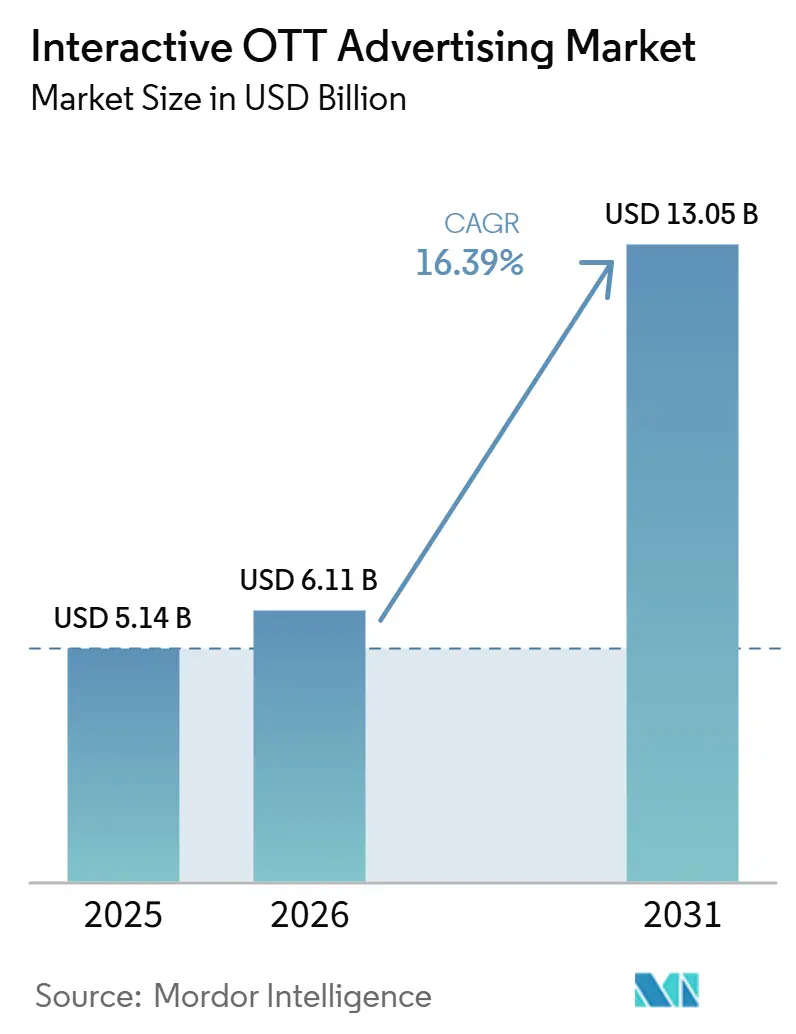
The interactive OTT advertising market size was valued at USD 5.14 billion in 2025 and is forecast to reach USD 13.05 billion by 2031 at a CAGR of 16.39% from 2026 to 2031. Growth is being shaped by the steady shift of video viewing from linear television to streaming environments, which gives advertisers more room to use response-led formats rather than passive video placements. The expansion of retail media data into OTT buying is also making campaign planning more accountable, as advertisers can more clearly connect streaming exposure with downstream commerce activity. Programmatic infrastructure is improving the way inventory is bought and sold, while interactive formats such as shoppable units and pause experiences are making the interactive OTT advertising market more performance-oriented than the broader digital video category. Competition is tightening as scaled platforms use first-party identity, operating systems, and integrated ad stacks to defend premium demand, while independent supply-side firms compete through workflow automation and inventory quality. The next phase of the interactive OTT advertising market is likely to come from faster regional adoption outside the mature North American base and from rising spend in categories such as automotive that now treat streaming as a core addressable video channel.
Key Report Takeaways
- By device type, smart TVs held 48.23% of the interactive OTT advertising market share in 2025, while gaming consoles are projected to expand at a 17.51% CAGR through 2031.
- By end-user, retail and e-commerce accounted for 30.42% share in 2025, while automotive is projected to expand at a 16.96% CAGR through 2031.
- By geography, North America accounted for 43.58% of the interactive OTT advertising market in 2025, while Asia-Pacific is projected to expand at a 17.24% CAGR through 2031.
Note: Market size and forecast figures in this report are generated using Mordor Intelligence’s proprietary estimation framework, updated with the latest available data and insights as of January 2026.
Market Trends and Insights
Drivers Impact Analysis of Interactive OTT Advertising Market*
| Driver | (~) % Impact on CAGR Forecast | Geographic Relevance | Impact Timeline |
|---|---|---|---|
| Streaming Time Shift Toward CTV And Ad-Supported OTT | +4.5% | Global | Short term (≤ 2 years) |
| Retail Media Data Spillover Into OTT Buying | +3.2% | North America and Europe, spill-over to APAC | Medium term (2-4 years) |
| Programmatic Buying Expands Accessible Premium Inventory | +2.8% | Global | Short term (≤ 2 years) |
| Shoppable And Interactive Creative Improves Conversion Efficiency | +2.1% | North America and APAC | Medium term (2-4 years) |
| AI-Driven Contextual Targeting Reduces Third-Party Data Dependence | +1.8% | Global | Medium term (2-4 years) |
| Live Sports And Event Streaming Deepen Attention Windows | +1.5% | North America, Europe, and APAC | Long term (≥ 4 years) |
| Source: Mordor Intelligence | |||
Streaming Time Shift Toward CTV And Ad-Supported OTT
The largest structural force behind the interactive OTT advertising market is the continued shift in viewing time from linear television to connected streaming platforms. The IAB stated that CTV ad spend is expected to grow 13.8% in 2026, keeping streaming ahead of the broader advertising environment and expanding the inventory base for interactive formats. That change matters because the interactive OTT advertising market depends on environments where consumers stay on-screen long enough to notice prompts, scan codes, or respond to overlays. As more ad-supported plans gain scale, premium publishers with strong identity systems are better positioned to capture pricing power and buyer confidence. The result is a market that is growing not only because more people are streaming, but also because more of that streaming is becoming commercially addressable. This dynamic keeps the interactive OTT advertising market closely tied to the broader streaming migration, now reshaping video monetization worldwide.
Retail Media Data Spillover into OTT Buying
Retail media data has become one of the clearest demand signals shaping the interactive OTT advertising market. NBCUniversal reported that retail media CTV ad spend is growing 3x faster than retail media search, which shows how quickly commerce data is moving into streaming activation.[1]NBCUniversal, “Retail Playbook,” NBCUniversal, together.nbcuni.com That change gives advertisers more confidence because exposure can be linked to online and in-store behavior with less guesswork than in traditional television planning. It also changes who spends in the channel, as sectors outside retail can adopt the same closed-loop logic to justify video budgets with clearer outcomes. This makes the interactive OTT advertising market more attractive to performance-minded buyers who once treated streaming mainly as an awareness vehicle. The longer this model spreads, the more the interactive OTT advertising market benefits from the same accountability standards that propelled retail media to the top of the advertising priority list.
Programmatic Buying Expands Accessible Premium Inventory
Programmatic access is broadening the buyer base in the interactive OTT advertising market by lowering the friction that once kept premium streaming inventory limited to large direct deals. Premion and Advertiser Perceptions found that 50% of CTV and OTT ad spend is expected to be purchased programmatically in 2026. That matters because it opens premium environments to more advertisers, including those that could not previously meet direct-buy minimums or build manual campaign structures at scale. Magnite stated that its CTV revenue contribution ex-TAC grew 30% year over year in Q1 2026 and crossed 50% of total business, which shows how strongly the sell-side is benefiting from this shift. PubMatic also said its AgenticOS platform drove more than 250 agentic deals in FY 2025 and that CTV revenue grew more than 50% year over year, reinforcing the idea that automation is becoming a durable competitive lever. As a result, the interactive OTT advertising market is becoming easier for buyers to access, while becoming more demanding for sellers that lack proprietary ad-serving, planning, or execution tools.
Shoppable And Interactive Creative Improves Conversion Efficiency
Creative formats that invite direct response are changing how advertisers value the interactive OTT advertising market. The appeal is not only novelty, but the fact that these formats create clearer action paths from exposure to response in a setting that still offers large-screen attention. This has helped move the interactive OTT advertising market beyond experimental trials into more regular campaign planning, especially in categories seeking measurable shopper or lead activity. It also explains why the market is drawing budgets that would once have stayed in standard digital video or social formats with easier attribution. At the same time, broad scaling still depends on common technical standards for pause ads, home-screen placements, squeeze-back units, and related formats, because custom integrations can slow rollout across publishers. That means creative effectiveness is already supporting growth in the interactive OTT advertising market, while format standardization will determine how quickly that growth broadens across the full supply base.
Restraints Impact Analysis of Interactive OTT Advertising Market*
| Restraint | (~) % Impact on CAGR Forecast | Geographic Relevance | Impact Timeline |
|---|---|---|---|
| Fragmented Cross-Platform Measurement Standards | -1.8% | Global | Medium term (2-4 years) |
| Ad Fraud and Invalid Traffic in Programmatic OTT Supply | -1.3% | APAC core, spill-over to EMEA and North America | Short term (≤ 2 years) |
| Privacy Regulation Limits Audience Granularity | -1.0% | North America and the EU | Short term (≤ 2 years) |
| Premium Content and Licensing Cost Inflation | -0.8% | Global | Long term (≥ 4 years) |
| Source: Mordor Intelligence | |||
Fragmented Cross-Platform Measurement Standards
Measurement fragmentation remains one of the largest barriers to the interactive OTT advertising market because buying sophistication is improving faster than attribution consistency. The Joint Industry Committee confirmed, through its 2025-2026 transactability work, that methodologies across newer currencies still vary, making unified cross-platform reporting difficult without custom data arrangements. The IAB also reported that 72% of publishers cited technical complexity as a barrier to implementing standardized CTV conversion APIs. This creates a practical problem for advertisers, because platform-native reporting can overstate individual reach and hide cross-platform duplication. The burden falls hardest on mid-sized buyers that do not have the engineering resources to stitch together bespoke measurement systems. Until this improves, the interactive OTT advertising market will continue to lose some budget efficiency to reporting gaps that buyers do not face to the same extent in more mature digital channels.
Ad Fraud and Invalid Traffic in Programmatic OTT Supply
Fraud risk remains a significant drag on the interactive OTT advertising market, especially in open programmatic supply. DoubleVerify reported that AI-fueled CTV fraud schemes surged 140% globally in Q1 2026 compared with Q1 2025. Pixalate found that invalid traffic accounted for 25% of all CTV traffic in its Q1 2026 global analysis, with Asia-Pacific at 58% and North America at 24%. This weakens trust in the open market and pushes more spend toward curated private marketplaces, premium publishers, and verified environments. It also means that not all growth in the interactive OTT advertising market is equally valuable, because low-quality supply can dilute yield even when volume rises. If verification practices do not improve faster, fraud will keep steering the interactive OTT advertising market toward a narrower set of trusted platforms and away from the broadest open exchanges.
*Our forecasts treat driver/restraint impacts as directional, not additive. The impact forecasts reflect baseline growth, mix effects, and variable interactions.
Interactive OTT Advertising Market Segment Analysis
By Device Type:
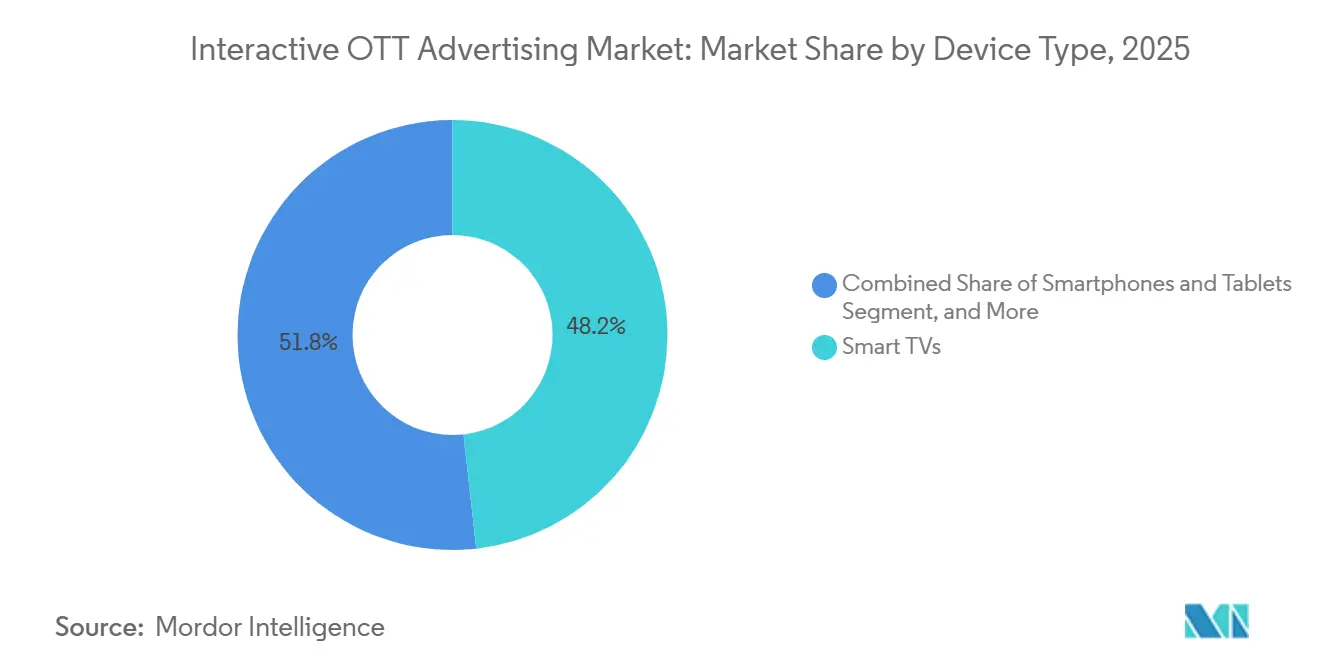
Smart TVs Lead, Gaming Consoles AccelerateSmart TVs accounted for 48.23% of the interactive OTT advertising market in 2025, keeping them well ahead of other device environments. Their lead reflects the fact that the large-screen, lean-back setting gives advertisers more time to present interactive prompts without forcing users to leave the viewing experience immediately. Japan offers a useful illustration of how device adoption is translating into commercial inventory, as the country’s CTV segment reached JPY 129.5 billion (USD 864 million) in 2025 and grew 127% year over year. Smart TV usage also aligns with the shift toward shoppable viewing, as the television screen can hold attention while companion devices handle the final transaction step. For that reason, smart TVs remain the device foundation of the interactive OTT advertising market even as advertisers test newer environments.
Smartphones and tablets still play an important role in the interactive OTT advertising market, but they often serve as companion tools that complete QR-code, cart, or checkout actions initiated on television screens. Laptops and desktops also retain relevance in the interactive OTT advertising market, where advertisers want a stronger link to contextual research, work-from-home streaming, or B2B-style audience behavior. Gaming consoles are projected to expand at a 17.51% CAGR through 2031, making them the fastest-growing device category in the interactive OTT advertising market. Microsoft Advertising stated that gaming ads were fully viewed 100% of the time in its cited research, compared with 86% for online video and 77% for social media, which points to a strong attention environment for advertisers that can access the supply effectively.[2]Microsoft Advertising, “The Future Is in Play, Gaming as Advertising’s Most Powerful Ecosystem,” Microsoft Advertising, about.ads.microsoft.com The same source also highlighted the scale of global gaming audiences and the gap between user attention and ad investment, which helps explain why console inventory is starting to attract more standardized monetization efforts. As more in-console and in-game formats become easier to transact, consoles are likely to pull a larger share of budgets inside the interactive OTT advertising market. That growth will not displace smart TVs in the near term, but it will expand the range of premium screens where interactive advertising can perform.



By End-User:
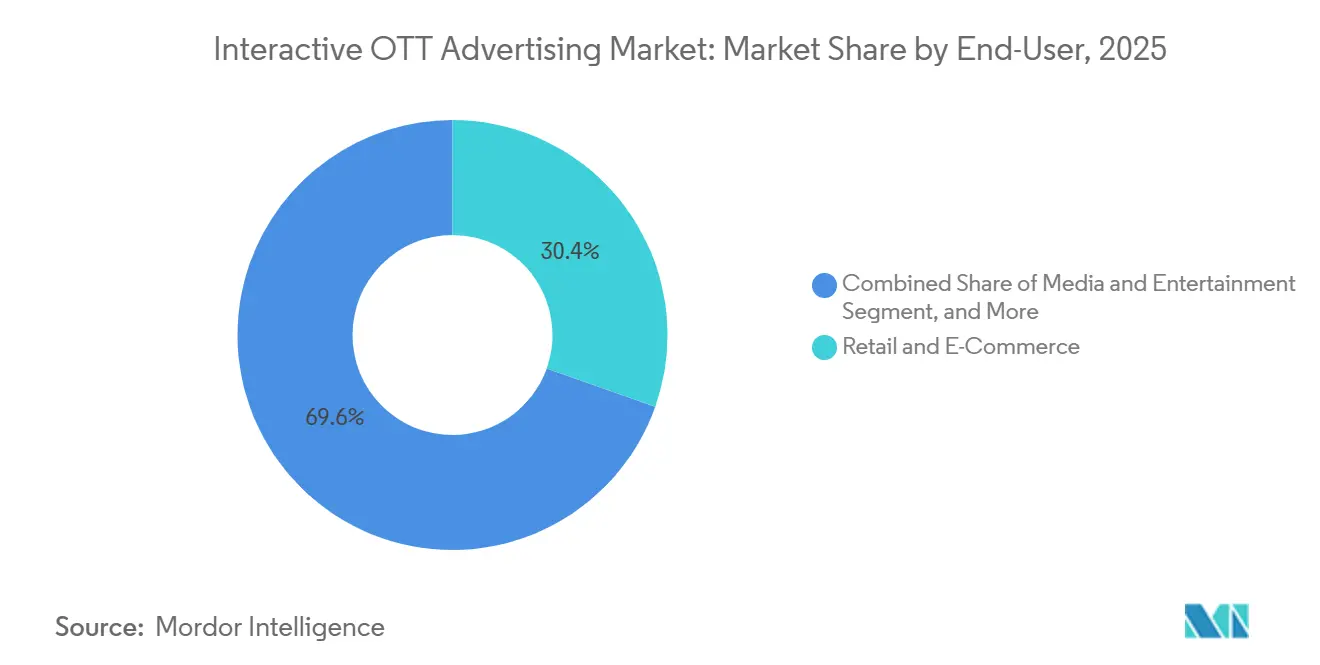
Retail Anchors The Market, Automotive Outpaces AllRetail and e-commerce accounted for the largest share of the interactive OTT advertising market in 2025 at 30.42%, making this vertical the anchor demand pool. Its position stems from a clear structural advantage: retailers can tie streaming exposure to online and in-store outcomes more directly than most other advertisers. This is why retail media methods are spilling into the interactive OTT advertising market and changing how buyers evaluate performance-led video inventory. Media and entertainment remain another major revenue base, as streaming services and studios continue to leverage advertising within OTT environments to drive subscriptions, tune-in, and content discovery. Healthcare, BFSI, and travel and hospitality are also scaling their use of the interactive OTT advertising market because better targeting and stronger action paths suit high-consideration decisions that need more detailed messaging.
Automotive is projected to expand at a 16.96% CAGR through 2031, making it the fastest-growing end-user segment in the interactive OTT advertising market. Innovid reported that 86% of auto marketers are increasing their CTV spend, indicating how quickly automotive planning is moving away from linear television toward addressable streaming. Premion cited MRI-Simmons research showing that 90% of consumers planning to purchase a vehicle within 12 months are ad-supported CTV and OTT viewers, which makes streaming a highly relevant large-screen channel for automotive demand generation. That audience fit matters because automotive campaigns need both brand storytelling and measurable lead signals, and the interactive OTT advertising market is increasingly able to deliver both. Interactive formats can move viewers from ad exposure to vehicle detail page visits, dealership consideration, and lead submissions in a more trackable way than traditional television. This is why automotive is not only growing inside the interactive OTT advertising market, but also helping define what high-value video measurement should look like in the channel. As these capabilities improve, other high-consideration sectors may follow the same path and deepen the performance role of the interactive OTT advertising market. The result is a demand mix that still depends on retail for scale, while relying on automotive to push the next stage of premium interactive use cases.
Geography Analysis
APAC Interactive OTT Advertising Market
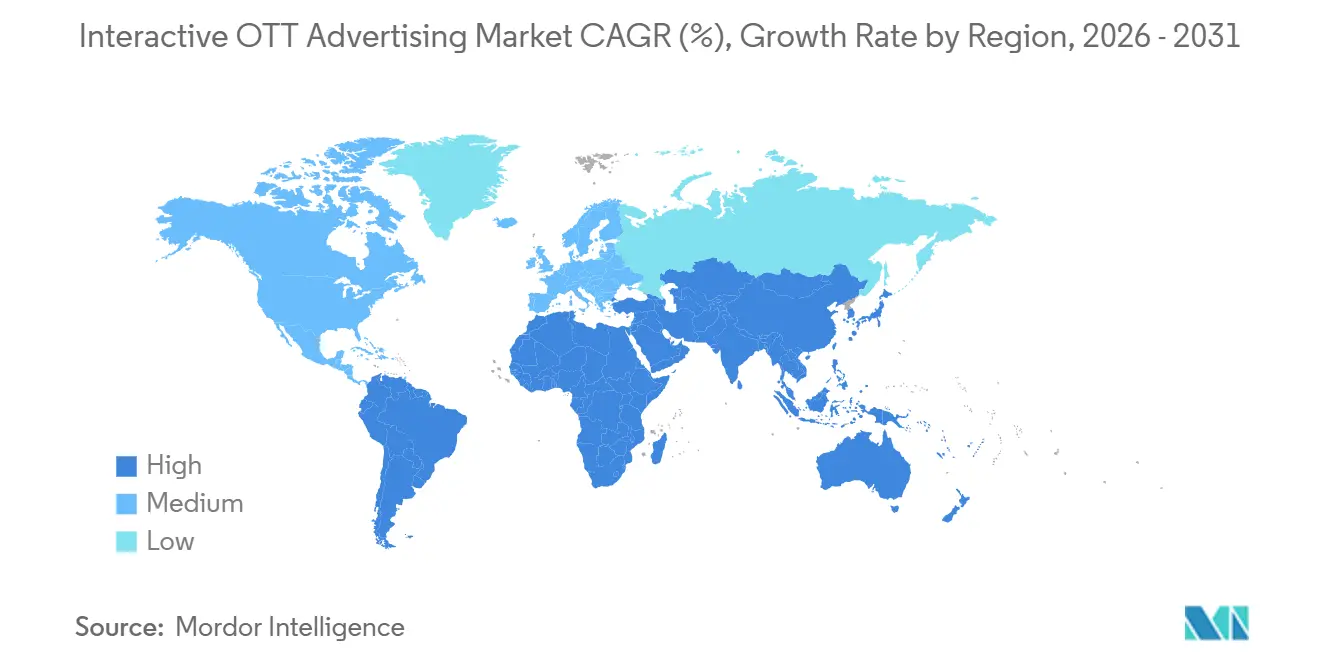
Asia-Pacific is projected to expand at a 17.24% CAGR through 2031, making it the fastest-growing region in the interactive OTT advertising market. Japan’s total video advertising market reached JPY 885.5 billion (USD 5.9 billion) in 2025 and is projected to reach JPY 1,178.3 billion (USD 7.9 billion) in 2026, suggesting a strong regional backdrop for streaming monetization. The same regional direction is reinforced by AVIA, which stated that Asia-Pacific screen industry revenues are projected to grow at a 2.8% CAGR from 2025 to 2030, with all net growth coming from online channels. That matters because online-led screen growth provides the interactive OTT advertising market with a broader supply base across both developed and developing Asian economies. It also supports the view that Asia-Pacific is moving from an emerging opportunity to a core expansion engine for the interactive OTT advertising market.
North America Interactive OTT Advertising Market
North America held 43.58% of the interactive OTT advertising market share in 2025, making it the largest regional base. The region benefits from a mature programmatic ecosystem, high connected TV penetration, and a strong retail media infrastructure that improves audience activation across streaming inventory. Amazon Ads and Roku announced in 2025 that their partnership created the largest authenticated CTV footprint in the United States, and early tests showed 40% more unique viewers reached with the same budget and nearly 30% lower ad frequency. Canada has also become attractive for quality-focused buying, with Pixalate’s Q4 2025 North America benchmarks showing lower invalid traffic levels than the United States in CTV supply.
Europe and South America Interactive OTT Advertising Market
Europe holds a meaningful position in the interactive OTT advertising market, with the United Kingdom and Germany serving as the main growth centers. Pixalate reported that UK CTV invalid traffic reached 46.1% and Germany reached 44% in Q1 2026, which shows how fraud pressure is affecting effective yield in some of the region’s largest markets.[3]Pixalate, “Q4 2025 North America Invalid Traffic and Ad Fraud Benchmarks,” GlobeNewswire, globenewswire.com Those conditions are pushing buyers toward premium direct deals and curated supply paths rather than the broadest open-market routes. France, Italy, Spain, and the rest of Europe continue to add depth to the regional programmatic OTT base, while South America is benefiting from lower streaming entry prices that are helping audiences move away from legacy pay TV. Across both regions, the interactive OTT advertising market is gaining ground where digital video consumption is rising faster than legacy viewing models can respond.

Competitive Landscape
The interactive OTT advertising market has a moderately fragmented middle layer, which gives a few scaled platforms clear structural advantages without eliminating room for independent competitors. Large ecosystem players such as Amazon and Google/YouTube benefit from first-party identity, broad advertiser relationships, device reach, and integrated buying tools, all of which raise the competitive bar for the rest of the interactive OTT advertising market. Fox Corporation’s agreement to acquire Roku, Inc. for USD 22 billion is one of the clearest examples of how scale players are trying to combine content, operating systems, distribution, and ad technology in a single stack. The SEC filing tied to the transaction showed that the combination would bring together Fox's streaming assets and Roku’s household reach of more than 100 million, thereby materially strengthening that integrated position if the deal closes. This is why the interactive OTT advertising market is no longer competing only on inventory access, but also on how much of the viewing, identity, and transaction chain a company can control.
Independent ad-tech firms remain important in the interactive OTT advertising market because many publishers and buyers still want open, interoperable routes to premium supply. Magnite reported that CTV revenue contribution ex-TAC grew 30% year over year in Q1 2026 and surpassed 50% of total business, which shows how strongly the company is benefiting from streaming demand. In June 2026, Magnite also launched Magnite Orchestration, a coordination layer designed to connect buyer agents with seller agents and activate campaigns across CTV home screens, audio, and high-impact formats through a single workflow. PubMatic added another strategic move when it launched Creator Marketplace in June 2026 to connect independent creator media companies’ premium CTV inventory with programmatic and emerging agentic demand.[4]PubMatic, “PubMatic Launches Creator Marketplace to Connect Content Creators with Emerging Agentic Demand,” PubMatic, pubmatic.com These moves show that the competitive edge in the interactive OTT advertising market is shifting toward workflow control, differentiated supply, and the ability to support more automated buying.
Another active front in the interactive OTT advertising market is privacy-safe targeting and execution at scale. Acxiom, IPG Mediabrands, and IRIS.TV launched a contextual CTV solution in August 2025 that matched ads to content genre, subject, and tone without relying on personal identifiers. Warner Bros. Discovery and Amazon Web Services added a different strategic signal in July 2026 when they announced next-generation agentic AI-powered advertising technology for automated workflows, advanced audience forecasting, and composable order management. Together, these developments suggest that success in the interactive OTT advertising market will depend less on isolated feature launches and more on owning trusted data pathways, flexible automation layers, and inventory environments that buyers believe are measurable and safe. That balance between scaled platforms and specialized enablers is likely to keep the interactive OTT advertising market competitive, but not fully fragmented, over the forecast period.
Interactive OTT Advertising Industry Leaders
Roku, Inc.
Amazon.com, Inc.
Google LLC
Comcast Corporation
Magnite, Inc.
- *Disclaimer: Major Players sorted in no particular order
Interactive OTT Advertising Market Companies Covered in this Report
- The Trade Desk, Inc.
- Roku, Inc.
- Amazon.com, Inc.
- Google LLC
- Comcast Corporation
- Magnite, Inc.
- Innovid Corp.
- PubMatic, Inc.
- Viant Technology Inc.
- Nexxen International Ltd.
- Samsung Electronics Co., Ltd.
- LG Electronics Inc.
- Fox Corporation
- Paramount Global
- The Walt Disney Company
- Netflix, Inc.
- Warner Bros. Discovery, Inc.
- Teads S.A.
- BrightLine, Inc.

Recent Industry Developments in Interactive OTT Advertising Market
- July 2026: Warner Bros. Discovery and Amazon Web Services announced the development of next-generation agentic AI-powered advertising technology. The collaboration introduces automated direct-response and commercial workflows, advanced audience forecasting, unified media planning in Q3 2026, and composable order management in Q4 2026, positioning WBD's ad platform as one of the industry's most fully automated end-to-end advertising systems.
- June 2026: Fox Corporation announced an agreement to acquire Roku, Inc. for USD 22 billion. The deal merges Fox's Tubi and Fox One streaming services with Roku's connected TV operating system, reaching more than 100 million households, and is expected to create the third-largest television business in the US by viewership. The transaction is pending regulatory and shareholder approval and is expected to close in H1 2027.
- June 2026: Magnite launched Magnite Orchestration, a coordination layer enabling buyers to connect their buying agents to Magnite's seller agents, generate media plans from a simple RFP, and activate omnichannel campaigns across CTV home screens, audio, and high-impact formats through a single agentic workflow. Dentsu and DIRECTV Advertising were among the initial testing partners.
- June 2026: PubMatic launched its Creator Marketplace, the first programmatic CTV auction connecting independent creator media companies' premium CTV inventory with programmatic and emerging agentic demand. MeatEater, the outdoor lifestyle media brand, joined as the inaugural launch partner, with additional publisher partners expected across key verticals.


Global Interactive OTT Advertising Market Report Scope
The interactive OTT advertising market covers digital advertising formats delivered through over-the-top streaming platforms and services, enabling viewer engagement through features such as clickable ads, shoppable content, polls, QR codes, interactive overlays, and personalized calls to action across connected TVs, mobile devices, tablets, and desktops. The market includes advertising solutions, platforms, and services used by brands, agencies, publishers, and streaming service providers to target, measure, and optimize interactive ad campaigns across subscription-based, ad-supported, and hybrid OTT environments.
The Interactive OTT Advertising Market Report is Segmented by Device Type (Smart TVs, Smartphones and Tablets, Gaming Consoles, Laptops and Desktops, and Other Device Types), End-User (Media and Entertainment, Retail and E-Commerce, Automotive, BFSI, Healthcare, Travel and Hospitality, and Other End-Users), and Geography (North America, South America, Europe, Asia-Pacific, Middle East, and Africa). The Market Forecasts are Provided in Terms of Value (USD).
| Smart TVs |
| Smartphones and Tablets |
| Gaming Consoles |
| Laptops and Desktops |
| Other Device Types |
| Media and Entertainment |
| Retail and E-Commerce |
| Automotive |
| BFSI |
| Healthcare |
| Travel and Hospitality |
| Other End-Users |
| North America | United States |
| Canada | |
| Mexico | |
| South America | Brazil |
| Argentina | |
| Chile | |
| Rest of South America | |
| Europe | Germany |
| United Kingdom | |
| France | |
| Italy | |
| Spain | |
| Rest of Europe | |
| Asia-Pacific | China |
| Japan | |
| India | |
| South Korea | |
| Australia | |
| Rest of Asia-Pacific | |
| Middle East | Saudi Arabia |
| United Arab Emirates | |
| Qatar | |
| Rest of Middle East | |
| Africa | South Africa |
| Egypt | |
| Nigeria | |
| Rest of Africa |
| By Device Type | Smart TVs | |
| Smartphones and Tablets | ||
| Gaming Consoles | ||
| Laptops and Desktops | ||
| Other Device Types | ||
| By End-User | Media and Entertainment | |
| Retail and E-Commerce | ||
| Automotive | ||
| BFSI | ||
| Healthcare | ||
| Travel and Hospitality | ||
| Other End-Users | ||
| By Geography | North America | United States |
| Canada | ||
| Mexico | ||
| South America | Brazil | |
| Argentina | ||
| Chile | ||
| Rest of South America | ||
| Europe | Germany | |
| United Kingdom | ||
| France | ||
| Italy | ||
| Spain | ||
| Rest of Europe | ||
| Asia-Pacific | China | |
| Japan | ||
| India | ||
| South Korea | ||
| Australia | ||
| Rest of Asia-Pacific | ||
| Middle East | Saudi Arabia | |
| United Arab Emirates | ||
| Qatar | ||
| Rest of Middle East | ||
| Africa | South Africa | |
| Egypt | ||
| Nigeria | ||
| Rest of Africa | ||


Key Questions Answered in the Report
How large is the interactive OTT advertising space and how fast is it growing?
The interactive OTT advertising market was valued at USD 5.14 billion in 2025 and is forecast to reach USD 13.05 billion by 2031, growing at a 16.39% CAGR from 2026 to 2031.
Which device category currently leads revenue generation?
Smart TVs led device revenue with 48.23% share in 2025 because large-screen viewing creates stronger conditions for shoppable and response-led formats.
Which end-user category contributes the most to spending?
Retail and e-commerce were the largest end-user segments with 30.42% share in 2025, supported by stronger attribution between streaming exposure and purchase activity.
Which end-user category is growing the fastest?
Automotive is projected to post the fastest growth at a 16.96% CAGR through 2031 as car marketers move budget from linear TV to addressable streaming.
Which region leads today and which one is expanding the fastest?
North America held the largest regional share at 43.58% in 2025, while Asia-Pacific is projected to grow the fastest at a 17.24% CAGR through 2031.
What is the biggest challenge affecting advertiser’s confidence?
Fragmented measurement and rising fraud remain the main barriers, because they reduce visibility into true cross-platform performance and inventory quality.
Page last updated on:





