
Inspection Equipment and Services Market Size and Share
Market Overview
| Study Period | 2020 - 2031 |
|---|---|
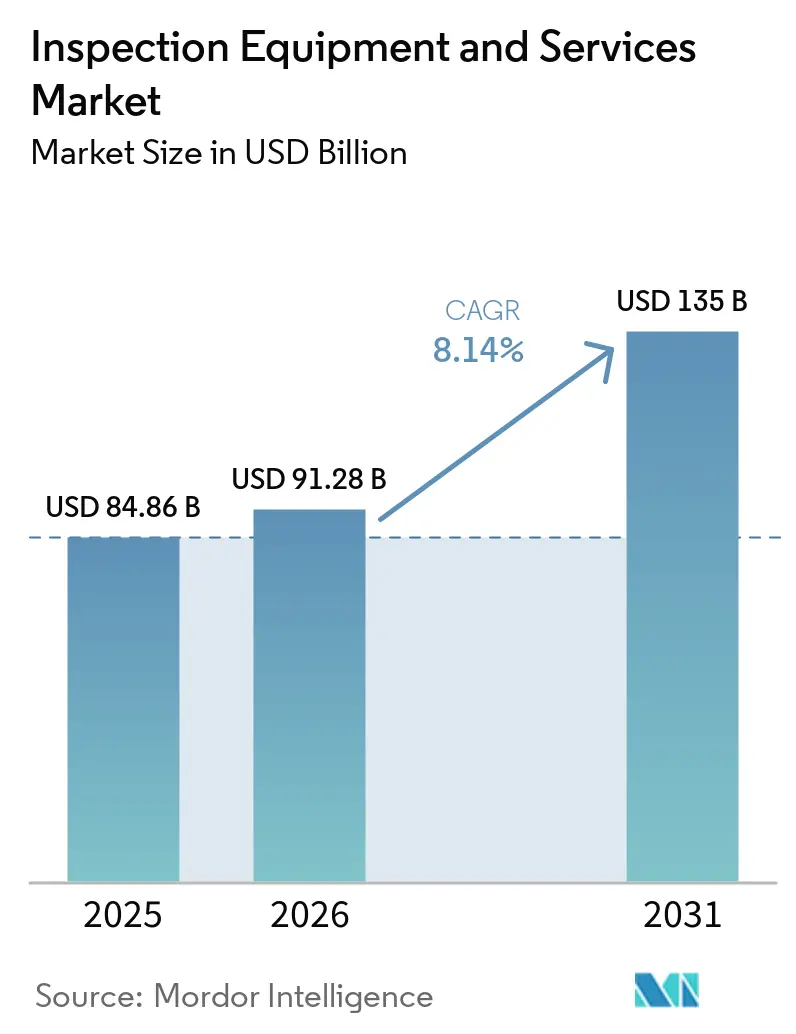
| Market Size (2026) | USD 91.28 Billion |
| Market Size (2031) | USD 135 Billion |
| Growth Rate (2026 - 2031) | 8.14 % |
| Fastest Growing Market | Asia-Pacific |
| Largest Market | Asia-Pacific |
| Market Concentration | Medium |
Major Players *Disclaimer: Major Players sorted in no particular order Image © Mordor Intelligence. Reuse requires attribution under CC BY 4.0. | |
Inspection Equipment and Services Market Analysis by Mordor Intelligence
The inspection equipment and services market size is expected to increase from USD 84.86 billion in 2025 to USD 91.28 billion in 2026 and reach USD 135.00 billion by 2031, growing at a CAGR of 8.14% over 2026-2031. The inspection equipment and services market is supported by aging assets that require more frequent integrity reviews and by safety rules that require documented inspection activity. Operators are shifting from fixed inspection schedules toward condition monitoring that uses connected instruments, digital records, and software-assisted review. This change favors providers that can combine field expertise with measurement, imaging, and data management capabilities. It also raises the value of long-term service contracts because certified baseline records and established operating procedures can make a change of provider more difficult. The inspection equipment and services market is also gaining demand from advanced manufacturing, where defect prevention and traceability are built into production workflows.
Key Report Takeaways
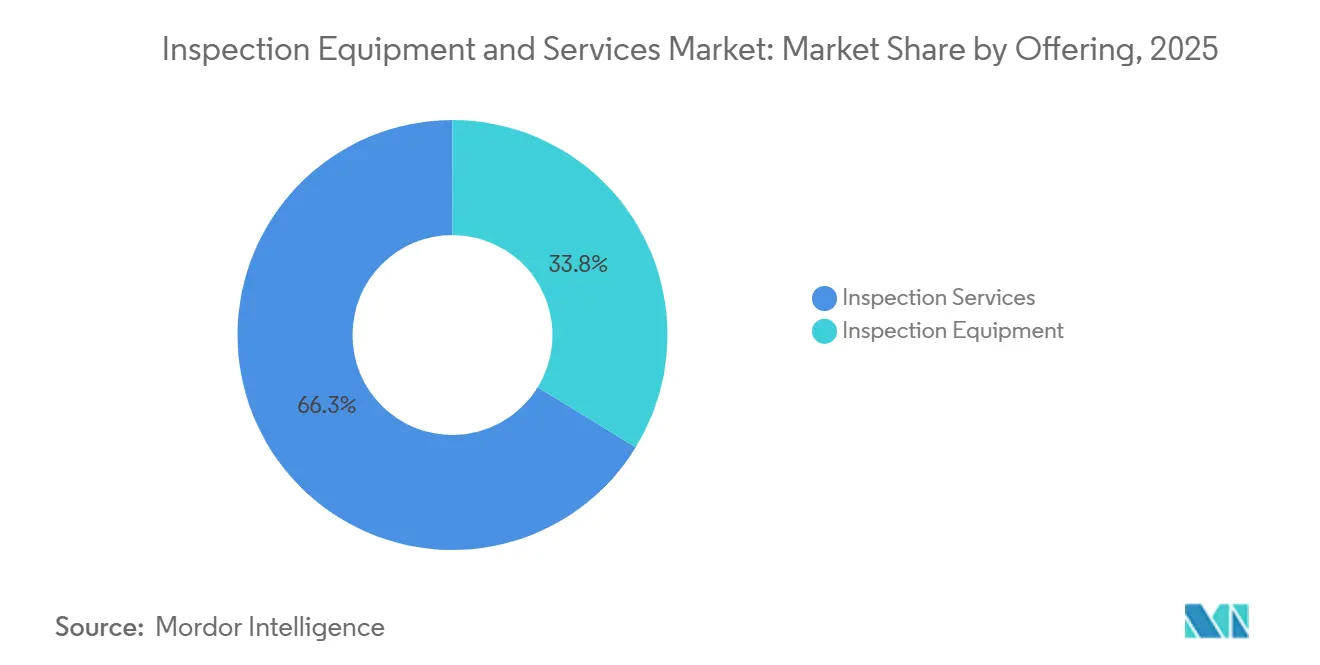
- By offering, inspection services held 66.25% of the inspection equipment and services market share in 2025. and further the services are projected to grow at a 10.02% CAGR through 2031.
- By technology, contact inspection held 58.43% of revenue in 2025, while non-contact inspection is projected to expand at a 10.71% CAGR through 2031.
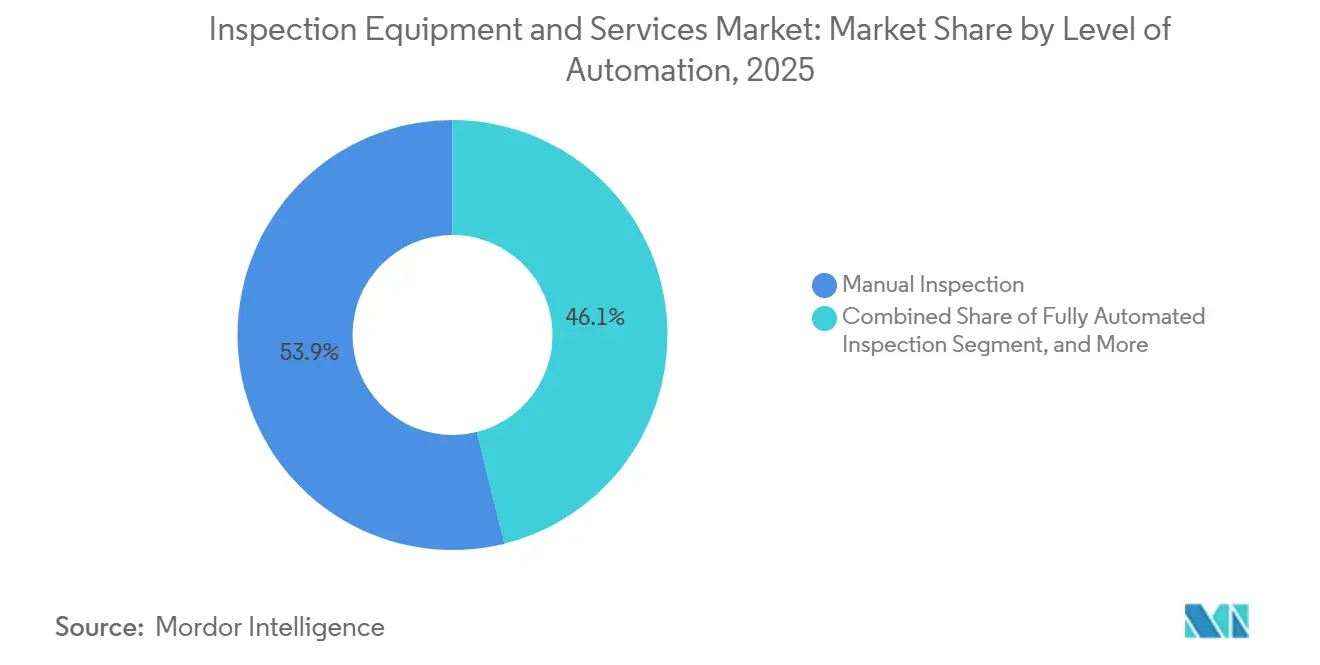
- By level of automation, manual inspection held 53.88% of revenue in the inspection equipment and services market in 2025, while fully automated inspection is projected to grow at an 11.13% CAGR through 2031.
- By end-user industry, oil and gas accounted for 19.93% of revenue in 2025, while electronics and semiconductors are projected to expand at a 10.52% CAGR through 2031.
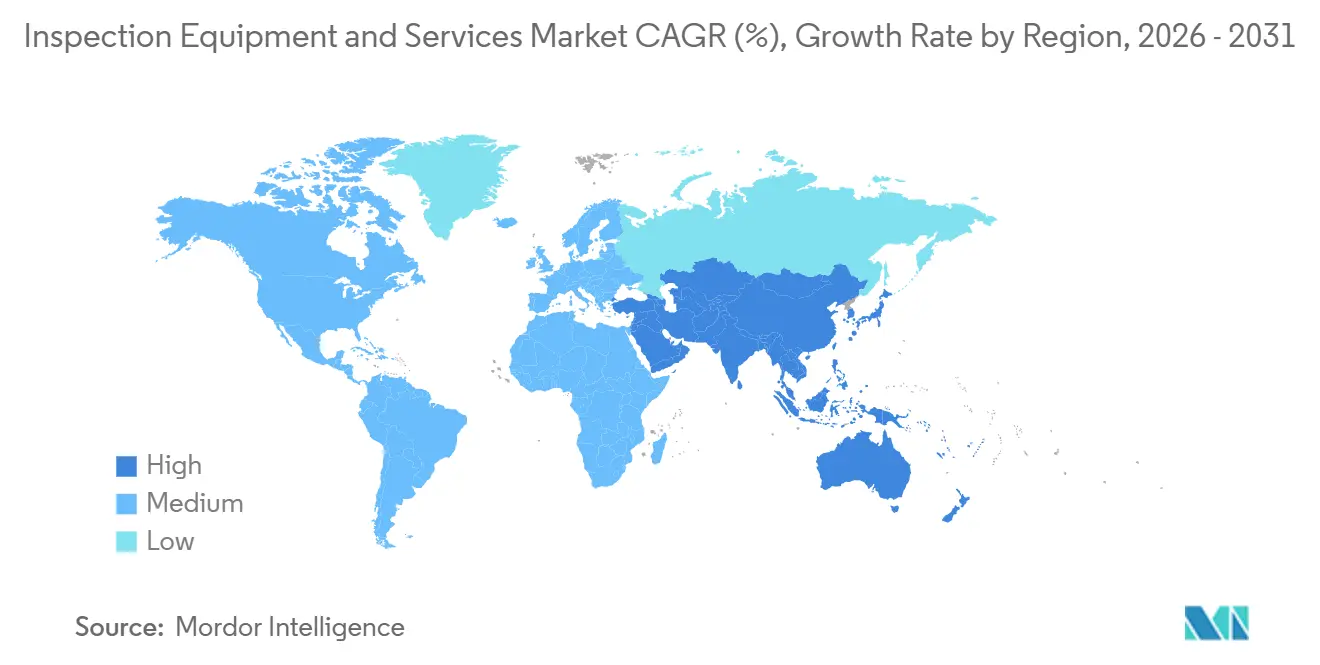
- By geography, Asia-Pacific held 36.14% of revenue in 2025 and is projected to grow at an 11.07% CAGR through 2031 in the inspection equipment and services market.
Note: Market size and forecast figures in this report are generated using Mordor Intelligence’s proprietary estimation framework, updated with the latest available data and insights as of January 2026.
Market Trends and Insights
Drivers Impact Analysis of Inspection Equipment and Services Market*
| DRIVER | (~) % IMPACT ON CAGR FORECAST | GEOGRAPHIC RELEVANCE | IMPACT TIMELINE |
|---|---|---|---|
| Stringent Industrial Safety and Regulatory Compliance Requirements | +1.8% | Global, concentrated in North America, Europe, and Middle East | Short term (≤ 2 years) |
| Aging Industrial Infrastructure and Growing Asset Integrity Management Requirements | +1.5% | North America, Europe, Middle East and Africa | Medium term (2-4 years) |
| Rising Adoption of Automation, Robotics, and AI-Based Inspection Technologies | +1.2% | Asia-Pacific core, spillover to North America and Europe | Medium term (2-4 years) |
| Expansion of High-Value Manufacturing Industries | +0.9% | Asia-Pacific and North America | Long term (≥ 4 years) |
| Increasing Focus on Predictive Maintenance and Digital Asset Management | +0.5% | Global, strongest in Asia-Pacific and North America | Medium term (2-4 years) |
| Growing Investments in Energy and Infrastructure Projects | +0.4% | Middle East, South America, and Asia-Pacific | Long term (≥ 4 years) |
| Source: Mordor Intelligence | |||
Stringent Industrial Safety and Regulatory Compliance Requirements
Safety and compliance requirements are creating immediate demand across the inspection equipment and services market. Updated ASME Section XIII-2025 requirements have increased the importance of digitally traceable inspection and record keeping for pressure-retaining equipment in the United States. Pipeline and Hazardous Materials Safety Administration integrity requirements have been extended to municipal water infrastructure in California and Texas, broadening demand beyond energy assets. European pressure equipment and piping requirements are also supporting the use of phased-array ultrasonics and digital records across industrial facilities. These requirements support equipment suppliers and certified service providers by requiring that inspection processes be documented and repeatable. Once an owner establishes certified baseline documentation, established providers can benefit from higher switching costs and longer contract relationships.
Aging Industrial Infrastructure and Growing Asset Integrity Management Requirements
Aging industrial infrastructure is increasing the number and complexity of assessment activities across the inspection equipment and services market. More than 65% of United States gas transmission pipelines were expected to exceed 40 years of service by 2024, while more than 1,500 North Sea offshore platforms averaged 25 years of age in April 2024. Older assets require more frequent assessments as their condition changes and their remaining operating life becomes harder to manage. The American Society of Civil Engineers linked inspection planning with lifecycle asset management and risk-based scheduling in its July 2025 guidance for waterfront facilities.[1] This approach raises inspection touchpoints over an asset’s life and strengthens demand for risk-based programs. Rehabilitation work also supports the use of ground-penetrating radar and acoustic emission methods, which gives sensor suppliers additional equipment opportunities.
Rising Adoption of Automation, Robotics, and AI-Based Inspection Technologies
Automation, robotics, and AI-based tools are allowing industrial sites to inspect assets that are difficult or unsafe for people to access directly. In February 2026, NTT Group, 1Finity, and Mitsubishi Chemical demonstrated autonomous robot inspection at Japan’s Mizushima Coastal Industrial Zone through a 700-kilometer network connection and a 3D digital twin.[2] The test identified concrete cracks in real time and completed the workflow within 500 milliseconds. Research presented at the 2026 European Conference on Non-Destructive Testing described the use of AI-assisted imaging to identify micro-defects in welds, composites, and additively manufactured structures. These tools can improve image review and record generation while helping technicians assess more assets. Software that integrates multi-sensor data with certified records may shift value from individual site visits to connected inspection workflows.
Expansion of High-Value Manufacturing Industries
Electronics, semiconductor, and battery production are creating a distinct form of demand within the inspection equipment and services market. These facilities need continuous inspection at tight tolerances, which favors automated optical systems, X-ray computed tomography, and electron-beam platforms. Chiplet designs and heterogeneous integration are increasing packaging complexity at foundries in Taiwan and South Korea. This places greater emphasis on metrology, defect detection, and consistent production records. TÜV Rheinland reported EUR 2.98 billion, equivalent to USD 3.22 billion, in fiscal year 2025 revenue and 9.7% year-over-year growth, supported in part by laboratory expansion in China and India. The expansion of laboratory capabilities near manufacturing clusters underscores why providers with advanced materials expertise can contribute to field service activities.
Restraints Impact Analysis of Inspection Equipment and Services Market*
| RESTRAINT | (~) % IMPACT ON CAGR FORECAST | GEOGRAPHIC RELEVANCE | IMPACT TIMELINE |
|---|---|---|---|
| High Capital Investment and Total Cost of Ownership | -0.8% | Global, most acute in emerging Asia-Pacific and South America | Medium term (2-4 years) |
| Shortage of Certified Inspection Professionals | -0.6% | North America and Europe, with growing pressure in Asia-Pacific | Short term (≤ 2 years) |
| Economic Cyclicality of Capital-Intensive Industries | -0.3% | North America and Middle East | Short term (≤ 2 years) |
| Complexity of Integrating Advanced Inspection Technologies | -0.2% | Global | Long term (≥ 4 years) |
| Source: Mordor Intelligence | |||
High Capital Investment and Total Cost of Ownership
High acquisition and operating costs can slow technology adoption, especially among mid-sized asset owners and operators in emerging markets. Industrial computed tomography systems, phased-array ultrasonic platforms, and AI-enabled vision cells can each cost more than USD 500,000. A full deployment at a complex facility can require tens of millions of USD when installation, calibration, and systems integration are included. Recalibration and replacement obligations under ISO 17020 and sector-specific requirements can add 20-30% of the original acquisition cost each year for complex systems. Laboratory-grade instruments costing more than USD 5 million per site can concentrate advanced capabilities within larger service providers that can use them across several customers. Inspection-as-a-service models address this constraint by giving operators access to technology without requiring them to take the full capital risk.
Shortage of Certified Inspection Professionals
The limited supply of qualified inspection professionals can restrict capacity even as demand rises. The ASNT Foundation identified workforce needs as a central issue for the long-term sustainability of non-destructive testing in its 2025 Economic Impact of NDT Report, released in March 2026. The source material identified 150,000 active certified non-destructive testing professionals globally and fewer than 1,200 senior Level III trainers. It also indicated that nearly 47% of certified technicians still needed skill bridging after formal qualification. New Level II certifications in the United States fell 15% in 2024, while demand increased, and 30% of the United States non-destructive testing workforce is expected to retire during the next decade. Remote inspection and AI-assisted defect review can help address the gap, but Level II and Level III qualification still require years of field experience and remain necessary for many critical activities.
*Our forecasts treat driver/restraint impacts as directional, not additive. The impact forecasts reflect baseline growth, mix effects, and variable interactions.
Inspection Equipment and Services Market Segment Analysis
By Offering:
Services Lead While Equipment Adds Connected CapabilitiesInspection services held 66.25% of revenue in 2025 and are projected to grow at a 10.02% CAGR through 2031. The segment’s large position reflects the importance of field expertise, certified judgment, and recurring support across industrial assets. Operating asset inspection, pre-shipment goods and cargo inspection, and new-build and construction inspection create a large share of service activity. Regulatory requirements for third-party verification also support demand across trade, infrastructure commissioning, and industrial operations. Inspection services can create recurring revenue because assets require repeated reviews across their operating lives.
Inspection equipment remains a major contributor through non-destructive testing instruments, remote visual inspection and imaging systems, dimensional measurement tools, and material analysis instruments. Suppliers are adding AI analytics, cloud connectivity, and subscription data management to traditional hardware platforms. These changes can reduce the importance of stand-alone commodity instruments and increase the value of integrated offerings. Hardware performance still matters because accurate measurement, imaging, and repeatable calibration are the basis for reliable inspection outcomes. Customers also need tools that can fit established procedures and personnel qualification requirements.
By Technology:
Non-Contact Methods Gain Use Alongside Established Contact MethodsContact inspection held 58.43% of revenue in 2025. Its leading position is supported by a long-established certification base for ultrasonic testing, eddy current, magnetic particle testing, and liquid penetrant testing. These methods are embedded in API RP 580, ASME boiler and pressure vessel codes, and ISO 9712 personnel qualification requirements. Refining, pipeline, aerospace maintenance, and similar facilities have substantial installed bases that rely on these established procedures. The cost and effort of changing certified workflows slow the replacement of contact methods. Furthermore, portable contact instruments remain relevant because they can be used inside established inspection programs. Battery-powered phased-array units with integrated data management support practical field deployment and preserve an audit trail. Technicians can use these tools in locations where fixed automation is not feasible. Contact methods also remain suited to complex geometries, confined spaces, and environments where a person must assess the result in context. Their role shows that new technology is more likely to extend existing practice than replace it immediately.
Non-contact inspection is projected to expand at a 10.71% CAGR through 2031. The segment uses drone-borne thermal imaging, robotic crawler-mounted phased-array probes, and machine vision to reduce the need for direct physical access. This can avoid scaffolding work that may cost more than the inspection itself at offshore and nuclear sites. Non-contact methods can also reduce personnel exposure in difficult or hazardous locations. Their expanding use is changing the cost structure and pace of inspection work.
By Level of Automation:
Manual Work Remains Important as Fully Automated Systems ExpandManual inspection held 53.88% of revenue in 2025. Field-deployed inspectors remain essential in unstructured and high-hazard environments, including refinery confined spaces, nuclear structures, and subsea pipelines. Current AI systems cannot legally replace Level II or Level III personnel in many workflows under existing qualification requirements. Human judgment is still needed when access is irregular, evidence is uncertain, or the inspection result needs contextual review. This maintains a substantial role for manual inspection despite wider technology adoption.
Fully automated inspection is projected to grow at an 11.13% CAGR through 2031. Lower robotics costs, broader availability of LiDAR and vision sensors, and greater acceptance of AI-supported defect detection are supporting this growth. Automation is especially useful for high-frequency, repeatable tasks in manufacturing and maintenance. It can help providers serve more assets despite the shortage of certified personnel. The inspection equipment and services market benefits when automated systems are deployed at sites with enough asset concentration to support their initial cost. Furthermore, FARO Technologies and Creaform, both AMETEK businesses, combined their operations in January 2026 into FARO CREAFORM for dimensional measurement and FARO INSIGHT for reality capture.[3] The combined platform targets high-throughput metrology for manufacturing and maintenance environments. This type of portfolio combines measurement capability with tools that capture a digital view of the asset. It supports automated workflows where inspections are frequent and the operating environment is controlled.

By End-User Industry:
Oil and Gas Provides the Base While Electronics and Semiconductor Grows FasterOil and gas accounted for 19.93% of revenue in 2025, making it the largest end-user segment. Mandatory integrity management, pipeline corridor inspections, and offshore maintenance support recurring demand. Pressure vessels, heat exchangers, and rotating equipment require repeat inspection under multiyear operating programs. These activities cannot be easily deferred when they are tied to safety and operational requirements. The large installed base keeps oil and gas central to demand even when capital spending is cyclical.
Electronics and semiconductor is projected to grow at a 10.52% CAGR through 2031. Advanced semiconductor production requires defect detection at sub-nanometer scales because wafer yield and chip economics depend on process control. AI chip demand, high-bandwidth memory production, and advanced packaging are increasing the need for detailed inspection activity. Pharmaceuticals and life sciences, food and beverage, and chemicals and petrochemicals also add demand through traceability-sensitive production. FDA 21 CFR Part 11 and ISO 22000 support third-party inspection where records and process controls are important.
Geography Analysis
APAC Inspection Equipment and Services Market
Asia-Pacific held 36.14% of revenue in 2025 and is projected to grow at an 11.07% CAGR through 2031. China’s electronics, battery, and renewable energy manufacturing creates demand across automated optical inspection, semiconductor packaging inspection, and conventional non-destructive testing for wind turbine foundations. India’s semiconductor incentive programs are supporting new manufacturing activity and related demand for inspections. Japan is an early adopter of AI-enabled inspection processes, and TÜV Rheinland issued ISO 42001 AI management system certifications in Japan during 2025. South Korea’s Gyeonggi foundry cluster and packaging sites in Vietnam and Malaysia add demand as production supply chains expand.
North America and Europe Inspection Equipment and Services Market
North America and Europe are important regulatory and technology centers for the inspection equipment and services market. In North America, pipeline integrity programs, lifecycle asset management standards, and federal infrastructure spending support inspection beyond the energy sector. Bridges, tunnels, and waterfront structures add to the range of assets requiring assessment. Europe is supported by the German-speaking testing, inspection, and certification cluster and by requirements such as the Pressure Equipment Directive, ISO 9712, and EN 45011. These rules limit price-based competition by requiring qualified personnel, controlled procedures, and recognized documentation.
MEA and South America Inspection Equipment and Services Market
Middle East and Africa and South America represent different demand settings within the inspection equipment and services market. Saudi Arabia and the United Arab Emirates are adding demand through infrastructure, petrochemical construction, renewable energy commissioning, and conventional oil and gas integrity programs. Mining and metals activity in South Africa and Nigeria requires regular equipment condition assessments under occupational safety requirements. Brazil’s pre-salt deepwater infrastructure supports subsea inspection and corrosion monitoring. Mining activity in Argentina and Chile also requires structural integrity programs across remote operating sites.
Competitive Landscape
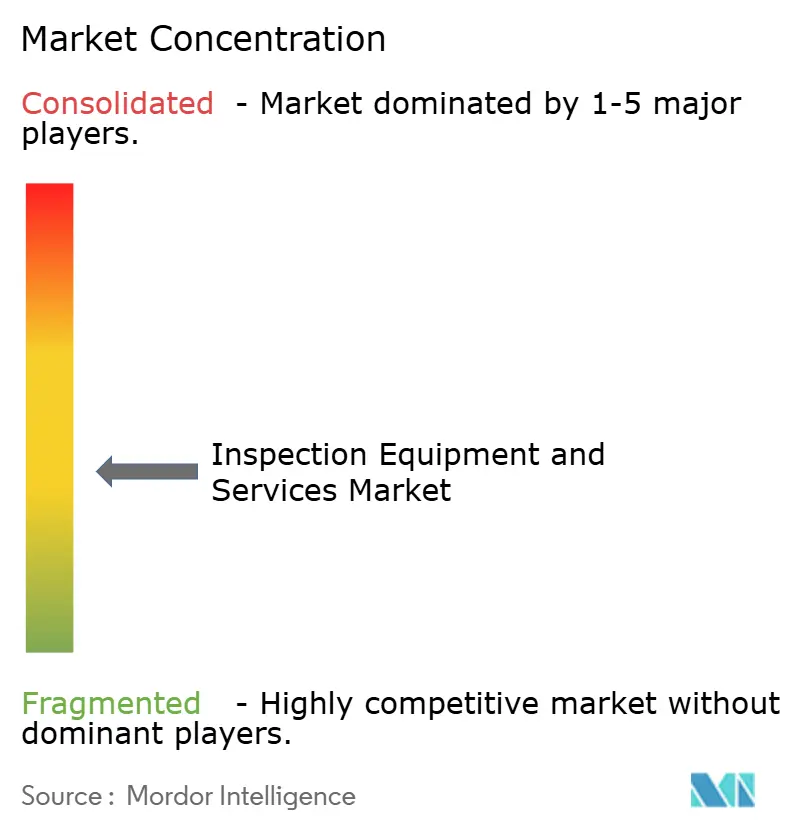
The inspection equipment and services market is moderately fragmented globally. The 5 largest integrated service providers have meaningful but non-dominant combined presence, while regional service firms, equipment specialists, and certification bodies account for a large share of activity. Consolidation is increasing as companies seek broader geographic coverage, greater technological capabilities, and reduced exposure to cyclical end markets. Large providers are also moving toward digital and sustainability-related assurance services. This keeps competition active across both service-delivery and equipment-led technologies.
ESAB completed its acquisition of Eddyfi Technologies in June 2026, adding non-destructive testing instrumentation, remote monitoring, robotics, and inspection software to its portfolio.[4] The acquisition links welding fabrication with structural integrity inspection and allows ESAB to address more of the asset lifecycle. Hexagon’s planned Waygate transaction similarly combines precision measurement with non-destructive testing technologies. SGS closed its acquisition of Applied Technical Services in January 2026, expanding its specialized testing, inspection, calibration, and forensics capabilities in North America. These transactions show how leading companies are building broader portfolios rather than relying on a single inspection method or customer category.
Smaller and mid-sized providers compete through vertical specialization and digital service models. Drone-based aerial inspection, AI-powered vision inspection, and remote condition monitoring are areas where specialized companies can address defined customer needs. MISTRAS reported record adjusted EBITDA of USD 25.8 million in the second quarter of 2026 despite lower oil and gas revenue. Its infrastructure revenue grew 76.5% and aerospace and defense revenue grew 13.2% year over year, showing stronger activity outside the legacy energy base. Predictive maintenance monitoring services that combine continuous sensor data with cloud analytics remain an open area for broader development.
Inspection Equipment and Services Industry Leaders
-
SGS SA
-
Bureau Veritas SA
-
Intertek Group plc
-
TÜV SÜD AG
-
DEKRA SE
- *Disclaimer: Major Players sorted in no particular order
Inspection Equipment and Services Market Companies Covered in this Report
- Bureau Veritas SA
- SGS SA
- Intertek Group plc
- TÜV SÜD AG
- DEKRA SE
- Applus Services, S.A.
- TÜV Rheinland AG
- MISTRAS Group, Inc.
- DNV AS
- Lloyd's Register Group Limited
- ALS Limited
- Hexagon AB
- FARO Technologies, Inc.
- Baker Hughes Company (Waygate Technologies)
- Eddyfi Technologies Inc.
- Zetec, Inc.
- YXLON International GmbH
- Wabtec Corporation (Evident Inspection Technologies)
- Renishaw plc
- Mitutoyo Corporation
Recent Industry Developments in Inspection Equipment and Services Market
- June 2026: ESAB Corporation completed its acquisition of Eddyfi Technologies, a provider of NDT instrumentation, remote monitoring, robotics, and inspection software serving nuclear, aerospace, oil and gas, and civil infrastructure in more than 110 countries, extending ESAB's value proposition into asset lifecycle integrity management.
- June 2026: Ondas Inc. agreed to acquire Cyberhawk, a drone-based critical infrastructure inspection and AI analytics provider, for USD 125 million, positioning Ondas as a data-intelligence-led aerial inspection platform across energy and industrial markets.
- February 2026: NTT Group, 1Finity, and Mitsubishi Chemical demonstrated physical AI-driven autonomous robot inspection at Japan's Mizushima Industrial Zone, with autonomous quadruped robots detecting concrete cracks in real time through a 3D digital twin over a 700-kilometer network link and completing workflows within 500 milliseconds.
- January 2026: FARO Technologies and Creaform, both AMETEK businesses, merged into FARO CREAFORM for dimensional measurement and FARO INSIGHT for reality capture, creating a combined precision inspection platform for manufacturing and maintenance.
Global Inspection Equipment and Services Market Report Scope
The inspection equipment and services market comprises technologies and professional services used to examine, verify, and assess the condition, quality, and conformity of products, assets, infrastructure, and industrial processes. It includes inspection equipment, such as imaging systems, sensors, non-destructive testing (NDT) tools, and automated inspection platforms, along with related inspection and certification services. The market plays a vital role across industries such as manufacturing, oil and gas, construction, transportation, and utilities by supporting operational safety, regulatory compliance, and product quality.
The Inspection Equipment and Services Market Report is Segmented by Offerings (Inspection Equipment [Non-Destructive Testing (NDT) Equipment, Remote Visual Inspection and Imaging Systems, Dimensional Measurement Equipment, Material Analysis Instruments, and Other Equipment], and Inspection Services [Pre-Shipment Goods and Cargo Inspection, New Build and Construction Inspection, Operating Asset Inspection, Vehicle and Equipment Inspection, and Other Inspection Services]), Technology (Contact Inspection, and Non-Contact Inspection), Level of Automation (Manual Inspection, Semi-Automated Inspection, and Fully Automated Inspection), End-User Industry (Oil and Gas, Energy and Utilities, Manufacturing, Automotive and Transportation, Aerospace and Defense, Construction and Infrastructure, Food and Beverage, Pharmaceuticals and Life Sciences, Chemicals and Petrochemicals, Electronics and Semiconductor, Mining and Metals, Marine and Shipbuilding, and Other End-user Industries), and Geography (North America, South America, Europe, Asia-Pacific, and Middle East and Africa). The Market Sizes and Forecasts are Provided in Terms of Value in (USD).
Segmentation Overview
| Inspection Equipment | Non-Destructive Testing (NDT) Equipment |
| Remote Visual Inspection and Imaging Systems | |
| Dimensional Measurement Equipment | |
| Material Analysis Instruments | |
| Other Equipment | |
| Inspection Services | Pre-Shipment Goods and Cargo Inspection |
| New Build and Construction Inspection | |
| Operating Asset Inspection | |
| Vehicle and Equipment Inspection | |
| Other Inspection Services |
| Contact Inspection |
| Non-Contact Inspection |
| Manual Inspection |
| Semi-Automated Inspection |
| Fully Automated Inspection |
| Oil and Gas |
| Energy and Utilities |
| Manufacturing |
| Automotive and Transportation |
| Aerospace and Defense |
| Construction and Infrastructure |
| Food and Beverage |
| Pharmaceuticals and Life Sciences |
| Chemicals and Petrochemicals |
| Electronics and Semiconductor |
| Mining and Metals |
| Marine and Shipbuilding |
| Other End-User Industries |
| North America | United States | |
| Canada | ||
| Mexico | ||
| South America | Brazil | |
| Argentina | ||
| Rest of South America | ||
| Europe | Germany | |
| United Kingdom | ||
| France | ||
| Italy | ||
| Spain | ||
| Rest of Europe | ||
| Asia-Pacific | China | |
| Japan | ||
| India | ||
| South Korea | ||
| ASEAN | ||
| Rest of Asia-Pacific | ||
| Middle East and Africa | Middle East | Saudi Arabia |
| United Arab Emirates | ||
| Turkey | ||
| Rest of the Middle East | ||
| Africa | South Africa | |
| Nigeria | ||
| Rest of Africa | ||
| By Offering | Inspection Equipment | Non-Destructive Testing (NDT) Equipment | |
| Remote Visual Inspection and Imaging Systems | |||
| Dimensional Measurement Equipment | |||
| Material Analysis Instruments | |||
| Other Equipment | |||
| Inspection Services | Pre-Shipment Goods and Cargo Inspection | ||
| New Build and Construction Inspection | |||
| Operating Asset Inspection | |||
| Vehicle and Equipment Inspection | |||
| Other Inspection Services | |||
| By Technology | Contact Inspection | ||
| Non-Contact Inspection | |||
| By Level of Automation | Manual Inspection | ||
| Semi-Automated Inspection | |||
| Fully Automated Inspection | |||
| By End-User Industry | Oil and Gas | ||
| Energy and Utilities | |||
| Manufacturing | |||
| Automotive and Transportation | |||
| Aerospace and Defense | |||
| Construction and Infrastructure | |||
| Food and Beverage | |||
| Pharmaceuticals and Life Sciences | |||
| Chemicals and Petrochemicals | |||
| Electronics and Semiconductor | |||
| Mining and Metals | |||
| Marine and Shipbuilding | |||
| Other End-User Industries | |||
| By Geography | North America | United States | |
| Canada | |||
| Mexico | |||
| South America | Brazil | ||
| Argentina | |||
| Rest of South America | |||
| Europe | Germany | ||
| United Kingdom | |||
| France | |||
| Italy | |||
| Spain | |||
| Rest of Europe | |||
| Asia-Pacific | China | ||
| Japan | |||
| India | |||
| South Korea | |||
| ASEAN | |||
| Rest of Asia-Pacific | |||
| Middle East and Africa | Middle East | Saudi Arabia | |
| United Arab Emirates | |||
| Turkey | |||
| Rest of the Middle East | |||
| Africa | South Africa | ||
| Nigeria | |||
| Rest of Africa | |||
Key Questions Answered in the Report
What is the size of the inspection equipment and services market?
The inspection equipment and services market size is expected to increase from USD 84.86 billion in 2025 to USD 91.28 billion in 2026 and reach USD 135.00 billion by 2031, growing at a CAGR of 8.14% over 2026-2031.
What is driving demand for inspection equipment and services?
Aging industrial assets, safety and compliance requirements, and the adoption of condition monitoring, robotics, and digital inspection records are supporting demand.
Which offering leads inspection equipment and services revenue?
Inspection services led with 66.25% of revenue in 2025 and are projected to grow at a 10.02% CAGR through 2031.
Which inspection technology is growing fastest?
Non-contact inspection is projected to grow at a 10.71% CAGR through 2031, supported by drones, robotic systems, and machine vision.
Which end-user segment is expanding fastest?
Electronics and semiconductor is projected to expand at a 10.52% CAGR through 2031 because advanced production requires detailed process control and defect detection.
Which region leads inspection equipment and services demand?
Asia-Pacific led with 36.14% of revenue in 2025 and is projected to grow at an 11.07% CAGR through 2031.