Infrastructure Construction Market Size and Share
Market Overview
| Study Period | 2020 - 2031 |
|---|---|
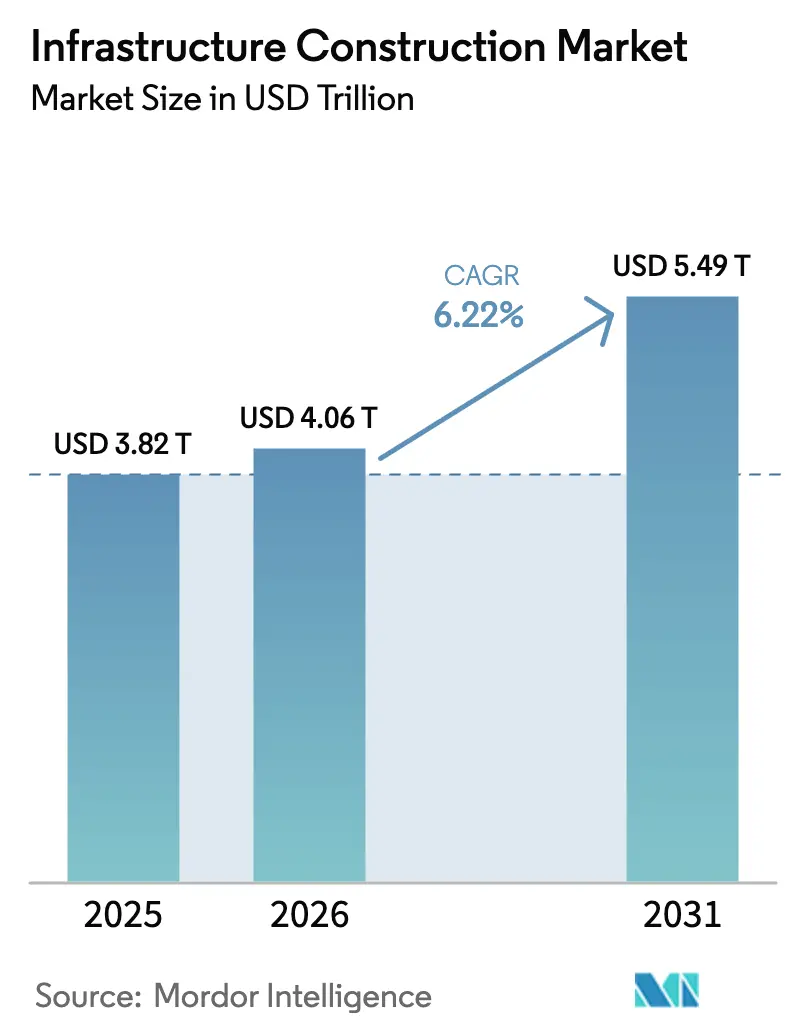
| Market Size (2026) | USD 4.06 Trillion |
| Market Size (2031) | USD 5.49 Trillion |
| Growth Rate (2026 - 2031) | 6.22% CAGR |
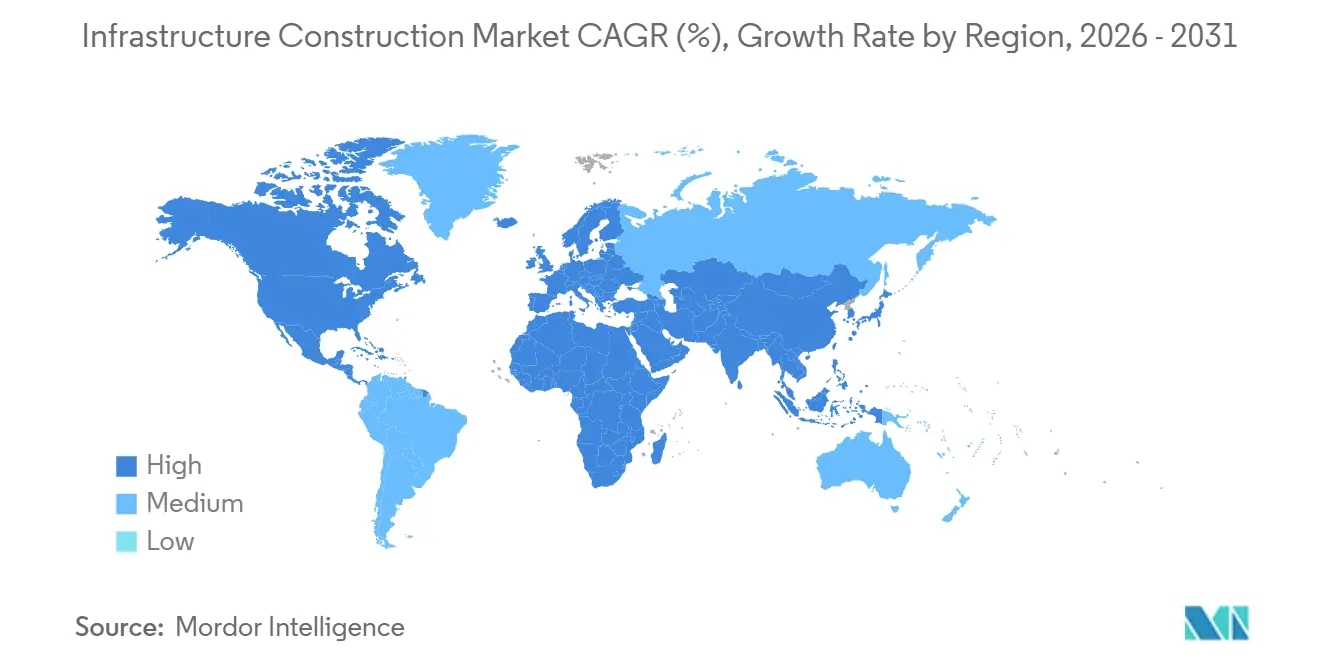
| Fastest Growing Market | Middle East and Africa |
| Largest Market | Asia Pacific |
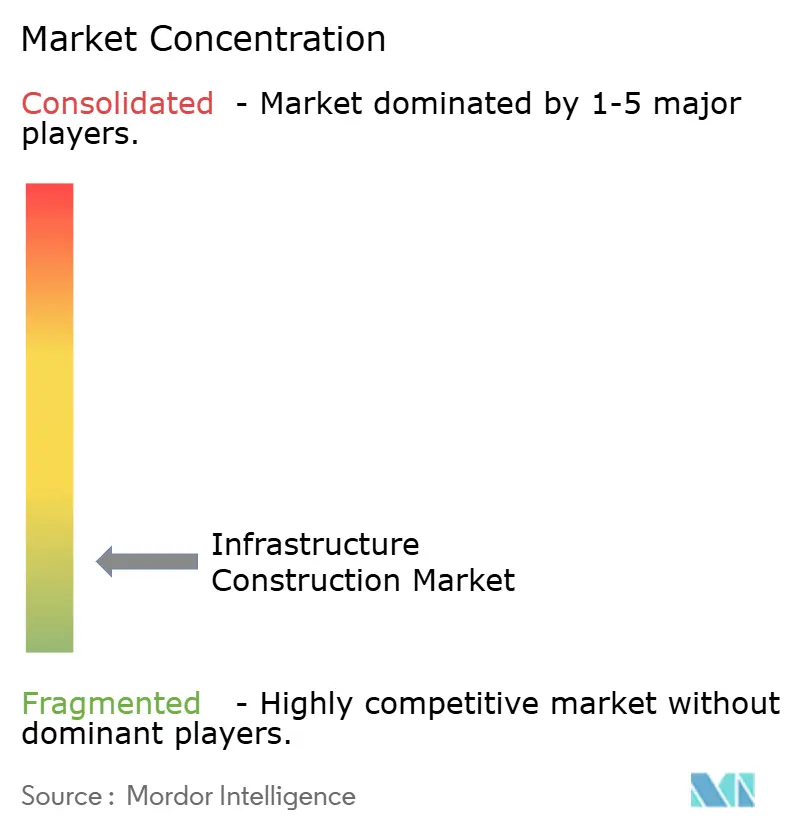
| Market Concentration | Low |
Major Players *Disclaimer: Major Players sorted in no particular order Image © Mordor Intelligence. Reuse requires attribution under CC BY 4.0. | |
Infrastructure Construction Market Analysis by Mordor Intelligence
The Infrastructure Construction Market size is expected to increase from USD 3.82 trillion in 2025 to USD 4.06 trillion in 2026 and reach USD 5.49 trillion by 2031, growing at a CAGR of 6.22% over 2026-2031. Spending is shifting from reactive repairs to proactive renewals as governments embed decarbonization and climate-adaptation goals into national investment plans. Within the infrastructure construction market, transportation projects dominate outlays because electrified rail corridors and automated ports are compressing freight dwell times. Utilities are modernizing aging grids for distributed renewable integration, a trend that is lifting renovation work faster than new-build activity. Private investors are widening their footprint through availability-payment concessions that deliver inflation-linked returns while de-risking traffic volumes.
Key Report Takeaways
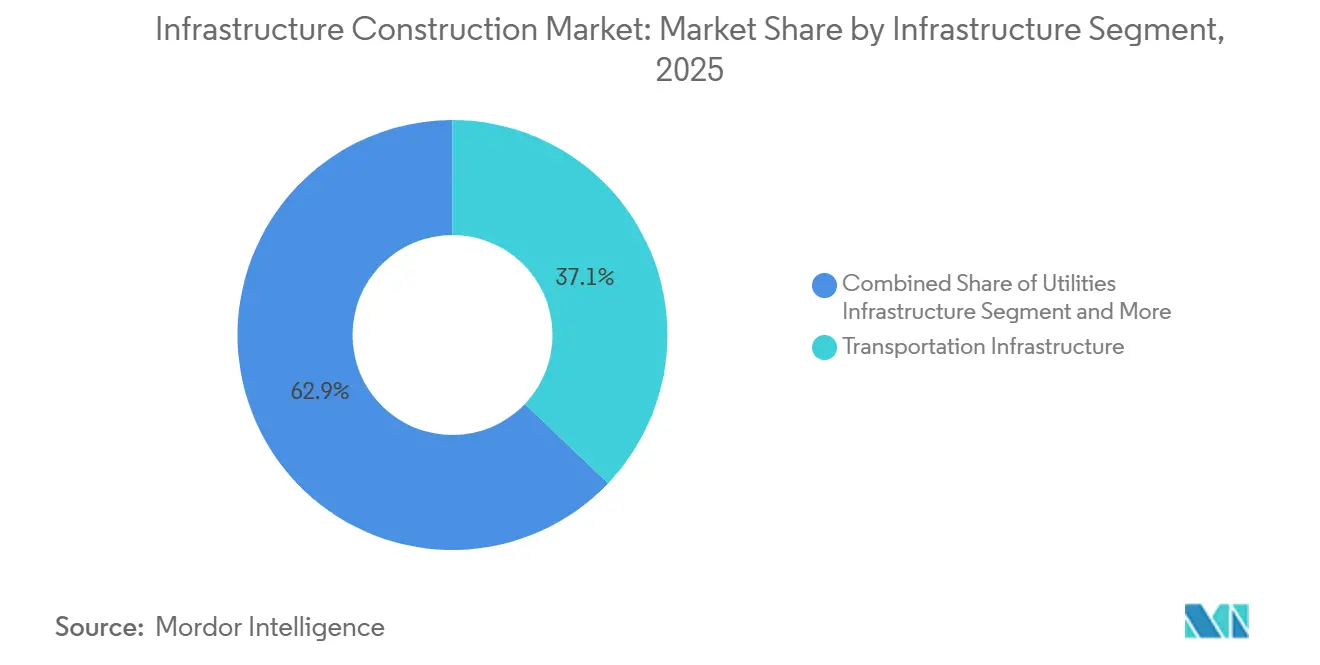
- By infrastructure segment, in the global infrastructure construction market, transportation accounted for 37.1% of revenue in 2025 and is set to grow at a 6.92% CAGR through 2031.
- By construction type, in the global infrastructure construction market, new construction captured a 73.2% share in 2025, while renovation is projected to record the highest 7.02% CAGR to 2031.
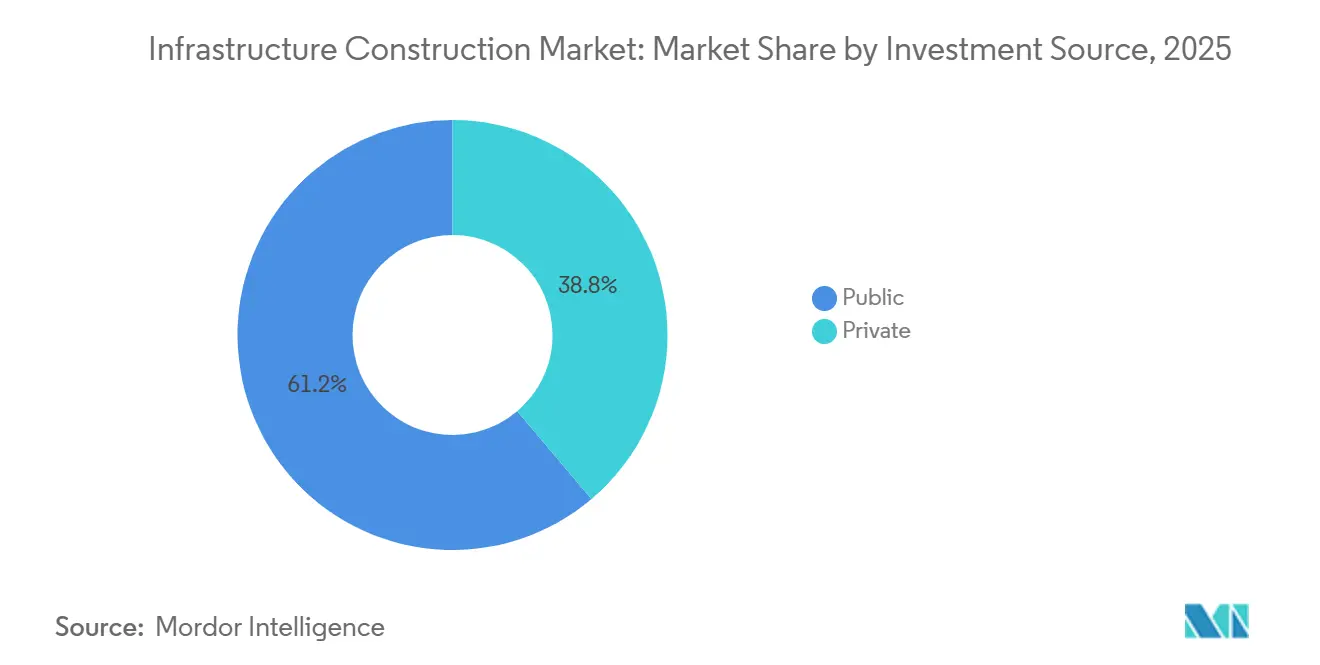
- By investment source, in the global infrastructure construction market, public funding accounted for 61.2% of spending in 2025, whereas private capital is forecast to grow the fastest at a 7.21% CAGR over 2026-2031.
- By geography, in the global infrastructure construction market, Asia-Pacific accounted for a 45.8% share in 2025, and the Middle East & Africa region is predicted to expand at the fastest 7.38% CAGR up to 2031.
Note: Market size and forecast figures in this report are generated using Mordor Intelligence’s proprietary estimation framework, updated with the latest available data and insights as of January 2026.
Global Infrastructure Construction Market Trends and Insights
Drivers Impact Analysis*
| Drivers | (~) % Impact on CAGR Forecast | Geographic Relevance | Impact Timeline |
|---|---|---|---|
| Energy transition spend boosting renewables, grids, storage, and EV-charging builds | +1.8% | Europe, North America, core Asia-Pacific markets | Long term (≥4 years) |
| Public capex, stimulus, and PPPs expanding long-term project pipelines | +1.5% | Global, concentrated in Asia-Pacific and North America | Long term (≥4 years) |
| Aging infrastructure renewal driving upgrades in transport, water, and power assets | +1.2% | North America and Europe, plus Japan and Australia | Medium term (2–4 years) |
| Urban transit and logistics corridor expansion supporting major mobility infrastructure | +1.0% | Asia-Pacific cities, Middle East mega projects, select North American metros | Medium term (2–4 years) |
| Climate-resilience spending increasing flood, coastal, and water-system projects | +0.9% | Coastal regions worldwide, notably Southeast Asia, Caribbean, and U.S. Gulf Coast | Medium term (2–4 years) |
| Source: Mordor Intelligence | |||
Energy Transition Spend Boosting Renewables, Grids, Storage, and EV-Charging Builds
Net-zero pledges are redirecting capital from fossil assets to renewable networks. The International Energy Agency expects annual grid investment to hit USD 600 billion by 2030[1]https://www.iea.org/. Europe has named 166 priority transmission corridors and set aside USD 31 billion in grants through 2027. The United States' planning rule now obliges grid operators to model 20-year electrification scenarios, unlocking new high-voltage lines. Battery storage and fast-charging sites are rising in tandem, helped by a USD 5 billion federal program. Together, these projects form a rapidly growing slice of the infrastructure construction market.
Public Capex, Stimulus, and PPPs Expanding Long-Term Project Pipelines
Five-year and ten-year spending laws now lock infrastructure outlays beyond election cycles. The U.S. Infrastructure Investment and Jobs Act alone adds USD 550 billion of new federal funding through 2028. India’s revised National Infrastructure Pipeline targets USD 1.3 trillion through 2030, with clear allocations for rail, roads, and renewables. Private-public partnerships are also scaling; emerging-market PPP values climbed 22% year on year in 2024. These commitments give contractors multi-year revenue visibility and attract pension funds to the infrastructure construction market.
Aging Infrastructure Renewal Driving Upgrades in Transport, Water, and Power Assets
Many bridges, tunnels, and pipelines built after World War II are now beyond their design life and require full rehabilitation. The American Society of Civil Engineers places the United States' funding gap for these assets at USD 2.6 trillion through 2029. Europe faces similar pressures, with 35% of railway bridges constructed before 1950 requiring load-capacity upgrades[2]https://www.eib.org/. Japan has launched a USD 100 billion program to retrofit tunnels and levees for earthquakes and floods. Contractors who can combine modular components with digital inspection tools are winning work by shortening lane-closure times. As a result, renewal projects are becoming the steady backbone of the infrastructure construction market.
Urban Transit and Logistics Corridor Expansion Supporting Major Mobility Infrastructure
Rapid urbanization is pushing cities to add rail, metro, and port capacity. Southeast Asia alone needs USD 210 billion for urban transport by 2030. India laid 1,200 kilometers of new metro track in 2024-2025 and is on pace to lead global openings by 2027. Europe is upgrading 8,000 kilometers of freight rail to shift cargo off roads. East Coast U.S. ports are deepening their harbors to accommodate larger ships following the Panama Canal expansion. These mobility corridors cut congestion and emissions, reinforcing demand in the infrastructure construction market.
Restraints Impact Analysis*
| Restraints | (~) % Impact on CAGR Forecast | Geographic Relevance | Impact Timeline |
|---|---|---|---|
| Cost inflation, supply volatility, and labor shortages pressuring delivery and margins | -1.2% | Global, acute where labor and materials are tight | Short term (≤2 years) |
| Funding gaps, fiscal pressure, and high rates limiting project affordability | -1.1% | High-debt OECD economies and volatile emerging markets | Short term (≤2 years) |
| Permitting, land acquisition, and regulatory delays slowing execution | -0.8% | North America, Europe, select Asia-Pacific markets | Medium term (2–4 years) |
| Source: Mordor Intelligence | |||
Cost Inflation, Supply Volatility, and Labor Shortages Pressuring Delivery and Margins
Material prices and wages rose faster than contract escalators in 2024. U.S. construction input costs climbed 4.8% year on year, led by diesel and concrete. European labor costs increased by 5.2% as skilled trades aged out faster than replacements entered the workforce. Shipping disruptions pushed the Baltic Dry Index 60% above its 2019 average, delaying steel deliveries. Builders are countering by pursuing vertical integration and modular fabrication; VINCI now completes 18% of projects with prefabricated elements. Still, elevated costs remain a headwind for margins in the infrastructure construction market.
Funding Gaps, Fiscal Pressure, and High Rates Limiting Project Affordability
Rising interest costs shrink the present value of tolls and availability payments. Advanced-economy debt averaged 112% of GDP in 2024, curbing budget flexibility. In the United Kingdom, a USD 10 billion hospital program stalled when long-term gilt yields topped 5%. Several low-income countries now face debt distress that blocks access to concessional loans. Development banks are stepping in with blended-finance structures, but coverage is partial. Until borrowing costs ease, this restraint will weigh on the infrastructure construction market.
*Our forecasts treat driver/restraint impacts as directional, not additive. The impact forecasts reflect baseline growth, mix effects, and variable interactions.
Segment Analysis
By Infrastructure Segment: Transportation Dominates While Utilities Accelerate
Transportation projects controlled 37.1% of the 2025 infrastructure construction market share and remain the revenue anchor for contractors worldwide. Heavy spending on bridge rehabilitation in the United States, cross-border rail under the European TEN-T program, and deep-water port upgrades along the East African coast keep this segment at the front of bid pipelines. Digital signaling and automated container handling are shaving berth and dwell times, allowing owners to charge value-based fees that sustain predictable cash flows. Rising e-commerce volumes and on-time delivery guarantees further lift demand for last-mile road and rail links that bypass inner-city congestion. The segment’s continued upgrade cycle also drives sizable orders for tunneling machines, slab track, and high-capacity cranes, supporting a global supplier base that now includes Chinese and European OEMs.
Over 2026-2031, the utilities sub-segment is projected to post the fastest 6.9% CAGR as grid operators install high-voltage direct-current links that bring offshore wind and desert solar to load centers. North America alone added 23 gigawatts of new transmission capacity in 2024, the strongest annual figure in a decade[3]https://www.energy.gov/. Europe is following with 40,000 kilometers of priority lines backed by EU grants, while Australia is building 5 inter-state “energy highways” that form the backbone of its Renewable Energy Zones. Utilities’ capital plans also include synchronous condensers, grid-scale batteries, and smart-meter rollouts, all of which broaden the revenue pool for electrical contractors. These developments should gradually narrow the gap with transportation, but road, rail, and port work will still command the largest slice of the infrastructure construction market size through 2031.


By Construction Type: New-Build Still Larger, Renovation Grows Quicker
New-build activities represented 73.2% of the 2025 infrastructure construction market share as governments continued to green-light highways, metros, and water-treatment plants on greenfield sites. In India, three entirely new expressways opened in 2024, while Saudi Arabia broke ground on multiple NEOM districts that require fresh utilities and transport grids. Greenfield jobs give contractors latitude in design and sequencing, helping them scale prefab modules and automated earthmoving fleets to protect margins. Financing likewise favors big, visible projects, because multilaterals can bundle them into climate-aligned loan portfolios.
Renovation and upgrade work is advancing at a faster 7% CAGR through 2031 as owners pivot toward life-extension strategies that cost 40–60% less than replacement. Pilot programs in 12 U.S. cities showed trenchless pipe replacement cut disruptions by 80% and slashed schedule overruns. Japan’s expressway operator trimmed unplanned bridge closures by half after embedding fiber-optic sensors, saving USD 2 billion over five years. Municipalities also favor renovation because environmental reviews for existing corridors are simpler, allowing stimulus funds to hit local payrolls within months. Taken together, the mix shift indicates the infrastructure construction market is moving from a “build-and-replace” model toward continuous digital maintenance.
By Investment Source: Public Money Leads, Private Cash Rises
Sovereigns and sub-nationals supplied 61.2% of total capital in 2025, keeping the public purse as the prime mover of the infrastructure construction industry. Multi-year appropriations, such as the USD 550 billion, Canada’s USD 133 billion Investing in Canada plan, and Indonesia’s Nusantara budget, secure predictable work for design-build joint ventures. Public owners also continue to write engineering standards, nudging contractors toward carbon-counting and recycled-material benchmarks now embedded in bid scoring.
Private investment is forecast to rise at a 7.2% CAGR during 2026-2031 as insurers and pension funds chase inflation-linked yields within availability-payment concessions. The United Kingdom’s A14 highway, for example, pays its operator USD 152 million annually for 25 years, fully indexed to consumer prices. India’s Toll-Operate-Transfer bundles drew USD 8 billion in bids over two years, underscoring the appetite for brownfield roads with proven traffic counts. First-loss guarantees under the EU InvestEU window and blended-finance structures at the IFC further tilt the risk-return balance toward private capital. As more jurisdictions cap public debt ratios, private shares should climb steadily, even if the public sector remains the anchor tenant of the infrastructure construction market.
Geography Analysis
Asia-Pacific held 45.8% of the infrastructure construction market share in 2025, underscoring the region’s unrivaled flow of highway, rail, and utility work. India is steering USD 1.3 trillion into its National Infrastructure Pipeline and added 1,200 kilometers of metro track across 18 cities during 2024-2025, putting it on course to top global metro openings by 2027. Indonesia’s Nusantara relocation is attracting USD 33 billion in funding for government buildings, transit, and water networks, slated for delivery by 2029. Meanwhile, Chinese projects still accounted for 28% of global cement consumption in 2024, even as policymakers tightened domestic credit, keeping regional material demand high. The Middle East & Africa infrastructure construction market size is projected to expand at a brisk 7.38% CAGR between 2026 and 2031, led by Saudi Arabia’s USD 500 billion NEOM build-out and Egypt’s enlarged Suez Canal Economic Zone, which added 40,000 hectares and a 2-gigawatt solar park in 2024.
North American growth rests on the U.S. Infrastructure Investment and Jobs Act’s USD 550 billion allocation and Canada’s USD 133 billion Investing in Canada plan, which spans transit, green infrastructure, and rural broadband. The U.S. Department of Energy is channeling USD 12 billion into grid-resilience and battery projects to integrate renewables. Mexico is capitalizing on nearshoring, approving 22 industrial parks worth USD 8 billion that come bundled with rail spurs, port berths, and new truck lanes. Across the Atlantic, the European Union has listed 166 priority transmission corridors and earmarked about USD 32 billion in grants through 2027 to tighten energy security. Germany’s 8-gigawatt North Sea wind awards require 1,200 kilometers of subsea cables and landfall substations priced near USD 20 billion, while the United Kingdom’s HS2 reached 60% completion and is set to cut London–Birmingham travel to 49 minutes by 2029.
South America is turning to concessions to stretch limited budgets; in 2024, Brazil auctioned 18 highway and airport contracts worth USD 24 billion under availability-payment terms. Argentina reignited stalled schemes by dollarizing concession revenue, drawing USD 6 billion of foreign capital into lithium infrastructure and renewable transmission that same year. Even so, the Inter-American Development Bank notes that 40% of regional projects overrun costs by more than 25% due to currency swings, permitting delays, and land-tenure disputes. European investors are seizing opportunities; in February 2026, VINCI bought a 51% stake in a USD 2.3 billion Santiago toll-road concession, locking in 30 years of inflation-indexed availability fees that align with the infrastructure construction market’s tilt toward stable cash flows.
Mordor Intelligence provides coverage of the infrastructure construction market across other key regional markets, including Middle East and Africa, each with their regulatory frameworks and demand patterns. Detailed country-level analysis extends to Saudi Arabia, China, Brazil, and Canada incorporating local coverage and market participation, as required.

Competitive Landscape
In the infrastructure construction market, the top players collectively accounted for revenue, with none achieving a significant share, indicating low market concentration. Chinese state-owned giants such as China State Construction Engineering and China Railway Group dominate on volume, leveraging low-cost project finance from policy banks under the Belt and Road banner. Their bid prices often sit 15% below OECD averages, but thin margins and local-content rules squeeze profitability abroad.
European majors VINCI, ACS, and Ferrovial focus on complex PPPs where operational excellence boosts internal rates of return. VINCI’s concessions arm earned a 12% return on invested capital in 2025 by bundling toll roads across France, the United Kingdom, and Latin America, while Ferrovial spun off its Spanish assets to double down on North American mobility corridors. Technology adoption is the new battleground; firms using AI-based scheduling and 4D building information models report 15–20% schedule compression, thereby reducing exposure to liquidated-damages clauses common in fixed-price contracts.
White-space opportunities are opening in climate-adaptation and critical-mineral logistics. Only 15% of vulnerable shorelines have funded defense projects, leaving a USD 1 trillion gap that mid-tier marine and geotechnical specialists are racing to fill. In parallel, Australia’s eight newly approved lithium and rare-earth mines need 620 kilometers of new rail and two port expansions, drawing interest from Korean and Japanese EPC consortia [4]https://www.industry.gov.au/. Contractors embedding digital-twin services into bids are further differentiating by securing long-term monitoring fees that smooth revenue beyond initial handover.
Infrastructure Construction Industry Leaders
China State Construction Engineering Corp.
China Railway Group Ltd
China Railway Construction Corp
VINCI SA
ACS Group
- *Disclaimer: Major Players sorted in no particular order

Recent Industry Developments
- February 2026: VINCI bought a 51% stake in a USD 2.3 billion Chilean toll road, locking in a 30-year inflation-linked availability contract.
- January 2026: Larsen & Toubro secured a USD 4.8 billion package to lay 420 kilometers of high-speed rail for the Mumbai–Ahmedabad corridor.
- December 2025: Ferrovial and Webuild formed a joint venture for the USD 12 billion Texas High-Speed Rail line.
- November 2025: China State Construction Engineering won a USD 6.2 billion contract to build 1,200 kilometers of high-voltage lines from Ethiopia’s GERD.
- October 2025: Bechtel and Samsung C&T partnered on a USD 15 billion green-hydrogen hub in Saudi Arabia’s NEOM.
- September 2025: Bouygues purchased engineering firm Egis for USD 4.1 billion, adding smart-city and digital-twin expertise.


Global Infrastructure Construction Market Report Scope
Infrastructure construction is the planned construction, maintenance, and upkeep of infrastructure facilities, systems, and services. Building new roads, constructing new power plants, maintaining sewage systems, and providing drinking water to the public are all examples of infrastructure construction.
The study is a comprehensive background analysis of the infrastructure construction market, covering current market trends, restraints, technological updates, and detailed information on segments and the industry's competitive landscape.
The Global Infrastructure Construction Market Report is Segmented by Infrastructure Segment (Transportation, Utilities, Social, Extraction), by Construction Type (New Construction, Renovation), Investment Source (Public, Private), and by Geography (North America, South America, Europe, Middle East and Africa, Asia-Pacific). The Market Forecasts are Provided in Terms of Value (USD).
| Transportation Infrastructure |
| Utilities Infrastructure |
| Social Infrastructure |
| Extraction Infrastructure |
| New Construction |
| Renovation |
| Public |
| Private |
| North America | United States |
| Canada | |
| Mexico | |
| South America | Brazil |
| Argentina | |
| Rest of South America | |
| Europe | United Kingdom |
| Germany | |
| France | |
| Italy | |
| Spain | |
| Rest of Europe | |
| Middle East and Africa | Saudi Arabia |
| United Arab Emirates | |
| Rest of Middle East and Africa | |
| Asia-Pacific | China |
| India | |
| Japan | |
| South Korea | |
| Australia | |
| Indonesia | |
| Rest of Asia-Pacific |
| By Infrastructure Segment | Transportation Infrastructure | |
| Utilities Infrastructure | ||
| Social Infrastructure | ||
| Extraction Infrastructure | ||
| By Construction Type | New Construction | |
| Renovation | ||
| By Investment Source | Public | |
| Private | ||
| By Geography | North America | United States |
| Canada | ||
| Mexico | ||
| South America | Brazil | |
| Argentina | ||
| Rest of South America | ||
| Europe | United Kingdom | |
| Germany | ||
| France | ||
| Italy | ||
| Spain | ||
| Rest of Europe | ||
| Middle East and Africa | Saudi Arabia | |
| United Arab Emirates | ||
| Rest of Middle East and Africa | ||
| Asia-Pacific | China | |
| India | ||
| Japan | ||
| South Korea | ||
| Australia | ||
| Indonesia | ||
| Rest of Asia-Pacific | ||


Key Questions Answered in the Report
How large is global infrastructure construction spending today and where is it heading by 2031?
Outlays reached USD 4.06 trillion in 2026 and are projected to climb to USD 5.49 trillion by 2031 on a 6.22% CAGR.
Which project type is expanding the fastest?
Grid, storage, and EV-charging work inside the utilities segment is paced to grow at about 6.9% a year through 2031, outpacing roads and ports.
Why are renovation projects gaining importance?
Owners save 40–60% versus new builds, environmental reviews are shorter, and digital sensors now guide “repair-before-fail” programs that stretch asset life.
What share of funding comes from the private sector?
Private capital supplied roughly 39% of 2024 spending and is forecast to rise at 7.2% annually as availability-payment concessions attract pension funds.
Which region offers the fastest growth opportunity up to 2031?
The Middle East & Africa region is expected to expand at about 7.4% a year, led by Saudi Arabia’s NEOM build-out and African cross-border transport corridors.
How are contractors defending margins against cost inflation?
Leaders rely on modular fabrication, AI-based scheduling, and vertical integration; VINCI, for example, finished 18% of its 2025 jobs with prefab elements that cut on-site labor 30%.
Page last updated on:


