Indonesia Silver Market Size and Share
Market Overview
| Study Period | 2021 - 2031 |
|---|---|
| Forecast Data Period | 2026 - 2031 |
| Historical Data Period | 2021 - 2024 |
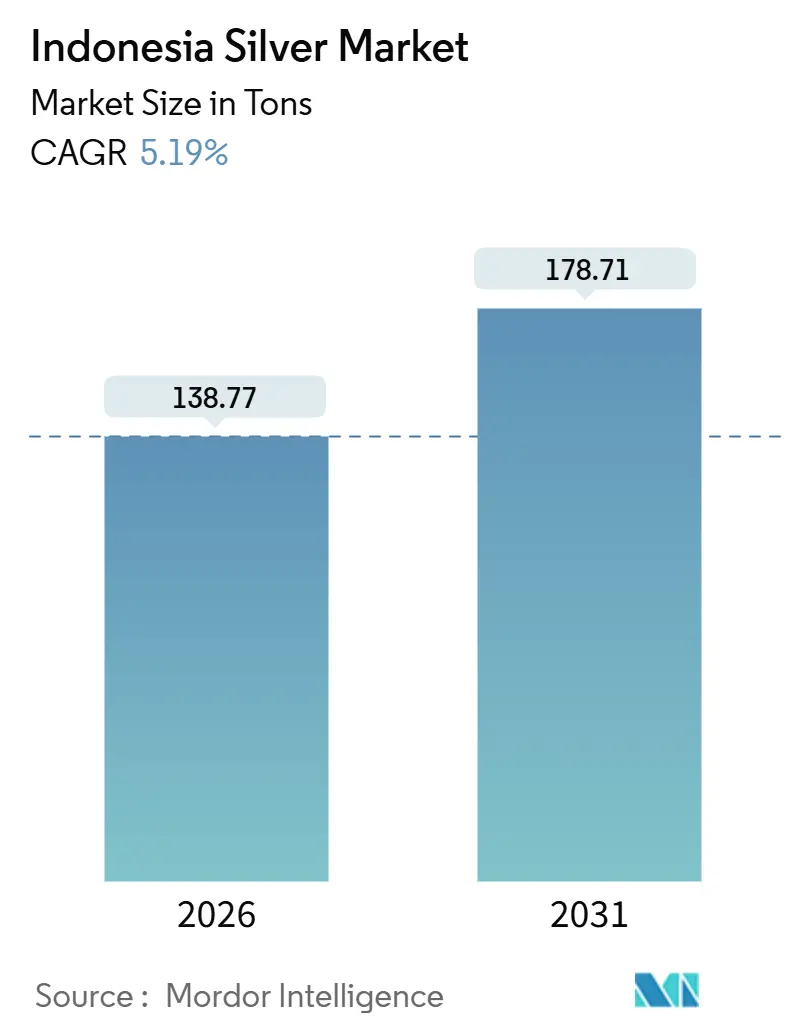
| Market Volume (2026) | 138.77 tons |
| Market Volume (2031) | 178.71 tons |
| Growth Rate (2026 - 2031) | 5.19% CAGR |
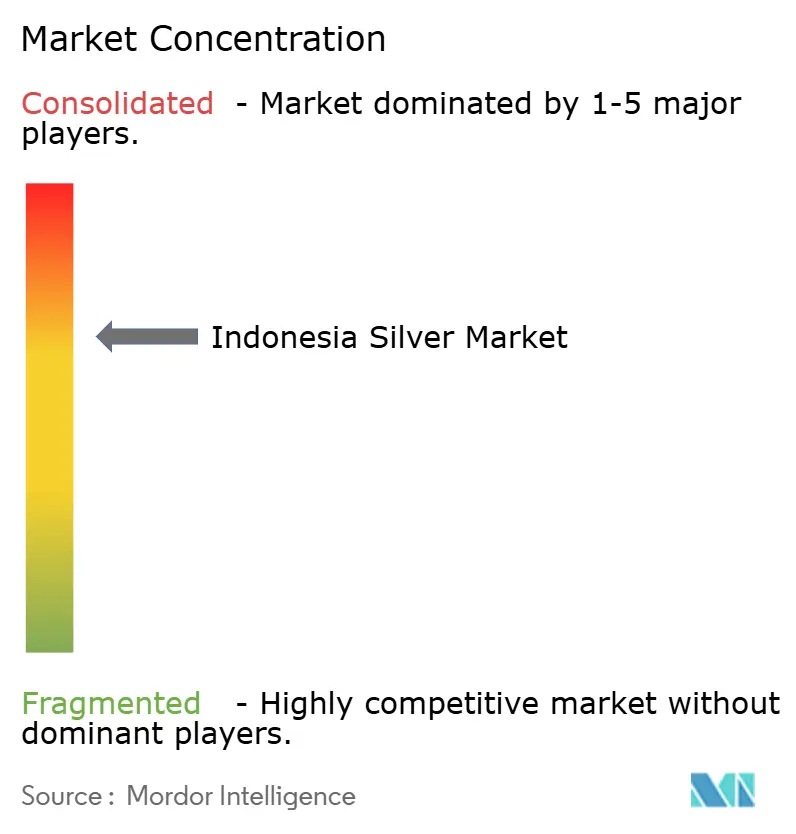
| Market Concentration | Medium |
Major Players *Disclaimer: Major Players sorted in no particular order Image © Mordor Intelligence. Reuse requires attribution under CC BY 4.0. | |
Indonesia Silver Market Analysis by Mordor Intelligence
The Indonesian Silver Market size is estimated at 138.77 tons in 2026, and is expected to reach 178.71 tons by 2031, at a CAGR of 5.19% during the forecast period (2026-2031). Current growth rests on three pillars, namely expanding electronics fabrication in Java, accelerating photovoltaic deployment nationwide, and the country’s mandatory downstream-processing rules that channel by-product silver into local refineries. Moderate structural deficit in global supply, persistent since 2014, keeps domestic realized prices firm even as mine output moves with copper-gold production cycles. Indonesia’s sovereign wealth fund continues to finance energy-transition infrastructure that intensifies industrial silver demand, while the 2025 monetary-easing cycle lowers the cost of smelter expansions. Competitive dynamics stay shaped by six large miners that focus on copper-gold but deliver silver as a secondary metal, creating a supply profile that is relatively inelastic to price signals.
Key Report Takeaways
- By form, Silver Powder and Nitrate captured 25.83% of the Indonesian silver market share in 2025 and is expanding at a 5.44% CAGR to 2031.
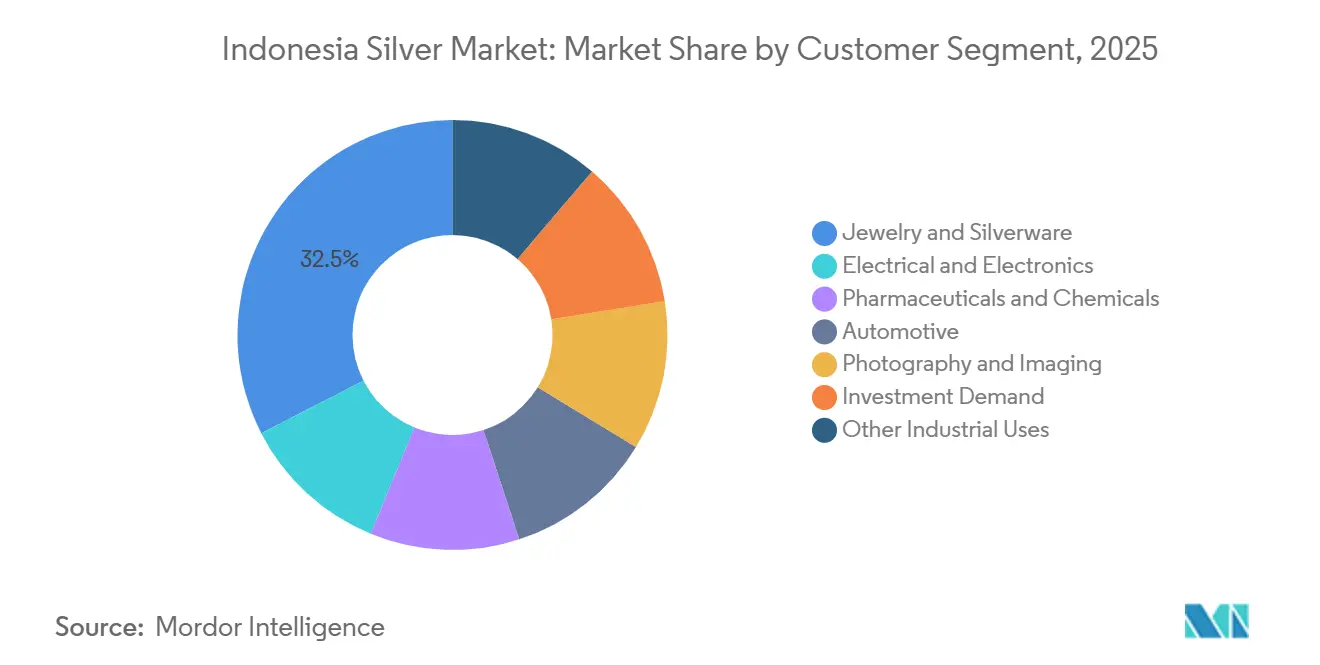
- By customer segment, Jewelry and Silverware led with a 32.54% contribution to the Indonesian silver market size in 2025, while Electrical and Electronics is the fastest-growing at 6.90% CAGR through 2031.
- By geography, Java accounted for 28.24% of the Indonesian silver market size in 2025 and is advancing at a 5.47% CAGR through 2031.
Note: Market size and forecast figures in this report are generated using Mordor Intelligence’s proprietary estimation framework, updated with the latest available data and insights as of January 2026.
Worldwide, activity is shaped by contributions from multiple countries and regions, with Indonesia representing one among them. The global report on silver market by Mordor Intelligence reflects how these countries and regional layers combine into a single system.
Indonesia Silver Market Trends and Insights
Drivers Impact Analysis*
| Drivers | (~) % Impact on CAGR Forecast | Geographic Relevance | Impact Timeline |
|---|---|---|---|
| Increased jewelry demand | +0.8% | Java, Bali, Sumatra export corridors | Medium term (2-4 years) |
| Rising industrial usage in electronics and PV | +1.5% | Java (Gresik–Surabaya), Sumatra, Kalimantan solar parks | Long term (≥ 4 years) |
| Government downstream-processing incentives | +1.2% | Nationwide; early impact in Gresik smelter and eastern mining provinces | Medium term (2-4 years) |
| EV-battery supply-chain localization push | +0.9% | Java and Sumatra battery clusters, nationwide charging roll-out | Long term (≥ 4 years) |
| Digital-payment–led bullion micro-investment | +0.3% | Urban Java financial hubs | Short term (≤ 2 years) |
| Source: Mordor Intelligence | |||
Increased Jewelry Demand
Indonesia exported jewelry worth billions in 2023, ranking eleventh globally and underscoring a deep cultural preference for precious-metal adornments. Silver jewelry holds strong domestic appeal, especially from Bali’s artisanal workshops, and wedding seasons create recurring demand spikes. Household surveys show families owned precious jewelry, supporting a steady retail base. Retail transactions still occur mainly in physical outlets, which account for the majority of sales, leaving significant headroom for online channels to develop. Moderate real-wage growth and rebounding tourism keep jewelry fabrication volumes on an upward trajectory through 2028 before stabilizing. The driver adds an estimated 0.8 percentage points to the headline CAGR as better logistics and design innovation lift turnover in Java-based export hubs.
Rising Industrial Usage in Electronics and Photovoltaics
In 2025, industrial applications accounted for a significant portion of global silver consumption, a notable increase from a decade prior. This trend is mirrored in Indonesia's silver market. The Gresik–Surabaya corridor in Java has become a hub for new semiconductor packaging plants. These plants, which integrate multilayer ceramic capacitors and printed-circuit-board lines, have a heightened demand for high-purity silver paste. As the nation boosts its solar capacity, the demand for conductive inks surges. Furthermore, government tender documents emphasize local-content rules, promoting domestic silver sourcing. With recent investment commitments, battery-electric-vehicle production is on the rise. This sector's reliance on the metal's conductivity, especially in power electronics and high-current connectors, amplifies silver's significance. Collectively, the electronics, photovoltaic (PV), and automotive sectors are projected to elevate industrial silver consumption, a trend expected to persist well beyond 2031.
Government Downstream-Processing Incentives
In 2014, Indonesia enacted a law requiring all precious-metal concentrates to be refined domestically to a minimum purity of 99%, echoing its prior nickel strategy. Commissioned in September 2024, PT Freeport Indonesia’s Gresik complex processes copper concentrate annually, yielding refined silver. This facility doubled the nation's refining capacity and curtailed export leakage. The Ministry of Energy and Mineral Resources sets monthly benchmark prices, ensuring fiscal transparency. Additionally, a production royalty incentivizes higher recovery rates. PT ANTAM’s offtake agreements for a segment of the refined output bolster local supply chains and diminish dependence on foreign toll refiners. Collectively, these measures are projected to boost Indonesia's silver market growth in the medium term, as smelter utilization approaches its maximum capacity.
EV-Battery Supply-Chain Localization Push
Indonesia, leading Southeast Asia, is at the forefront of the region's electric vehicle (EV) investment surge. The country is also home to several gigafactory projects, driving up silver consumption in battery-management systems and fast-charging stations[1]Organisation for Economic Co-operation and Development, “Indonesia Economic Outlook 2025,” OECD.ORG. Notably, electric vehicles utilize significantly more silver than their internal-combustion counterparts, especially in components like busbars, relays, and DC-fast-charging connectors. Government initiatives, including zero import tariffs on EV components and VAT rebates for domestically produced batteries, are propelling this growth. Additionally, as data centers expand to oversee fleet telematics, the demand for silver rises further, driven by needs in server connectors and cooling assemblies. Altogether, localization efforts add an extra 0.9 percentage points to the Indonesian silver market CAGR over a long-term horizon.
Restraints Impact Analysis*
| Restraints | (~) % Impact on CAGR Forecast | Geographic Relevance | Impact Timeline |
|---|---|---|---|
| Environmental compliance costs | −0.6% | Papua Tengah, Nusa Tenggara Barat, Sumatra mines; Gresik smelter catchment | Medium term (2-4 years) |
| Illegal and artisanal mining loss | −0.9% | Kalimantan, Sulawesi, remote Sumatra artisanal clusters | Long term (≥ 4 years) |
| Foreign-investment divestment rule | −0.5% | Nationwide IUP/IUPK holders; heightened in Papua Tengah and Nusa Tenggara Barat | Medium term (2-4 years) |
| Source: Mordor Intelligence | |||
Environmental Compliance Costs
Recent ministerial regulations have tightened discharge and reclamation requirements. As a result, operators are setting aside funds for post-closure activities. At Grasberg and Batu Hijau, declining ore grades are increasing throughput needs. This, in turn, is inflating tailings volumes and raising energy consumption for each ounce of silver produced. An incident at PT Freeport Indonesia’s smelter in October 2024 delayed the full ramp-up to late 2025. This underscores the interplay between compliance and operational risks in curbing supply. Extended-producer-responsibility policies in electronics manufacturing will further raise recycling overheads, trimming market CAGR by an estimated 0.6 percentage points over the medium term.
Illegal And Artisanal Mining Losses
Informal handlers, lacking efficient extraction technologies, manage most of the nation's e-waste, resulting in significant losses of silver[2]Tri Nugroho et al., “Material Losses in Indonesia’s Informal E-waste Sector,” Journal of Sustainable Materials, RESEARCHGATE.NET . In Kalimantan and Sulawesi, artisanal operations, using rudimentary methods, process low-grade ore and sidestep royalty payments, skewing official supply statistics. While government efforts to consolidate revoked licenses under PT Perminas aim to formalize some of this output, enforcing these measures is challenged by the region's remote terrain. Lost metal and environmental harm together subtract about 0.9 percentage points from the long-term CAGR.
*Our forecasts treat driver/restraint impacts as directional, not additive. The impact forecasts reflect baseline growth, mix effects, and variable interactions.
Segment Analysis
By Form: Industrial Derivatives Outpace Bullion
Silver Powder and Nitrate held 25.83% of the Indonesian silver market share in 2025 and is growing at a 5.44% CAGR, the highest within forms. Electronics assemblers in Java rely on powder for capacitors and for photovoltaic paste used in front-side metallization, anchoring demand visibility. The Indonesian silver market size for fine, 99.9%-purity material feeds these powders, and refined volumes will follow the new Gresik smelter’s ramp-up curve. Bars, coins, and bullion remain an investment niche, hampered by limited retail distribution outside gold-focused outlets. Other forms—foils, wires, flakes—benefit from small but rising adoption in flexible displays and medical devices, yet their aggregate remains below 10 percent of volume. The market’s derivative-heavy tilt underscores why industrial growth, rather than investment sentiment, is the main volume driver through 2031.
Fine Silver commands stable but slower growth as refiners prioritize powder conversion to capture higher margins. Bars and Coins see even lower velocity because digital finance apps have not yet positioned silver products prominently. Structural supply rigidity underlines why industrial users increasingly secure long-term offtake agreements directly with smelters to manage continuity.


By Customer Segment: Electronics Surge Challenges Jewelry Dominance
Jewelry and Silverware retained 32.54% of the Indonesian silver market size in 2025, yet its CAGR trails industrial counterparts. The Electrical and Electronics segment, in contrast, expands at a 6.90% CAGR on the back of semiconductor packaging plants, data-center roll-outs, and the EV component ecosystem. Automotive applications embed more silver per unit and are scaling from a small base, giving them an outsized growth rate even if absolute tonnage remains moderate until the second half of the forecast horizon.
Pharmaceuticals and Chemicals maintain a niche demand for silver nitrate used in antimicrobial applications, supported by local university research and development programs targeting green nanoparticle synthesis. Photography and Imaging stay in terminal decline, replaced by digital modalities, though specialized medical film keeps a residual market. Investment Demand shows the slowest expansion, reflecting consumers’ preference for gold and regulatory hurdles surrounding the introduction of silver-backed retail products. Over time, electronics are set to eclipse jewelry as the single largest consumer, altering seasonality patterns that historically followed holiday and wedding cycles.
Geography Analysis
Java generated 28.24% of the Indonesian silver market size in 2025 and is projected to grow at a 5.47% CAGR to 2031. The island is home to a major refinery, numerous electronics manufacturing hubs, and the country's most concentrated e-waste infrastructure. Export data highlights Jawa Barat and Jawa Timur as leading provinces, playing a pivotal role in jewelry exports. The region's value-chain activities are further bolstered by the rise of digital finance and government-led initiatives for formal e-waste collection points.
Sumatra's silver market is driven by a prominent mine, which processed substantial amounts of ore in 2025, yielding significant silver output. Established logistics corridors seamlessly connect the mine's output to a refining network. With continued investment in smelter adjacency, there's potential for increased local refining margins. However, risks loom due to uncertainties surrounding license consolidation.
Kalimantan and Sulawesi, while contributing smaller tonnages, face unique challenges. High levels of artisanal activity obscure statistical clarity, but regional efforts to formalize mining could tap into additional volumes. Papua Tengah and Nusa Tenggara Barat dominate in supplying mined concentrates, but their limited local refining capacity necessitates transport to Java. Policy trends hint at future smelter constructions closer to mining sites, suggesting a potential eastward shift in value addition. Bali's silver consumption, primarily driven by jewelry and closely tied to tourism trends, contrasts with the rest of Indonesia segment, which is witnessing nascent recycling projects. These initiatives might decentralize supply flows, especially under extended-producer-responsibility mandates.
Competitive Landscape
The Indonesian silver market is moderately consolidated. All treat silver as a secondary metal. PT Freeport Indonesia’s new Gresik complex is a structural inflection point, capturing downstream margins once realized offshore and signaling greater state alignment with value-addition objectives. An unplanned fire during commissioning delayed full throughput, providing a temporary advantage to rival concentrate exporters but ultimately reinforcing the strategic merit of domestic refining. Advanced sensor-based ore sorting and AI-guided processing remain largely absent, offering operational levers for cost reduction that could shift unit economics when silver prices plateau.
Indonesia Silver Industry Leaders
PT Freeport Indonesia
PT ANTAM Tbk
PT Amman Mineral Internasional Tbk
PT Merdeka Copper Gold Tbk
PT Agincourt Resources
- *Disclaimer: Major Players sorted in no particular order

Recent Industry Developments
- December 2025: PT Aneka Tambang Tbk (Antam) reduced silver prices by IDR 200 per gram, reflecting ongoing volatility in the domestic precious metals market. This decline, noted across various sizes, coincides with global economic and monetary policy uncertainties impacting commodity prices.
- September 2024: PT Freeport Indonesia's Gresik smelter, inaugurated by President Joko Widodo on September 23, 2024, began producing silver bullion as part of its domestic mining downstreaming efforts. The company also had a target of 441 thousand tons of copper cathode production by 2025.


Indonesia Silver Market Report Scope
Silver, a precious transition metal, boasts a brilliant white metallic luster and is renowned for its high ductility and malleability. It stands out as the metal with the highest electrical and thermal conductivity, as well as reflectivity. While traditionally associated with jewelry, investment, and currency, silver consumption is now funneled into industrial applications.
The Indonesian silver market is segmented by form, customer segment, and geography. By Form, the market is segmented into silver granules, silver bars, silver coins and bullion, fine silver, silver powder and nitrate, and other forms (foils, wire, flakes, etc.). By Customer Segment, the market is segmented into electrical and electronics, jewelry and silverware, pharmaceuticals and chemicals, automotive, photography and imaging, investment demand (coins, bullion), and other industrial uses. The report also covers the market size and forecasts in 4 regions of the country. For each segment, the market sizing and forecasts have been done on the basis of volume (Tons).
| Silver Granules |
| Silver Bars |
| Silver Coins and Bullion |
| Fine Silver |
| Silver Powder and Nitrate |
| Other Forms (Foils, Wire, Flakes, etc.) |
| Electrical and Electronics |
| Jewelry and Silverware |
| Pharmaceuticals and Chemicals |
| Automotive |
| Photography and Imaging |
| Investment Demand (Coins, Bullion) |
| Other Industrial Uses |
| Java |
| Sumatra |
| Kalimantan (Borneo) |
| Sulawesi |
| Bali |
| Nusa Tenggara |
| Rest of Indonesia |
| By Form | Silver Granules |
| Silver Bars | |
| Silver Coins and Bullion | |
| Fine Silver | |
| Silver Powder and Nitrate | |
| Other Forms (Foils, Wire, Flakes, etc.) | |
| By Customer Segment | Electrical and Electronics |
| Jewelry and Silverware | |
| Pharmaceuticals and Chemicals | |
| Automotive | |
| Photography and Imaging | |
| Investment Demand (Coins, Bullion) | |
| Other Industrial Uses | |
| By Geography | Java |
| Sumatra | |
| Kalimantan (Borneo) | |
| Sulawesi | |
| Bali | |
| Nusa Tenggara | |
| Rest of Indonesia |


Key Questions Answered in the Report
What is the forecast volume for the Indonesian silver market in 2031?
The Indonesian silver market is projected to reach 178.71 tons by 2031, advancing at a 5.19% CAGR, from 138.77 tons in 2026.
Which form category grows the fastest through 2031?
Silver Powder and Nitrate lead growth at a 5.44% CAGR owing to rising electronics and photovoltaic demand.
Which customer segment is set to overtake jewelry consumption?
Electrical and Electronics, expanding at a 6.90% CAGR, is expected to surpass jewelry as the top consumer before the end of the forecast period.
Why does Java dominate Indonesia’s silver supply chain?
Java hosts the Gresik refinery, major electronics clusters, and the densest e-waste facilities, securing 28.24% market share in 2025.
How do government policies influence domestic silver refining?
A mandate requiring 99% purity before export and the addition of the Gresik smelter nearly doubled Indonesia’s refining capacity, anchoring more value onshore.
Page last updated on:


