India Global Capability Centers Market Size and Share
Market Overview
| Study Period | 2019 - 2030 |
|---|---|
| Forecast Data Period | 2025 - 2030 |
| Historical Data Period | 2019 - 2023 |
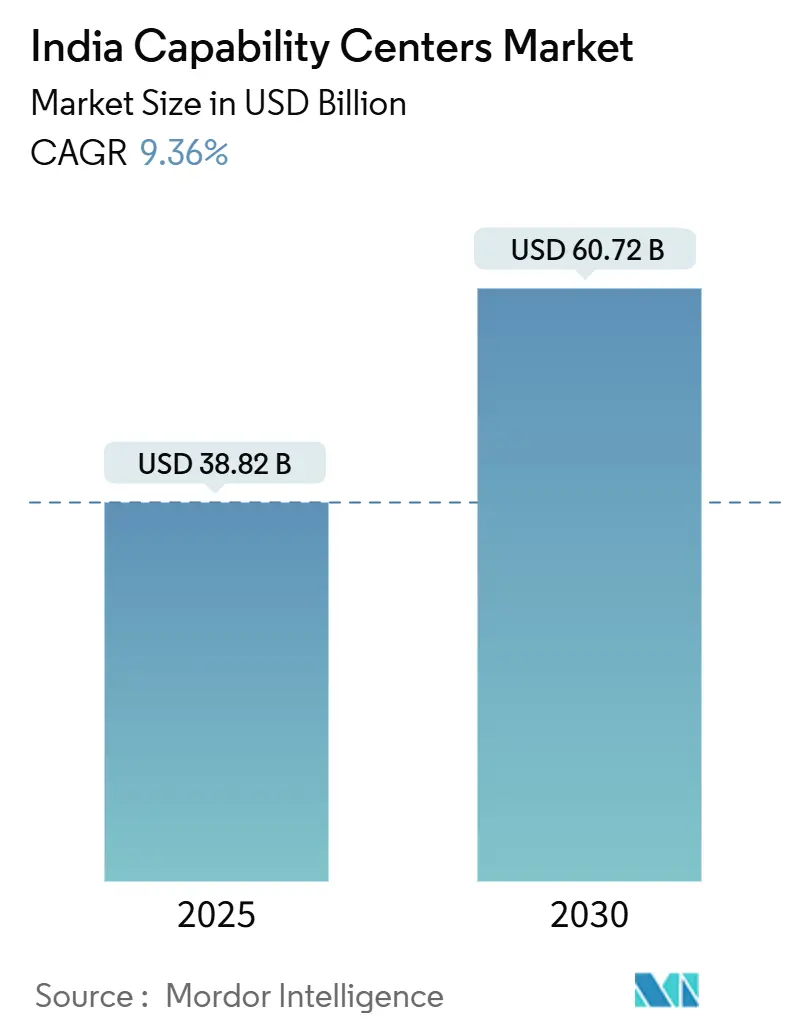
| Market Size (2025) | USD 38.82 Billion |
| Market Size (2030) | USD 60.72 Billion |
| Growth Rate (2025 - 2030) | 9.36% CAGR |
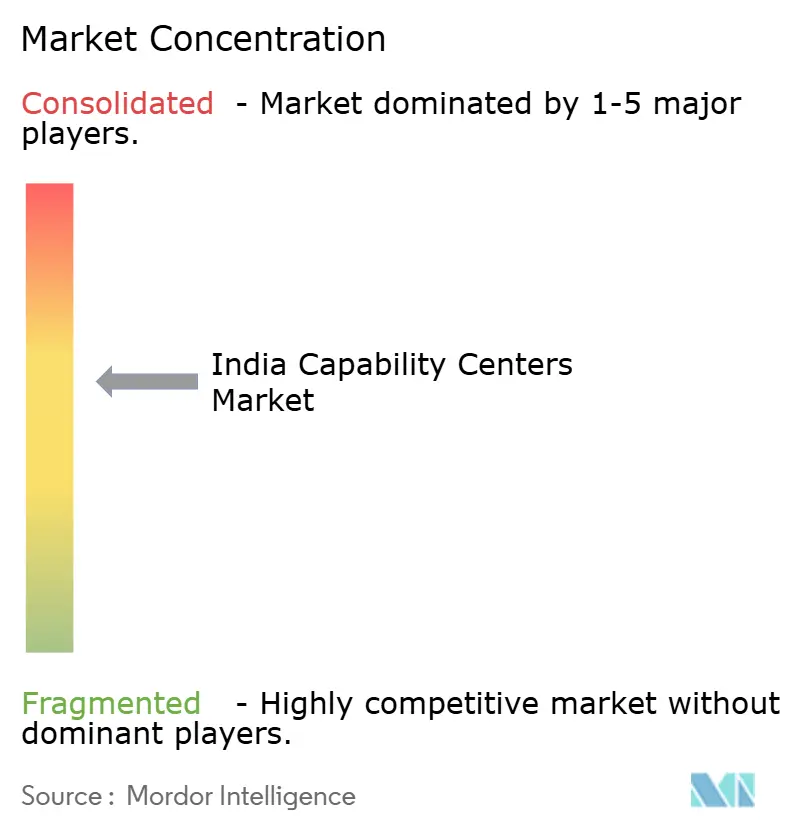
| Market Concentration | Medium |
Major Players *Disclaimer: Major Players sorted in no particular order Image © Mordor Intelligence. Reuse requires attribution under CC BY 4.0. | |
India Global Capability Centers Market Analysis by Mordor Intelligence
The Indian Global Capability Centers market size is estimated at USD 38.82 billion in 2025 and is projected to reach USD 60.72 billion by 2030, representing an annual CAGR of 9.36% during the forecast period. Growth momentum stems from India’s shift from cost–centric outsourcing to innovation-led value creation, supported by 1,700 active centers and a 1.9 million-strong workforce. Multinational corporations view India as a digital talent hub, citing a 55% share of the global workforce in emerging technologies.[1]Business Standard Staff, “India’s Global Capability Center Ecosystem to Reach USD 100 Billion by 2030,” business-standard.com Information Technology and Digital Services lead capability adoption as 90% of centers plan near-term AI integration. The progression to Tier-II cities adds geographic diversity, cost optimization, and fresh talent streams, while government incentives and liberalized FDI policies continue to streamline entry for new investors.
Key Report Takeaways
- By function, Information Technology and Digital Services held a 59.37% market share of the Indian Global Capability Centers market in 2024 and is projected to grow at a 9.58% CAGR through 2030.
- By engagement model, the Captive approach commanded a 57.38% revenue share in 2024, while the Hybrid Build-Operate-Transfer model is poised for the fastest growth, with a 10.58% CAGR to 2030.
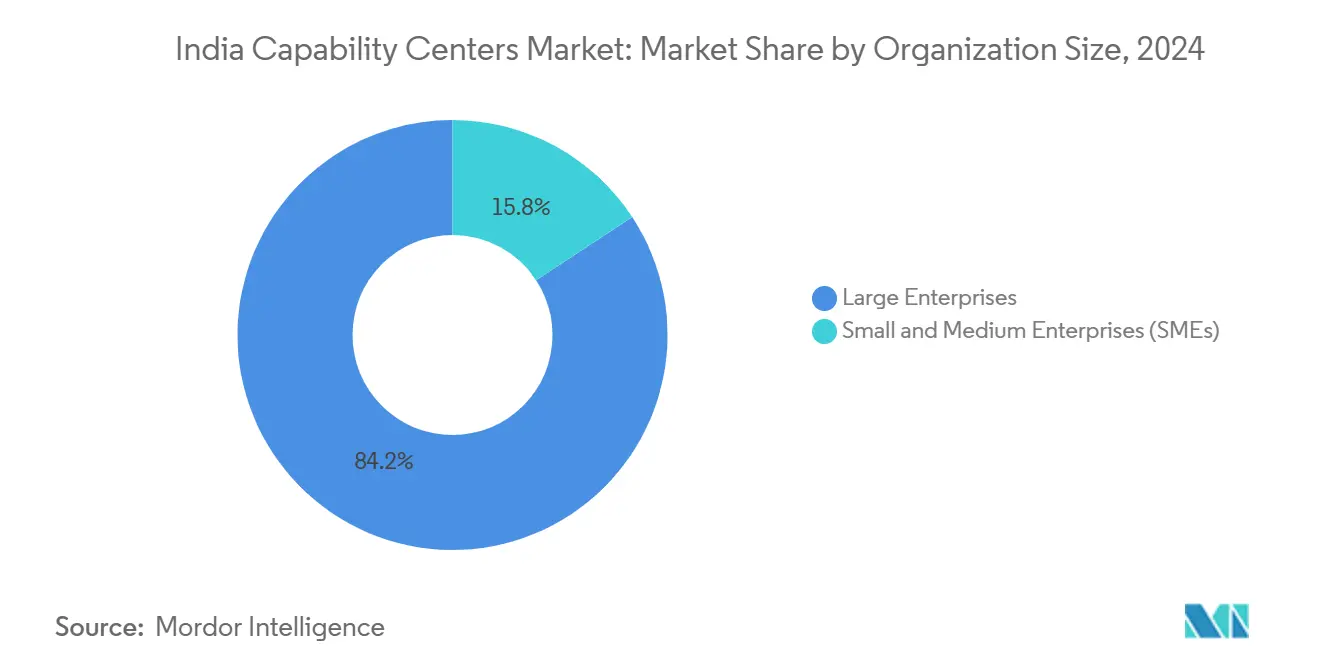
- By organization size, large enterprises controlled 84.24% of the 2024 value, whereas Small and Medium Enterprises are set to expand at an 11.33% CAGR during the forecast window.
- By industry vertical, the Banking, Financial Services, and Insurance sector is forecast to rise at a 10.11% CAGR to 2030, outpacing the Telecom and IT sector’s 36.27% share in 2024.
India Global Capability Centers Market Trends and Insights
Drivers Impact Analysis*
| Driver | (~) % Impact on CAGR Forecast | Geographic Relevance | Impact Timeline |
|---|---|---|---|
| Abundant digitally-skilled talent pipeline | +2.1% | National, concentrated in Bangalore, Hyderabad, Chennai | Long term (≥ 4 years) |
| Cost arbitrage and competitive salary levels | +1.8% | National, with the highest impact in Tier-II cities | Medium term (2-4 years) |
| Government incentives and liberalized FDI policies | +1.5% | National, state-specific variations | Short term (≤ 2 years) |
| Rapid adoption of emerging tech (AI/ML - Cloud) | +2.3% | National, led by metropolitan hubs | Medium term (2-4 years) |
| Rise of Build-Operate-Transfer providers enabling speed-to-market | +1.2% | National, concentrated in established Global Capability Center hubs | Short term (≤ 2 years) |
| Tier-II city infrastructure upgrades, lowering real-estate costs, and attrition | +1.4% | Tier-II cities: Pune, Ahmedabad, Coimbatore, Jaipur | Long term (≥ 4 years) |
| Source: Mordor Intelligence | |||
Abundant Digitally-Skilled Talent Pipeline
India produces approximately 4.3 million STEM graduates annually, accounting for 55% of the global emerging-tech talent.[2]Ministry of Education, “All India Survey on Higher Education 2019-20,” education.gov.in Coding instruction mandated from grade 6 under the National Education Policy will sustain this advantage over the next decade. Nearly 70% of centers intend to integrate advanced AI by 2026, accelerating demand for niche skills that conventional outsourcing cannot satisfy. India now hosts 12% of the global population of Generative AI specialists, reinforcing its appeal for frontier research. Corporate universities and partnerships with IITs further narrow capability gaps and secure long-run differentiation.
Rapid Adoption of Emerging Tech
Ninety percent of centers plan to deploy AI-ML within three years, surpassing the global average of 65%. Cloud maturity, coupled with AI democratization, has trimmed time-to-market for digital solutions by 40-60% among leading facilities. AI-enabled centers generate 25-35% higher revenue per employee compared to traditional delivery models. Large-scale infrastructure, such as G42’s USD 3.2 billion AI-ready data centers, bolsters advanced workloads. Eighty-five percent of new centers leverage cloud-native development, ensuring rapid scalability and seamless global integration.
Government Incentives and Liberalized FDI Policies
FDI in computer software and hardware climbed to USD 15.67 billion in FY 2023-24 after procedural simplification. The USD 1.2 billion Production Linked Incentive for IT hardware is encouraging firms to co-locate R&D and manufacturing, forming integrated value chains. Fifteen states now operate dedicated Global Capability Center policies, offering land, power subsidies, and expedited clearances, which cut setup times by up to one year. Complete FDI relaxation in single-brand retail permits consumer goods majors to unify tech development and market operations under one roof. The Digital Personal Data Protection Act provides legal clarity, reassuring multinationals on data governance.
Cost Arbitrage and Competitive Salary Levels
Even with a 10-15% annual wage escalation, India retains a 40-50% total cost edge over developed markets. Tier-II cities unlock a further 20-30% saving on operating expenses while sustaining talent quality through upgraded education infrastructure. Senior technologists earn 35-45% of equivalent U.S. compensation, and their productivity often outperforms that of global peers due to process automation.[3]Mercer Research, “US 2024 Total Remuneration Survey,” mercer.com Hybrid Build-Operate-Transfer contracts stabilize initial cost exposure and enable later insourcing at optimized spend levels. Real estate prices have plateaued in large metropolitan areas, while continuing to decline in secondary cities, thereby enhancing overall arbitrage.
Restraints Impact Analysis*
| Restraint | (~) % Impact on CAGR Forecast | Geographic Relevance | Impact Timeline |
|---|---|---|---|
| Wage inflation and high attrition in tech roles | -1.8% | National, the highest in Bangalore, Pune, Hyderabad | Short term (≤ 2 years) |
| Regulatory complexity around tax and data privacy | -1.2% | National, with state-specific variations | Medium term (2-4 years) |
| Overdependence on single-country delivery risk for global parents | -0.9% | National, affecting all Global Capability Center operations | Long term (≥ 4 years) |
| Short supply of niche GenAI and quantum-tech specialists | -1.4% | National, concentrated in tier-1 cities | Medium term (2-4 years) |
| Source: Mordor Intelligence | |||
Wage Inflation and High Attrition in Tech Roles
Technology salaries increase by 10-15% each year, and attrition rates range from 15-25%, exceeding the sustainable 8-12% range. Specialized AI and cloud roles command premiums of 40-60%, creating bidding wars that erode arbitrage opportunities. Attrition-driven replacement can cost up to twice the annual salary, considering the expenses of recruiting, onboarding, and productivity lags. Geographic clustering in the Bangalore-Hyderabad-Chennai triangle fuels localized scarcity. Gig platforms and remote work increase talent mobility, forcing Global Capability Centers to create flexible engagement models.
Regulatory Complexity Around Tax and Data Privacy
Complying with the Digital Personal Data Protection Act raises operational spend by 8-12%, as centers recruit Data Protection Officers and deploy consent systems.[4]Ministry of Electronics and Information Technology, “Digital Personal Data Protection Act 2023,” meity.gov.in Cross-border data controls require local hosting, with initial compliance costs ranging from USD 2 million to USD 5 million for large players. Tax administration varies by jurisdiction, resulting in an additional 3-5% overhead for specialized legal management. Ambiguity in the Goods and Services Tax treatment of intangible exports complicates pricing for parent companies. Compliance resourcing now accounts for 5-8% of operational budgets, compared to 2-3% in mature regimes.
*Our forecasts treat driver/restraint impacts as directional, not additive. The impact forecasts reflect baseline growth, mix effects, and variable interactions.
Segment Analysis
By Function / Capability – IT Services Anchor Digital Transformation
Information Technology and Digital Services controlled 59.37% of the 2024 value and is growing at a 9.58% pace, giving the segment unrivaled leadership within the Indian Global Capability Centers market. The surge reflects a strategic shift from routine application maintenance to cloud-native product engineering and platform modernization, which multinational businesses now view as core to their competitiveness. Centers devoted to artificial intelligence, machine learning, and DevSecOps methodologies already reach 85% penetration among IT-focused facilities, compared with 45% for other functions. Revenue per employee lifts sharply once AI frameworks mature, reinforcing reinvestment into deeper innovation stacks.
Engineering and R&D remains the second-largest cluster, drawing automotive and aerospace majors that leverage India’s talent density in simulation, embedded systems, and lightweight materials. In parallel, Business Process Management integrates robotic process automation, while Knowledge Process Outsourcing evolves toward complex analytics. These changes broaden the India Global Capability Centers' market addressable scope and reduce dependence on pure-play cost arbitrage. The Ministry of Electronics and Information Technology's ethics guidelines inform trustworthy AI-first design principles, positioning India as a long-term partner for responsible innovation.


By Engagement Model – Hybrid BOT Gains Momentum
Captive operations accounted for 57.38% of the 2024 value, yet the Hybrid Build-Operate-Transfer model is on track for a 10.58% CAGR, signaling a fresh route into the Indian Global Capability Centers market. Hybrid structures allow firms to benefit from turnkey ramp-up, mature processes, and early cost certainty, then assume full control once the local unit stabilizes. The average setup can be closed within nine months, compared to the typical eighteen-month window for greenfield captives.
Specialized BOT providers mitigate the transition risk by bundling real estate, recruitment, and compliance services under service-level agreements. Enterprises in regulated domains, such as BFSI, appreciate the staged approach, as it meets stringent governance requirements without compromising strategic autonomy. The model also accelerates entry into Tier II cities, where providers have established supplier networks and municipal contacts. Collectively, captive and hybrid formations now account for more than 70% of new deals, reshaping the competitive landscape across the Indian Global Capability Centers industry.
By Organization Size – SMEs Fuel the Next Wave
Large Enterprises held 84.24% of 2024 spend, underscoring their long-standing influence in the Indian Global Capability Centers market. However, Small and Medium Enterprises are forecast to rise at an annual rate of 11.33% through 2030, as cloud and software-as-a-service offerings lower upfront capital requirements. Government export ambitions of USD 1 trillion add impetus by providing fiscal incentives and simplified export credit lines.
SMEs typically adopt a targeted capability approach, focusing on sales enablement, digital commerce, or analytics rather than end-to-end operations. The Build-Operate-Transfer path is especially attractive, as it frees up limited internal resources until scale justifies direct management. Production Linked Incentive grants for manufacturing firms additionally level the playing field, inviting traditional producers to embed tech teams inside integrated plants. Over time, SME participation is expected to diversify the Indian Global Capability Centers market’s client base and expand the depth of innovation.
By Industry Vertical – BFSI Leads in Growth Velocity
Telecom and IT retained the largest 36.27% share in 2024; however, Banking, Financial Services, and Insurance is on track for a 10.11% CAGR and is expected to deliver the strongest contribution to additional value creation across the Indian Global Capability Centers market. Banks expand local footprints to build advanced risk engines, real-time payments, and personalized wealth platforms that regulatory modernization now allows. Fintech co-innovation further magnifies the appeal, making India a hotbed for open-banking proof-of-concepts.
Healthcare and Life Sciences continue to scale through clinical data management and drug design, while Manufacturing clusters around automotive electrification and resilient supply-chain analytics. Retail and Consumer Goods entities invest heavily in direct-to-consumer optimization, driven by firms such as Walmart, which aims to achieve USD 10 billion in annual exports by 2027. This multi-industry participation expands resilience and deepens the Indian Global Capability Centers market ecosystem.
Geography Analysis
The Bangalore-Hyderabad corridor hosts nearly 45% of total Global Capability Center employment, leveraging decades-old technology ecosystems and significant venture capital linkages. Hyderabad stands out as a hub for cloud infrastructure and cybersecurity, thanks to landmark state programs like T-Hub, which foster collaboration among startups. Chennai specializes in automotive and healthcare research, extending traditional manufacturing skill bases into digital twin development.
The National Capital Region remains a magnet for financial services due to its proximity to regulations, although Mumbai’s share is slipping amid real estate constraints. Pune represents the archetype Tier-II success story, delivering 25-30% cost savings and easy access to Mumbai’s talent overflow. Ahmedabad benefits from Gujarat’s chemical and pharmaceutical heritage, while Coimbatore and Jaipur split attention between industrial IoT and process automation.
Uniform broadband rollouts under the Digital India mission mitigate location disadvantages and broaden the Indian Global Capability Centers market reach. State-level incentive races intensify, with Karnataka, Telangana, and Tamil Nadu tailoring packages that compress ramp-up timelines. Aggregate Global Capability Center office leasing has surpassed 53 million square feet since 2022, equivalent to roughly 40% of nationwide commercial demand, indicating a strong landlord preference for long-term corporate tenancies.
Competitive Landscape
The Indian Global Capability Centers market shows moderate fragmentation. Technology leaders, such as Microsoft, Amazon, and Google, are expanding their footprints to capture AI engineering and cloud-platform mandates. Concurrently, JPMorgan Chase and Goldman Sachs expand their operations to drive algorithmic trading and compliance technology, underscoring BFSI’s emphasis on high-value analytics.
Strategic focus now tilts toward depth rather than breadth, with centers of excellence in quantum computing, responsible AI, and sustainable tech commanding board-level attention. Build-Operate-Transfer (BOT) specialists, such as ANSR and Deloitte, equip mid-market players with turnkey scale-up models, adding competitive intensity. Regulatory requirements surrounding data privacy create opportunities for providers to bundle compliance tooling into service catalogs, giving first movers a competitive advantage in regulated sectors.
White-space technology domains, such as advanced materials and climate tech, remain underexplored, offering growth lanes for both incumbents and entrants alike. Tier-II city expansion redistributes wage pools and moderates attrition, yet also forces enterprises to master distributed work orchestration. Overall, leadership depends less on sheer headcount and more on owning differentiated intellectual property, making capability maturity the new battleground across the Indian Global Capability Centers industry.
India Global Capability Centers Industry Leaders
Microsoft Corporation India Pvt Ltd
Amazon Development Center India Pvt Ltd
Google India Digital Services Pvt Ltd
Cisco Systems India Pvt Ltd
JPMorgan Chase Services India Pvt Ltd
- *Disclaimer: Major Players sorted in no particular order

Recent Industry Developments
- October 2025: Sanofi committed EUR 400 million (USD 450 million) for a Hyderabad center focused on pharmaceutical R&D and digital health solutions.
- September 2025: G42 allocated USD 3.2 billion for AI-ready data centers supporting Global Capability Center machine-learning workloads.
- August 2025: Microsoft invested USD 2.1 billion to launch new cloud and AI facilities in Pune and Ahmedabad.
- July 2025: Walmart set a goal of USD 10 billion annual exports by 2027, expanding technology teams in Bangalore and Tier-II locations.


India Global Capability Centers Market Report Scope
The scope of the global capability center study for the market segmentation by the Function/Capability for (i) Information Technology (IT) and Digital Services segment is limited to Software Development, Cloud and Infrastructure Management, Cybersecurity, Data Analytics and AI/ML; (ii) Engineering / ER&D segment is limited to Product Design and Testing, Embedded Systems, Digital Twin / Simulation; (iii) Business Process Management (BPM) segment is limited to Finance and Accounting, HR, Payroll and Talent Management, Procurement, Customer Service; and (iv)Knowledge Process Outsourcing (KPO) segment is limited to Market Research and Insights, Risk and Compliance, Legal and Regulatory Support, Strategy and Consulting Support. Similarly, for segmentation by the Engagement Model, scope for (i) Hybrid Build-Operate-Transfer (BOT) is limited to Joint Venture / Strategic Partnership and Virtual Captive Model. The rest of the segment scope is as specified for the listed segment.
| Information Technology (IT) and Digital Services |
| Engineering / ER&D |
| Business Process Management (BPM) |
| Knowledge Process Outsourcing (KPO) |
| Captive (Self-Build)/In-house |
| Build-Operate-Transfer (BOT) |
| Hybrid Build-Operate-Transfer (BOT) |
| Large Enterprises |
| Small and Medium Enterprises (SMEs) |
| Banking, Financial Services, and Insurance (BFSI) |
| Telecom and IT |
| Healthcare and Life Sciences |
| Manufacturing, Automotive and Industrial |
| Retail and Consumer Goods |
| Other Industry Verticals |
| By Function / Capability | Information Technology (IT) and Digital Services |
| Engineering / ER&D | |
| Business Process Management (BPM) | |
| Knowledge Process Outsourcing (KPO) | |
| By Engagement Model | Captive (Self-Build)/In-house |
| Build-Operate-Transfer (BOT) | |
| Hybrid Build-Operate-Transfer (BOT) | |
| By Organization Size | Large Enterprises |
| Small and Medium Enterprises (SMEs) | |
| By Industry Vertical | Banking, Financial Services, and Insurance (BFSI) |
| Telecom and IT | |
| Healthcare and Life Sciences | |
| Manufacturing, Automotive and Industrial | |
| Retail and Consumer Goods | |
| Other Industry Verticals |


Key Questions Answered in the Report
What is the current valuation of the India Global Capability Centers market?
The market is valued at USD 38.82 billion in 2025 and is projected to reach USD 60.72 billion by 2030, growing at a 9.36% CAGR.
Which function leads spending within Indian Global Capability Centers?
Information Technology and Digital Services account for 59.37% of the 2024 value and remain the fastest-growing segment, with a 9.58% CAGR through 2030.
Why are Tier-II cities gaining traction for Global Capability Center expansions?
Secondary cities, such as Pune and Ahmedabad, offer 20-30% lower operating costs, rising infrastructure quality, and a fresh talent pool.
How fast are Small and Medium Enterprises adopting Global Capability Center models?
SMEs are expected to expand their participation at an 11.33% CAGR between 2025 and 2030, enabled by cloud platforms and government export incentives.
Which industry vertical is forecast to grow the quickest?
The banking, Financial Services, and Insurance Sector is poised for the strongest 10.11% CAGR through 2030, driven by fintech and regulatory modernization.
What major risk could slow future Global Capability Center growth in India?
Sustained wage inflation and attrition, currently at 10-15% and 15-25% respectively, may erode cost advantages if unaddressed.
Page last updated on:


