Inactivated Vaccines Market Size and Share
Market Overview
| Study Period | 2020 - 2031 |
|---|---|
| Market Size (2026) | USD 21.47 Billion |
| Market Size (2031) | USD 36.25 Billion |
| Growth Rate (2026 - 2031) | 9.12% CAGR |
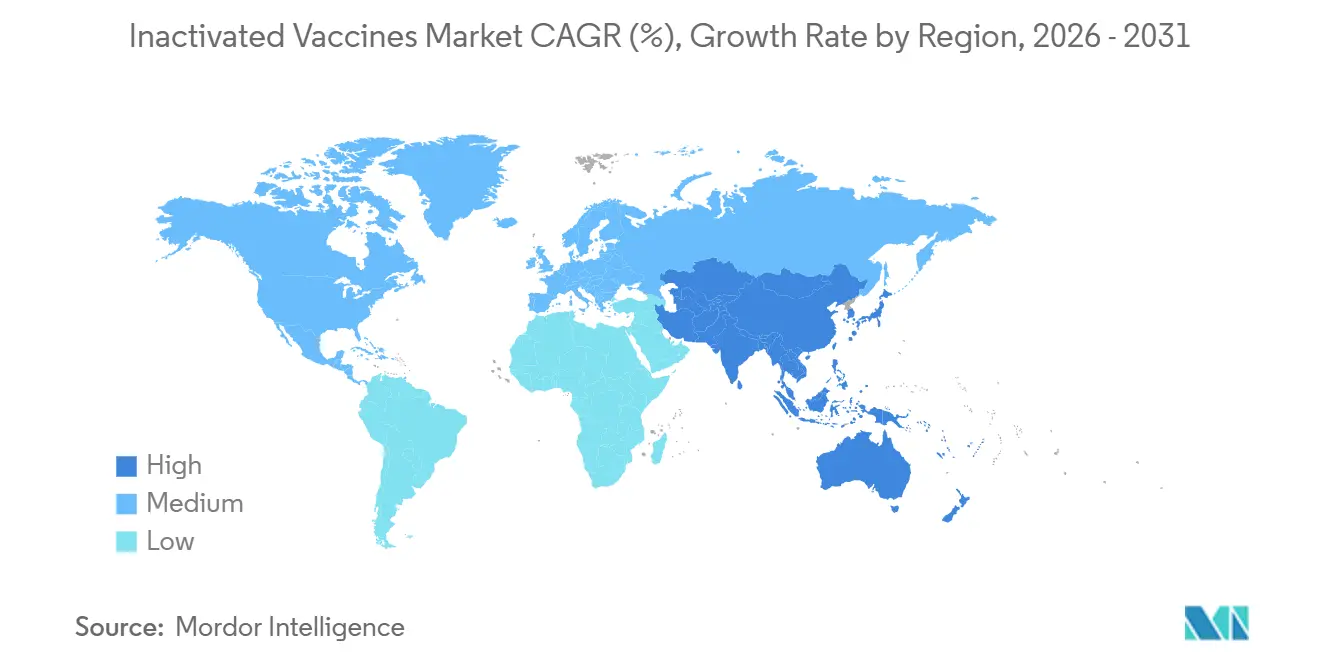
| Fastest Growing Market | Asia Pacific |
| Largest Market | North America |
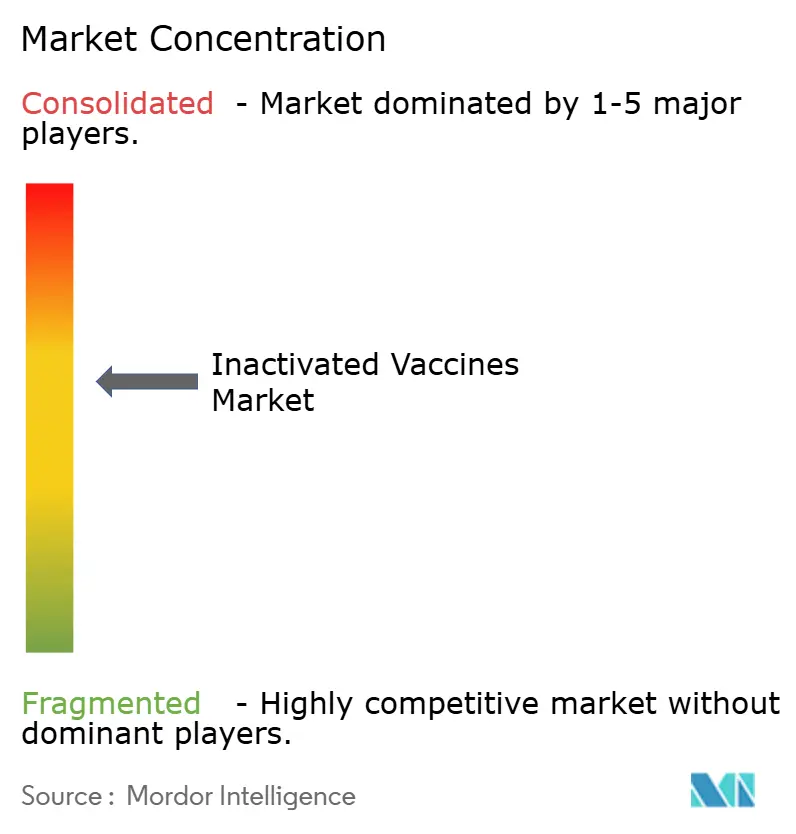
| Market Concentration | Medium |
Major Players *Disclaimer: Major Players sorted in no particular order Image © Mordor Intelligence. Reuse requires attribution under CC BY 4.0. | |
Inactivated Vaccines Market Analysis by Mordor Intelligence
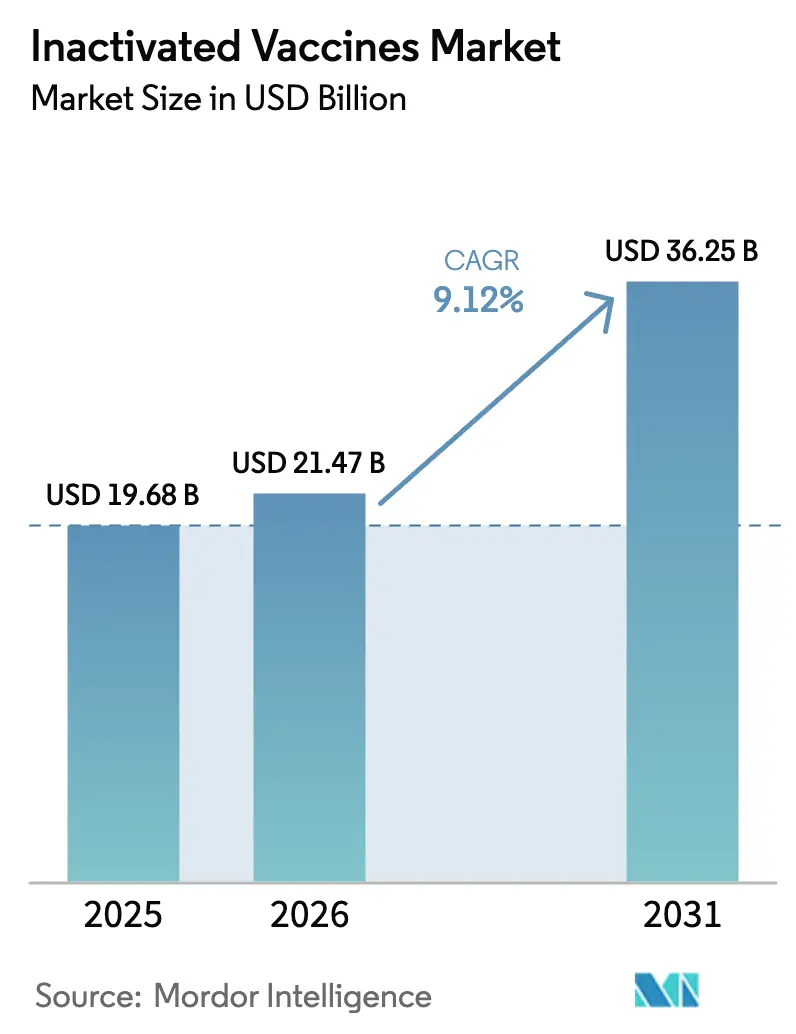
The Inactivated Vaccines Market was valued at USD 19.68 billion in 2025 and expected to grow from USD 21.47 billion in 2026 to reach USD 36.25 billion by 2031, at a CAGR of 9.12% during the forecast period (2026-2031).
Consistent government procurement cycles, stronger pandemic-preparedness budgets, and recurrent outbreaks of vaccine-preventable diseases keep the inactivated vaccines market on an upward path. Viral formulations, led by seasonal influenza and legacy COVID-19 doses, delivered 66.43% of 2025 revenue and remain the anchor that sustains global demand for the inactivated vaccines market. Subcutaneous delivery held 54.76% share in 2025, yet oral products are pacing ahead at a 12.11% annual growth rate as next-generation oral polio and cholera vaccines expand in endemic regions. Home-care channels, supported by telehealth, mobile units, and auto-injectors, are advancing at 12.87% CAGR, reshaping how the inactivated vaccines market reaches underserved communities.
Key Report Takeaways
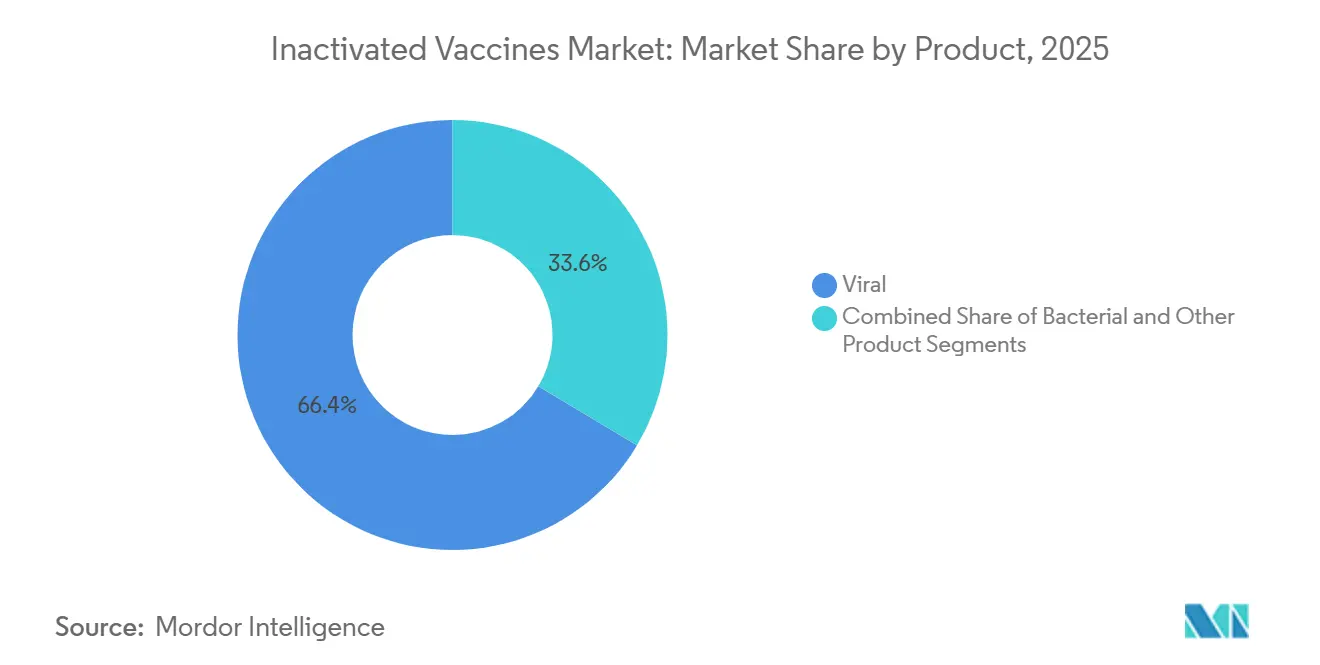
- By product, viral formulations commanded 66.43% of the inactivated vaccines market share in 2025 and are forecast to grow at an 11.54% CAGR through 2031.
- By route, subcutaneous vaccines accounted for 54.76% of 2025 revenue, whereas oral vaccines are projected to register a 12.11% CAGR through 2031.
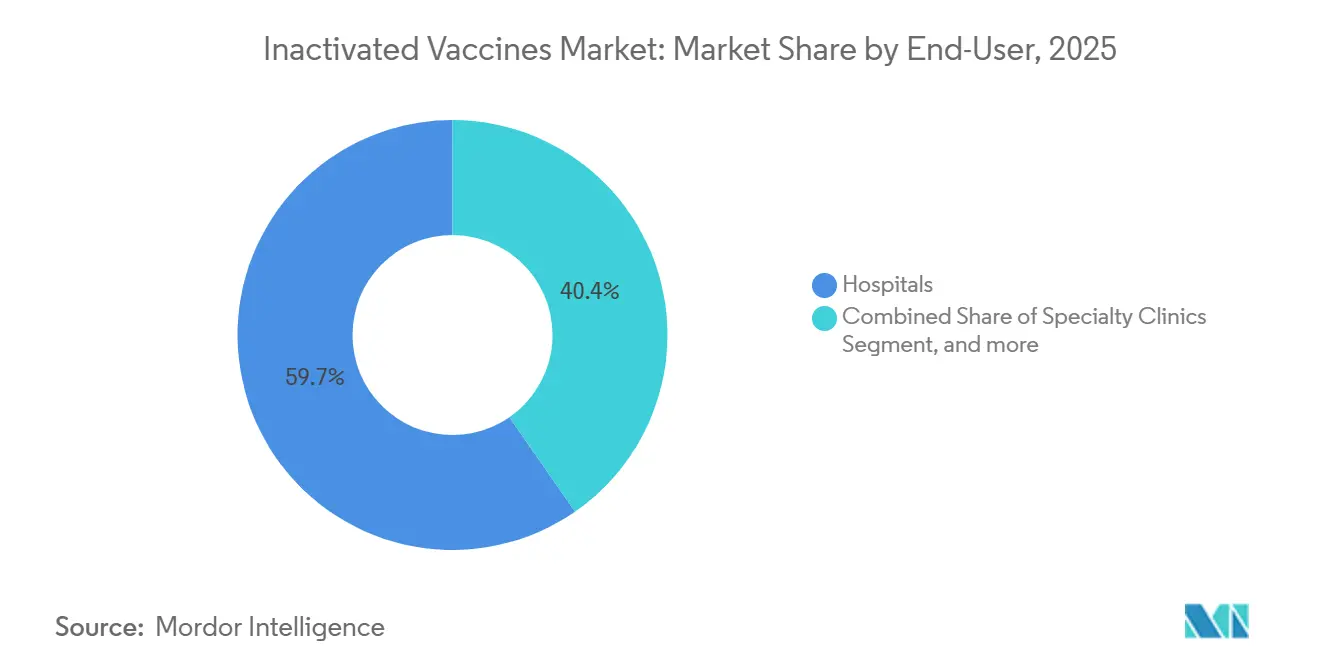
- By end-user, hospitals captured 59.65% of demand in 2025, while home-care settings are set to expand at a 12.87% CAGR over the same horizon.
- By inactivation method, solvent–detergent processes led with 41.65% share in 2025; radiation techniques are expected to post an 11.32% CAGR up to 2031
- By distribution channel, hospital pharmacies accounted for 46.43% of 2025 sales, yet online pharmacies will grow at a 12.65% CAGR through 2031.
- By geography, North America accounted for 43.65% of global spending in 2025, while Asia-Pacific is expected to grow at a 10.54% CAGR through 2031.
Note: Market size and forecast figures in this report are generated using Mordor Intelligence’s proprietary estimation framework, updated with the latest available data and insights as of January 2026.
Global Inactivated Vaccines Market Trends and Insights
Drivers Impact Analysis*
| Driver | (~) (%) Impact on CAGR Forecast | Geographic Relevance | Impact Timeline |
|---|---|---|---|
| Rising Global Immunization Coverage Mandates | +1.8% | EU, North America, India, Indonesia | Medium term (2-4 years) |
| Escalating Prevalence of Vaccine-Preventable Diseases | +1.5% | Sub-Saharan Africa, South Asia, outbreak-prone regions | Short term (≤2 years) |
| Expansion of Government Procurement and Stockpiling Budgets | +2.1% | North America, Europe, China, India | Long term (≥4 years) |
| Technological Innovations in Adjuvants and Formulations | +1.3% | North America, Europe, APAC contract manufacturers | Medium term (2-4 years) |
| Growing Demand for Pandemic Preparedness Platforms | +1.6% | G7, G20, WHO Pandemic Fund recipients | Long term (≥4 years) |
| Increasing Acceptance Among Immunocompromised Populations | +0.9% | North America, Europe, urban APAC centers | Medium term (2-4 years) |
| Source: Mordor Intelligence | |||
Rising Global Immunization Coverage Mandates
Governments tightened vaccination rules after COVID-19 exposed lingering coverage gaps. WHO reported 14.3 million zero-dose DTP3 children in 2024 and 20.6 million children missing the first measles shot, highlighting unmet needs. Countries shifting from oral polio vaccine have raised IPV1 coverage to 85%, while IPV2 coverage stands at 68%, underscoring reliance on killed-virus platforms. The United Kingdom’s GBP 1 billion Dynamic Purchasing System, established in 2024, secures COVID-19 supplies through 2028, locking in multi-year volumes for inactivated suppliers[1]Department of Health and Social Care, “Dynamic Purchasing System Contract Award,” GOV.UK. These mandates lower regulatory risk for the inactivated vaccines market by leveraging decades of safety data, established cold chains, and mature good-manufacturing-practice credentials to expedite approvals. Makers that keep certification current capture predictable tenders, stabilizing cash flow in the inactivated vaccines market.
Escalating Prevalence of Vaccine-Preventable Diseases
Measles outbreaks surged to 800 U.S. cases between January and April 2025 as declining MMR coverage fueled flare-ups. In regions where COVID-19 disrupted basic services, catch-up drives often deploy inactivated or combination vaccines to quickly rebuild herd immunity. Polio eradication campaigns rolled out novel oral type 2 vaccines, yet polio-free countries still rely on the inactivated polio vaccine to block re-entry. Cholera waves in Yemen, Haiti, and the Democratic Republic of Congo forced those to tap the global stockpile, while travelers and troops requested inactivated cholera doses for fast protection. Influenza seasons in 2024 and 2025 remained moderate to high, preserving demand for trivalent and quadrivalent inactivated formulations reviewed six months ahead in the Southern Hemisphere[2]U.S. Food and Drug Administration, “Seqirus Flucelvax Approval,” FDA.GOV. These persistent threats cement the relevance of the inactivated vaccines market, which offers broad age eligibility and seamless integration with current immunization systems.
Expansion of Government Procurement and Stockpiling Budgets
The U.S. countermeasure enterprise earmarked USD 79.487 billion for fiscal 2023-2027, with USD 970 million flowing to BARDA in 2025 and USD 965 million to the Strategic National Stockpile. The multilateral Pandemic Fund put USD 547 million into 50 countries in 2024 for local manufacturing and cold-chain upgrades. Brazil used PAHO’s Regional Revolving Funds to negotiate updated pneumococcal and RSV shots, while positioning Bio-Manguinhos and Butantan Institute as regional suppliers. These allocations mark a pivot from reactive purchases to proactive stockpiling, granting the inactivated vaccines market steady demand visibility when producers prove shelf-life stability and rapid surge capacity.
Technological Innovations in Adjuvants and Formulations
Oil-in-water emulsions, saponin-based mixes, and toll-like-receptor agonists extend beyond classic aluminum salts and enable dose-sparing. GSK’s AS01 platform, pivotal to Shingrix, booked GBP 3.4 billion in the first nine months of 2024, validating the premium adjuvanted product category. Sanofi’s Arexvy reached GBP 1.8 billion in 2024, and Pfizer’s Abrysvo secured FDA label extensions for co-administration with inactivated flu shots. Gamma irradiation speeds pathogen kill and avoids solvent residues, while Novavax’s Matrix-M-adjuvanted COVID-19 vaccine won EUA for the 2024-2025 season, offering an alternative to nucleic-acid approaches. These advances enable firms to differentiate through immunogenicity, thermostability, and patient convenience, thereby strengthening the value proposition of the inactivated vaccines market.
Restraints Impact Analysis*
| Restraint | (~) (%) Impact on CAGR Forecast | Geographic Relevance | Impact Timeline |
|---|---|---|---|
| Stringent Biocontainment and GMP Compliance Costs | -1.2% | North America, Europe; emerging markets face financing gaps | Long term (≥4 years) |
| Supply Chain Vulnerabilities for Critical Raw Materials | -0.9% | Regions dependent on single-source adjuvants, vials, culture media (APAC, Latin America) | Short term (≤2 years) |
| Competition from Next-Generation Vaccine Platforms | -1.4% | North America, Europe, urban APAC where mRNA uptake is high | Medium term (2-4 years) |
| Vaccine Hesitancy and Misinformation Campaigns | -0.7% | U.S., Western Europe, select APAC markets with active anti-vaccine movements | Short term (≤2 years) |
| Source: Mordor Intelligence | |||
Stringent Biocontainment and GMP Compliance Costs
Biosafety level 3 or 4 build-outs can exceed USD 500 million, and regulators require validated inactivation assays and exhaustive environmental monitoring. Merck’s Durham and GSK’s Pennsylvania expansions show the capital burden required to slot next-generation analytics and single-use systems into compliance frameworks. Smaller APAC and Latin American manufacturers struggle to fund upgrades, limiting their prospects for WHO prequalification. Post-market pharmacovigilance adds cost; Novavax must deliver monthly potency data and run observational safety studies under its EUA obligations. High overhead favors integrated incumbents, tempering the flow of new entrants into the inactivated vaccines market.
Supply Chain Vulnerabilities for Critical Raw Materials
Adjuvant components, borosilicate glass, and cell culture media often come from a single supplier. COVID-19 exposed fragile links when vial shortages delayed shipments worldwide. Contract disruptions in one region ripple across multiple plants, causing production pauses that dent the market for inactivated vaccines. Manufacturers hedge with dual sourcing and on-site stockpiles, yet material inflation and logistics bottlenecks still erode margins until redundancies mature.
*Our forecasts treat driver/restraint impacts as directional, not additive. The impact forecasts reflect baseline growth, mix effects, and variable interactions.
Segment Analysis
By Product: Viral Dominance Sustains Growth Prospects
Viral preparations held 66.43% of the inactivated vaccines market share in 2025 as influenza, COVID-19, and polio programs drew large volumes. Bacterial products serve narrower indications such as cholera or typhoid yet fill vital public-health gaps. The inactivated vaccines market size for viral formulations is predicted to widen at an 11.54% CAGR through 2031 while influenza strain updates, legacy COVID-19 stockpiles, and rising RSV demand reinforce volume. Seasonal influenza remains the biggest viral sub-segment after FDA approval of Seqirus’s trivalent Flucelvax for infants as young as six months. Bacterial segments continue in lower-income settings where whole-cell pertussis costs less than acellular options. Emerging “others,” including inactivated dengue and rabies vaccines, lift diversification and spur pipeline momentum.
Overall, viral products harness established capacity, multi-decade safety data, and broad age approvals that integrate easily into national schedules. Competition intensifies as mRNA and protein subunit shots enter RSV and COVID-19 boosters, prompting viral producers to refine adjuvants and accelerate radiation inactivation to stay competitive in the inactivated vaccines market.


By Route of Administration: Oral Platforms Promise Access Gains
Subcutaneous injections comprised 54.76% of 2025 usage, cemented by entrenched needle-and-syringe logistics. The inactivated vaccines market for oral products is slated to grow at a 12.11% CAGR to 2031, driven by nOPV2 campaigns and the release of cholera emergency stockpiles. Oral formats cut sharps waste and cold-chain burden, easing mass drives in densely populated zones. Technical hurdles remain, including gastric degradation and variable mucosal immunity, yet enteric coatings and buffered formulations are narrowing the gap. Intravenous routes are limited to hospital immunoglobulin use.
Commercial traction for oral vaccines depends on thermostable technologies and pediatric-friendly flavors. Firms that pair oral cholera or typhoid doses with digital health adherence tools can win share while defending injectable franchises through auto-injector innovation in the inactivated vaccines market.
By Method of Inactivation: Radiation Gains Credibility
Solvent–detergent techniques led with 41.65% in 2025 thanks to long regulatory histories. Gamma irradiation and ultraviolet approaches are forecast to log an 11.32% CAGR through 2031 as firms chase faster kill kinetics and lower chemical waste[3]International Atomic Energy Agency, “Capital Costs of Gamma Irradiation Suites,” IAEA.ORG. Radiation preserves conformational epitopes by avoiding solvents, trimming purification steps. Up-front costs for shielded suites run USD 10-30 million, yet savings accrue through shorter batch cycles and simplified residue testing. Heat and pH treatments linger in legacy bacterial lines but gradually cede ground.
Producers that validate radiation methods with authorities secure agility during outbreak surges, reinforcing their position in the inactivated vaccines market while lowering environmental liabilities.
By End-User: Home-Care Emerges from Niche to Mainstream
Hospitals delivered 59.65% of 2025 sales due to peri-operative, oncology, and neonatal protocols. Home-care environments will rise at 12.87% CAGR as self-administration devices and pharmacist house visits scale. Research institutions remain small yet strategic buyers that generate immunogenicity data critical for label expansions. Specialty clinics handle travelers, healthcare workers, and immune-suppressed cohorts, adding mix to demand.
Successful home-care models rely on payor coverage, e-prescribing integrations, and pre-filled syringes stable for short transport windows. Manufacturers partnering with telehealth portals and community health workers can unlock incremental volume for the inactivated vaccines market.
By Distribution Channel: Online Pharmacies Expand Digital Reach
Hospital pharmacies captured 46.43% share in 2025 via centralized procurement and bargained prices. Online pharmacies are forecast to grow 12.65% annually to 2031 on the back of last-mile cold-chain packaging and live temperature tracking. Retail chains remain hubs for walk-in flu shots, leveraging long hours and pharmacist counseling. Regulatory clearance for direct-to-consumer shipping varies, yet pilot programs in the United States and parts of Europe point to broader adoption.
Thermostable presentations and tamper-evident packs raise consumer confidence, while data-logger returns feed real-world stability evidence. Firms that bundle educational apps and appointment scheduling services can strengthen brand equity across the inactivated vaccines market.
Geography Analysis
North America accounted for 43.65% of 2025 revenue after the United States committed USD 79.487 billion to medical countermeasures for fiscal 2023-2027 and set aside USD 965 million for the Strategic National Stockpile. Merck’s USD 1 billion Durham plant and GSK’s USD 800 million Pennsylvania upgrade add domestic capacity that reduces import risk, while Sanofi’s CAD 800 million Toronto site broadens export supply to 60 markets. Predictable FDA and Health Canada pathways favor quick Emergency Use Authorizations and rigorous pharmacovigilance, making the region a dependable anchor for the inactivated vaccines market.
Asia-Pacific is projected to advance at a 10.54% CAGR through 2031, fueled by India’s Mission Indradhanush, China’s National Immunization Program reforms, and Sanofi’s SGD 800 million Modulus facility in Singapore. Serum Institute and Bharat Biotech leverage cost advantages and WHO prequalification to supply Gavi-funded campaigns in Africa and Southeast Asia. Sinovac and Sinopharm dominate domestic procurement but face export headwinds in high-income markets where mRNA vaccines are gaining ground. Regulatory alignment among Japan, Australia, and South Korea with FDA and EMA strain-update timelines fosters cross-regional efficiency, supporting steady demand in the inactivated vaccines market.
Europe maintains strong uptake for influenza, shingles, and RSV shots, with GSK booking GBP 3.4 billion from Shingrix and GBP 1.8 billion from Arexvy in 2024. EMA’s 2026 Nuvaxovid update extended access for immunocompromised adults, boosting protein-subunit and inactivated alternatives. The Middle East and Africa rely on WHO stockpiles of yellow fever and cholera vaccines, while Gavi funds cold-chain upgrades that increase regional coverage. South America benefits from Brazil’s agreements with PAHO to secure 20-valent pneumococcal and RSV vaccines via pooled procurement, cementing local production hubs that feed neighboring markets. These dynamics underscore the importance of regulatory harmonization and public-private partnerships in balancing supply across the inactivated vaccines market.

Competitive Landscape
The inactivated vaccines market is moderately concentrated. Top manufacturers control most seasonal flu, polio, and COVID-19 capacity by leveraging vertically integrated adjuvant lines and biosafety facilities. Proprietary adjuvants such as AS01, AS03, MF59, and Matrix-M support premium positioning, while Indian and Chinese contract producers compete primarily on cost. Merck’s November 2025 USD 9.2 billion purchase of Cidara Therapeutics added a long-acting influenza antiviral that complements its vaccine offerings. Sanofi’s May 2024 acquisition of INBRX-101 broadened its rare-disease biologics footprint, underscoring an appetite for adjacent assets with shared manufacturing capabilities.
White-space opportunities lie in thermostable oral cholera and typhoid vaccines, combination schedules that reduce clinic visits, and formulations tailored for immunocompromised adults who may respond poorly to mRNA vaccines. Digital-health disruptors integrate teleconsultations, in-home administration, and real-time adverse-event tracking, potentially displacing traditional hospital and retail outlets. Technology adoption centers on continuous manufacturing, single-use bioreactors, and digital twins that speed validation, illustrated by Merck’s Durham and Sanofi’s Modulus plants. Smaller players such as Bharat Biotech and Sinovac exploit lower costs and regional approvals to penetrate Asia-Pacific and Latin America, yet limited access to advanced adjuvants caps their share in high-income segments. WHO prequalification and ICH guidelines smooth multi-market entry for firms with mature quality systems, reinforcing a competitive field that rewards scale and regulatory compliance within the inactivated vaccines market.
Inactivated Vaccines Industry Leaders
Sanofi
GSK Plc
Pfizer, Inc.
Merck & Co.
Bharat Biotech
- *Disclaimer: Major Players sorted in no particular order

Recent Industry Developments
- May 2025: The U.S. Department of Health and Human Services (HHS) and the National Institutes for Health (NIH) announced the development of the next-generation, universal vaccine platform, Generation Gold Standard, using a beta-propiolactone (BPL)-inactivated, whole-virus platform.
- April 2025: European Vaccine Initiative partnered with a new project to develop a promising HCV inactivated vaccine (HCVIVA), supported by Denmark's Innovation Fund and led by Hvidovre Hospital. The vaccine aims to trigger broad neutralizing antibodies to prevent HCV-related diseases.
- April 2025: Novartis announced a USD 23 billion five-year U.S. investment that includes four new biologics facilities and a USD 1.1 billion San Diego research hub.


Global Inactivated Vaccines Market Report Scope
As per the scope of the report, inactivated vaccines contain viruses or bacteria that have been killed or inactivated so they cannot cause disease. They stimulate the immune system to recognize and fight the pathogen without causing illness. These vaccines require multiple doses or booster shots for effective immunity.
The Inactivated Vaccines Market is Segmented by Product (Viral, Bacterial, and Others), Route of Administration (Subcutaneous, Oral, and Intravenous), Method of Inactivation (Solvent Detergent, Radiation, pH Concentration, Heat Inactivation, and Others), End-User (Hospitals, Specialty Clinics, Home-Care Settings, and Research Institutions), Distribution Channel (Hospital Pharmacies, Retail Pharmacies, and Online Pharmacies), and Geography (North America, Europe, Asia-Pacific, Middle East & Africa, and South America). The market report also covers the estimated market sizes and trends for 17 countries across major regions globally. The report offers the value (in USD million) for the above segments.
| Viral |
| Bacterial |
| Other Products |
| Subcutaneous |
| Oral |
| Intravenous |
| Solvent Detergent |
| Radiation |
| pH Concentration |
| Heat Inactivation |
| Other Method of Inactivations |
| Hospitals |
| Specialty Clinics |
| Home-Care Settings |
| Research Institutions |
| Hospital Pharmacies |
| Retail Pharmacies |
| Online Pharmacies |
| North America | United States |
| Canada | |
| Mexico | |
| Europe | Germany |
| United Kingdom | |
| France | |
| Italy | |
| Spain | |
| Rest Of Europe | |
| Asia-Pacific | China |
| Japan | |
| India | |
| Australia | |
| South Korea | |
| Rest Of Asia-Pacific | |
| Middle East & Africa | GCC |
| South Africa | |
| Rest Of Middle East & Africa | |
| South America | Brazil |
| Argentina | |
| Rest Of South America |
| By Product | Viral | |
| Bacterial | ||
| Other Products | ||
| By Route Of Administration | Subcutaneous | |
| Oral | ||
| Intravenous | ||
| By Method of Inactivation | Solvent Detergent | |
| Radiation | ||
| pH Concentration | ||
| Heat Inactivation | ||
| Other Method of Inactivations | ||
| By End-User | Hospitals | |
| Specialty Clinics | ||
| Home-Care Settings | ||
| Research Institutions | ||
| By Distribution Channel | Hospital Pharmacies | |
| Retail Pharmacies | ||
| Online Pharmacies | ||
| Geography | North America | United States |
| Canada | ||
| Mexico | ||
| Europe | Germany | |
| United Kingdom | ||
| France | ||
| Italy | ||
| Spain | ||
| Rest Of Europe | ||
| Asia-Pacific | China | |
| Japan | ||
| India | ||
| Australia | ||
| South Korea | ||
| Rest Of Asia-Pacific | ||
| Middle East & Africa | GCC | |
| South Africa | ||
| Rest Of Middle East & Africa | ||
| South America | Brazil | |
| Argentina | ||
| Rest Of South America | ||


Key Questions Answered in the Report
What is the projected value of the inactivated vaccines market in 2031?
The market is forecast to reach USD 36.25 billion by 2031.
Which product category led revenue in 2025?
Viral inactivated formulations dominated with 66.43% of 2025 revenue.
How fast will Asia-Pacific grow through 2031?
Asia-Pacific is set to post a 10.54% CAGR during the forecast period.
Why are home-care channels important?
They provide 12.87% CAGR growth by enabling decentralized immunization via auto-injectors and mobile teams.
Which inactivation method is growing quickest?
Radiation techniques, especially gamma irradiation, are projected to expand at an 11.32% CAGR.
What restrains new entrants the most?
High biosafety and GMP compliance costs that can top USD 500 million for advanced facilities.
Page last updated on:


