Image-Based Cytometry In Cell Analysis Market Size and Share
Market Overview
| Study Period | 2020 - 2031 |
|---|---|
| Market Size (2026) | USD 3.98 Billion |
| Market Size (2031) | USD 6.68 Billion |
| Growth Rate (2026 - 2031) | 10.90% CAGR |
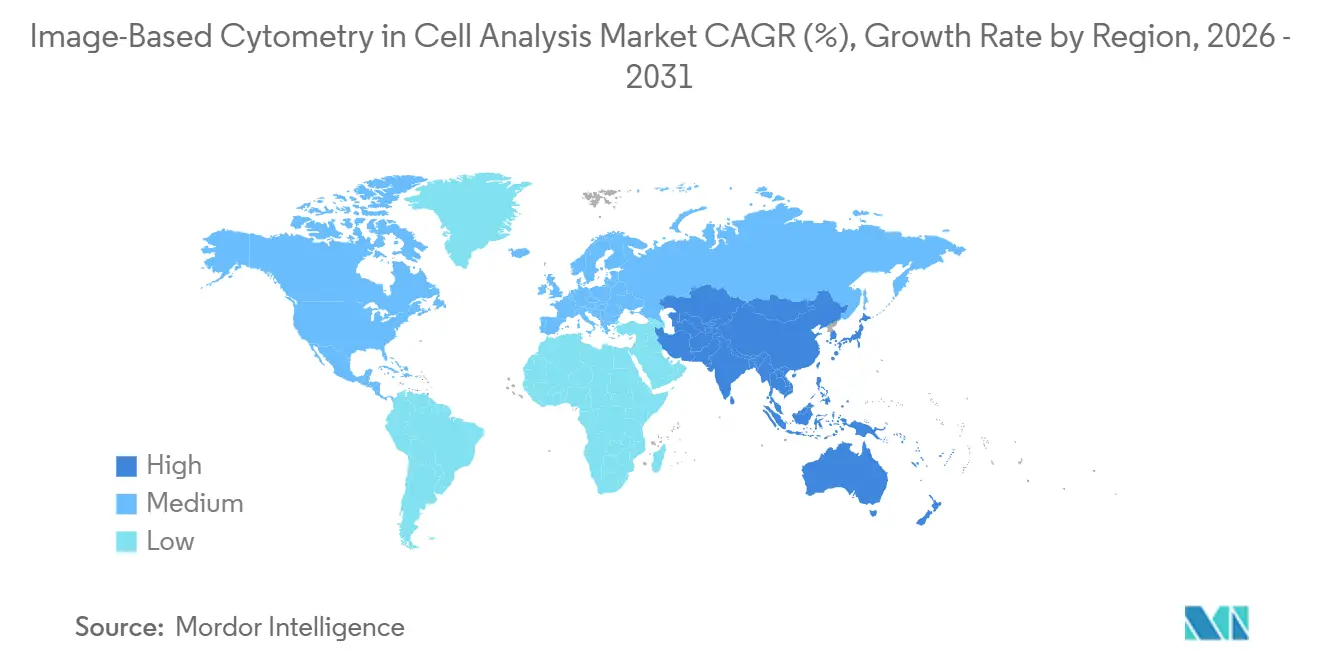
| Fastest Growing Market | Asia-Pacific |
| Largest Market | North America |
| Market Concentration | Medium |
Major Players *Disclaimer: Major Players sorted in no particular order Image © Mordor Intelligence. Reuse requires attribution under CC BY 4.0. | |
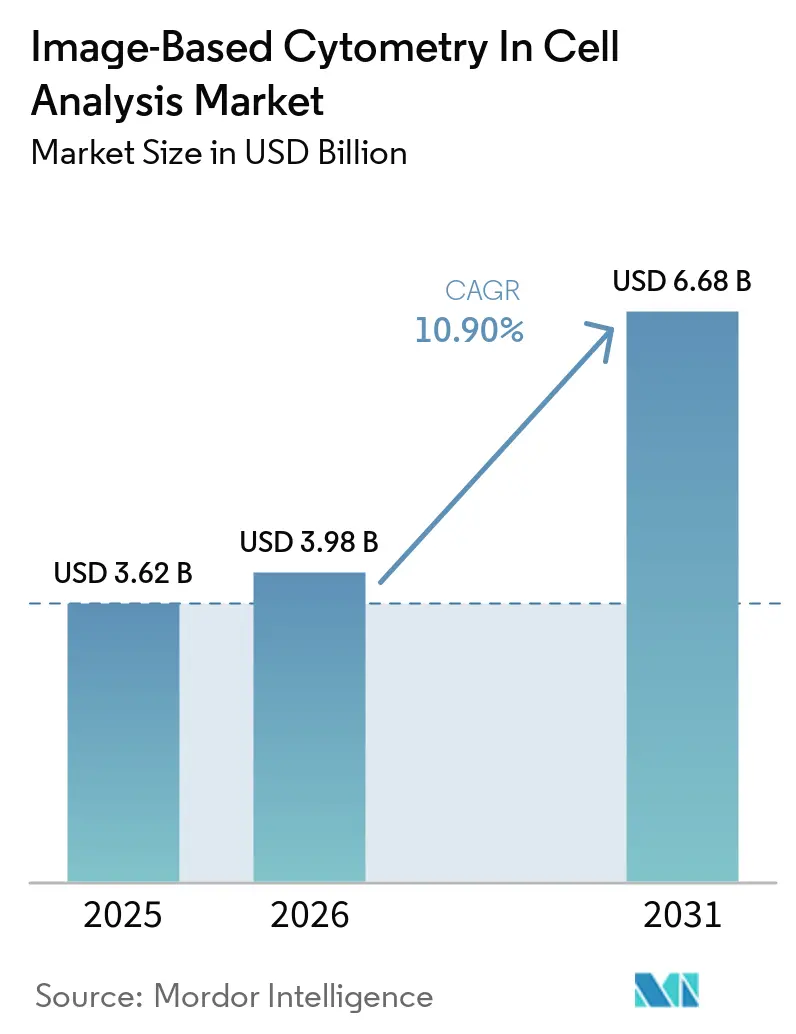
Image-Based Cytometry In Cell Analysis Market Analysis by Mordor Intelligence
The Image-Based Cytometry In Cell Analysis Market size is expected to increase from USD 3.62 billion in 2025 to USD 3.98 billion in 2026 and reach USD 6.68 billion by 2031, growing at a CAGR of 10.90% over 2026-2031.
Advances in AI-driven image analysis, wider use of 3D organoids, and the shift to label-free, longitudinal cell analytics are speeding adoption across discovery and development workflows. Regulatory momentum around validated, auditable image data platforms for clinical investigations and manufacturing is reinforcing the move to quantitative imaging endpoints. North America led with the largest regional position in 2025, while Asia-Pacific is set to expand the fastest through 2031 as new imaging capacity comes online at CROs and translational centers. Competitive strategies favor integrated software and analytics workflows that reduce expertise bottlenecks and raise switching costs after method validation in regulated environments.
Key Report Takeaways
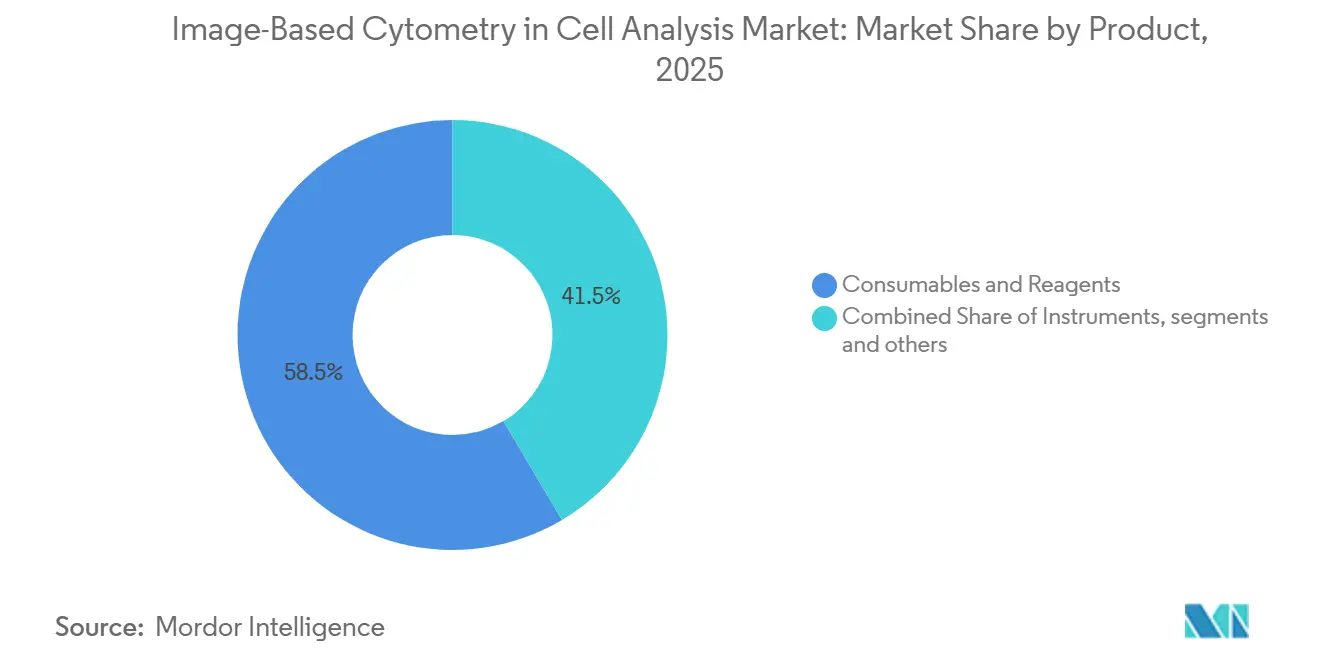
- By product, consumables & reagents led with 58.51% revenue share in 2025, while software & image analysis is projected to grow at a 12.89% CAGR over 2026-2031.
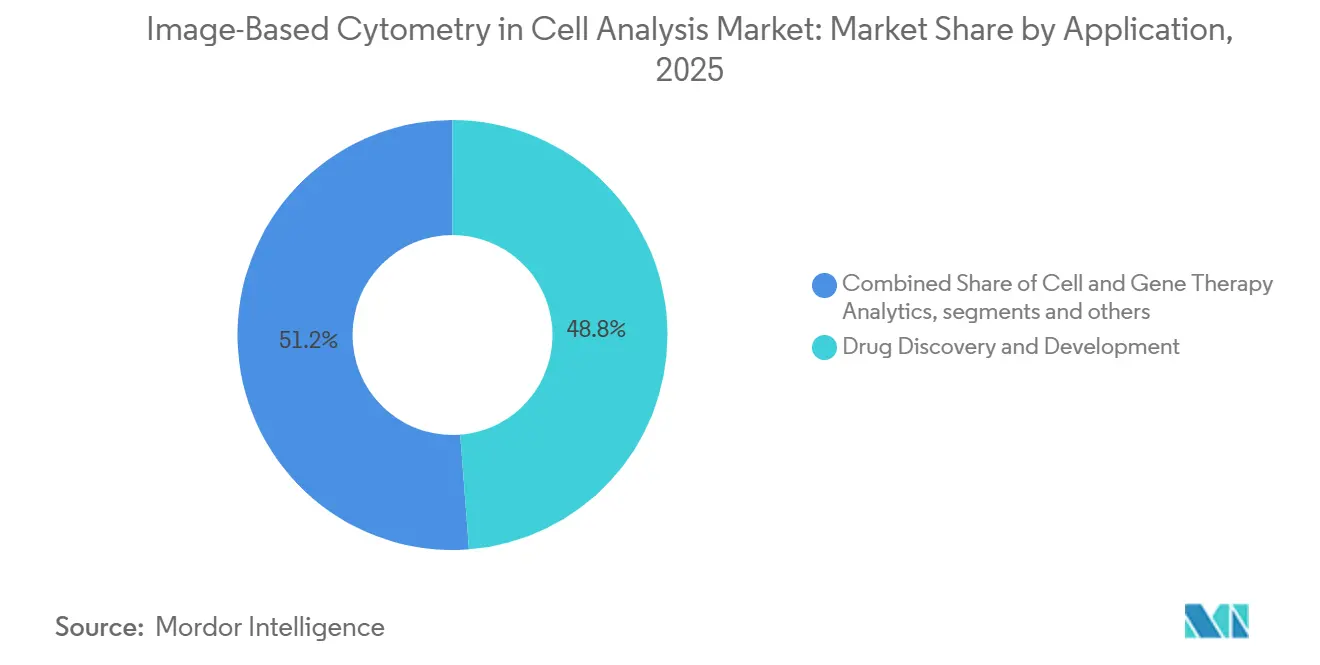
- By application, drug discovery & development accounted for 48.78% in 2025, while cell & gene therapy analytics is expected to record a 12.08% CAGR through 2031.
- By end user, pharmaceutical & biotechnology companies held 55.12% in 2025, while CROs & CDMOs are projected to expand at an 11.24% CAGR from 2026 to 2031.
- By geography, North America captured 47.44% in 2025, while Asia-Pacific is positioned to grow at a 12.32% CAGR through 2031.
Note: Market size and forecast figures in this report are generated using Mordor Intelligence’s proprietary estimation framework, updated with the latest available data and insights as of January 2026.
Global Image-Based Cytometry In Cell Analysis Market Trends and Insights
Drivers Impact Analysis*
| Driver | (~) % Impact on CAGR Forecast | Geographic Relevance | Impact Timeline |
|---|---|---|---|
| AI-accelerated image analysis scales phenotypic screening and predictive toxicology | +2.4% | Global, with early gains in North America & EU pharmaceutical R&D hubs | Medium term (2-4 years) |
| Expansion of drug discovery & development workflows using high-content imaging | +2.0% | Global, particularly North America, Western Europe, and emerging APAC biotech sectors | Short term (≤ 2 years) |
| Rapid uptake of 3D cell models and organoids requiring advanced image cytometry | +2.1% | Global, with concentration in academic centers (North America, EU) and APAC precision medicine programs | Short term (≤ 2 years) |
| Live-cell kinetic imaging enabling longitudinal, non-perturbing cell analytics | +1.5% | Global, strongest in pharmaceutical R&D centers (US, Switzerland, UK, Japan) | Medium term (2-4 years) |
| Potency assurance in cell & gene therapies elevates demand for quantitative imaging assays | +1.8% | North America (FDA-driven), spillover to EU & APAC for export compliance | Medium term (2-4 years) |
| Data-integrity and audit-trail compliance (21 CFR Part 11) push validated image-data platforms | +1.2% | Global, with immediate impact in FDA/EMA-regulated markets (North America, EU) | Short term (≤ 2 years) |
| Source: Mordor Intelligence | |||
AI-Accelerated Image Analysis Scales Phenotypic Screening and Predictive Toxicology
Deep-learning models are raising accuracy and throughput in image-based phenotypic screens compared with manual pipelines, with CG-RecNet reporting 96.40% accuracy for label-free neural stem cell lineage classification in imaging flow cytometry. An end-to-end model known as PhenoProfiler achieved a 20% accuracy improvement over ResNet50 baselines on a large high-content dataset while removing multi-step preprocessing, which shortens setup time and reduces expert effort[1]“PhenoProfiler: Advancing Phenotypic Learning for Image-Based Drug Discovery,” Nature Communications, nature.com. Commercial platforms that combine chemical features with Cell Painting image descriptors have shown stronger toxicity prediction than image-only models, which helps teams find liabilities sooner in the hit-to-lead cycle. These gains are steering teams away from descriptive morphology libraries to predictive models that map to mechanism of action and safety risk early in discovery workflows. U.S. guidance on electronic systems and records in clinical investigations is also pushing sponsors to document model validation and maintain traceable, tamper-evident data, which supports the acceptance of algorithmic endpoints when validation evidence is in place.
Rapid Uptake of 3D Cell Models and Organoids Requiring Advanced Image Cytometry
Organoids and other 3D cell models are gaining share in preclinical studies due to stronger alignment with clinical outcomes, with brightfield imaging-based drug response metrics achieving 75–85% concordance with patient results in recent datasets. Imaging hardware and workflows are adapting with microfluidic agarose chips that raise organoid-throughput by 35-fold versus manual methods while preserving sample integrity during acquisition. Label-free analysis with virtual staining now scores T cell activation in co-culture without fluorescent labels that alter cellular metabolism, which supports longitudinal studies and preserves material for multi-omics assays. Studies continue to show meaningful inter-lab variability in spheroid metrics such as size when media composition and seeding densities differ, which underscores the need for standardized protocols and metadata. Modular, automated culture and imaging platforms are emerging to stabilize throughput and measurement repeatability in large organoid screens and to reduce operator effects over multi-day experiments.
Potency Assurance in Cell & Gene Therapies Elevates Demand for Quantitative Imaging Assays
Developers of cell and gene therapies need potency assays that tie to clinical effect, which is driving use of image-based measures for CAR expression, cytotoxic granule release, and serial killing before batch release. Real-time impedance platforms like xCELLigence track cytolysis kinetics at scale and have supported potency testing for an FDA-approved CAR T therapy, which shortens release timelines relative to legacy assays. Multimodality imaging, including phase contrast and fluorescence, is improving the separation of target engagement from off-target events in complex samples, which raises confidence in release decisions. Potency matrices for mesenchymal stem cells now integrate image-derived markers such as IDO1 and extracellular vesicle metrics to stabilize batch-to-batch performance for clinical use. Compliance frameworks for electronic records and signatures are shaping software selection by favoring platforms that produce audit trails, secure time stamps, and immutable raw data for regulated submissions.
Live-Cell Kinetic Imaging Enabling Longitudinal, Non-Perturbing Cell Analytics
Continuous imaging inside controlled incubators is reducing perturbations tied to repeated handling and is enabling plate-scale time-lapse designs that run for weeks with stable temperature and gas conditions. Drug-response and migration assays can run label-free to lower phototoxic stress, which raises reproducibility against endpoint snapshots and supports dose-response studies with fewer artifacts. Imaging teams are using adaptive acquisition to increase frame rates around transient cellular events such as mitotic rounding while keeping overall light dose low during quiescent periods. A quantitative framework known as PhotoFiTT shows that long, low-intensity exposures can be more damaging than short, intense pulses at equal dose, which is informing protocol redesign. AI-enabled illumination control and method selection are therefore steering users to light-sheet and spinning-disk confocal approaches, with protocol guidance from reagent providers on photobleaching and mitigation practices.
Restraints Impact Analysis*
| Restraint | (~) % Impact on CAGR Forecast | Geographic Relevance | Impact Timeline |
|---|---|---|---|
| High capital and operating costs for advanced imaging cytometers and reagents | -1.4% | Global, particularly acute for mid-tier academic institutions, emerging-market CROs, and small biotech | Long term (≥ 4 years) |
| Data volume, storage, and analytics complexity; talent shortages in bioimage informatics | -1.1% | Global, most severe in Asia-Pacific and academic sectors lacking dedicated informatics cores | Medium term (2-4 years) |
| Phototoxicity/photobleaching constraints limiting live-cell assay fidelity and throughput | -0.8% | Global, affecting long-duration live-cell experiments across all markets | Medium term (2-4 years) |
| Validation and metric-standardization gaps for AI pipelines in regulated use cases | -0.7% | Global, with heightened scrutiny in FDA/EMA jurisdictions and emerging AI Act compliance (EU) | Long term (≥ 4 years) |
| Source: Mordor Intelligence | |||
High Capital and Operating Costs for Advanced Imaging Cytometers and Reagents
Advanced systems require significant purchase and service commitments, which strain budgets for smaller labs and for institutions in emerging markets. Operating expenses extend to environmental control modules and consumables for long-term lapse studies, which adds recurring cost on top of annual maintenance. Protocols that rely on fluorescence require anti-fade chemistries and photobleaching mitigations, which add to reagent outlays in high-throughput screening. Shared core facilities can offset capital barriers by pooling access to premium platforms, although locations and time allocations favor better-resourced centers. The uneven spread of imaging cores and expertise can reinforce regional disparities in throughput and productivity in large discovery programs.
Data Volume, Storage, and Analytics Complexity, Along With Talent Shortages in Bioimage Informatics
Large designs with multi-channel Z-stacks can generate terabyte-scale datasets each week, which pushes storage and processing into cloud setups with stricter governance controls. Training and inference for deep models can consume extended GPU time, which lengthens analysis cycles for teams without dedicated clusters. Recruiting analysts who combine wet-lab experience with Python or R skills remains hard for many core facilities, which slows method development and custom pipeline work. Documentation requirements for electronic systems and records in clinical investigations add to the overhead for small groups that want to operationalize AI under audit conditions. Open-source tools can reduce license costs but often present steep learning curves and mixed documentation, with limited adherence to FAIR principles in many published workflows.
*Our forecasts treat driver/restraint impacts as directional, not additive. The impact forecasts reflect baseline growth, mix effects, and variable interactions.
Segment Analysis
By Product: Software Intelligence Displaces Hardware Commodity
Consumables & Reagents held 58.51% of the Image-Based Cytometry in Cell Analysis market share in 2025, supported by recurring demand for dye panels, antibodies, plates, and buffers in routine screening. The Image-Based Cytometry in Cell Analysis market size dynamics increasingly hinge on software growth, since Software & Image Analysis is projected to deliver a 12.89% CAGR over 2026-2031 as users shift to subscription analytics and automated interpretation. Deep-learning phenotypic analysis is becoming standard inside enterprise platforms, which reduces operator dependence and makes outcomes more predictable at scale. Vendors that productize robust segmentation, feature extraction, and classification into turnkey modules are lowering the barrier for labs without dedicated bioimage analysis teams. Tighter links between acquisition and analytics, plus compliance-friendly data pipelines, are strengthening customer lock-in after qualification in GxP workflows.
Software & Image Analysis is set to outpace hardware as users fund automation that scales across instruments and sites, while consumables growth follows the expanding installed base in large screening programs. The Image-Based Cytometry in Cell Analysis industry continues to reward solutions that couple AI accuracy with explainable outputs and stable performance across batches, which reduces false positives in phenotypic screens.
Pricing models are moving from upfront licenses toward usage-based billing linked to data analyzed, which aligns spending to delivered value. Competition favors ecosystems that ease method transfer into regulated manufacturing and clinical support settings with proper audit trails and data integrity safeguards. Over the forecast period, this mix raises the strategic weight of software roadmaps relative to standalone hardware upgrades in the Image-Based Cytometry in Cell Analysis Market.


By Application: Cell & Gene Therapy Analytics Eclipses Traditional Pharma Screens
Drug Discovery & Development accounted for 48.78% of spending in 2025 as high-content phenotypic screening, mechanism studies, and ADMET profiling remained central to large pharma pipelines. The Image-Based Cytometry in Cell Analysis market size outlook reflects faster growth for Cell & Gene Therapy Analytics at a 12.08% CAGR through 2031, with validated potency assays that correlate with clinical effect gaining priority across manufacturing lots. Multimodality imaging workflows are lifting confidence in discriminating on-target activity from off-target events, which improves release decisions for cell therapies.
Label-free kinetic tracking at plate scale is compressing time to result in potency testing and reducing reliance on legacy, labor-intensive assays. Image-based readouts also support translational studies that bridge release testing with clinical biomarkers in early trials. Advanced Cell Models continue to gain traction as organoid assays expand their role in precision oncology and disease modeling, which pushes imaging requirements toward volumetric analysis and spatial heterogeneity measures.
Clinical Research & Diagnostics benefits from image cytometry in immuno-oncology biomarker validation, although reimbursement remains variable and method standardization continues to evolve. The Image-Based Cytometry in Cell Analysis industry is consolidating workflows that allow discovery teams to reuse data structures and metadata in later clinical stages, which improves traceability and speeds submissions. Regulatory guidance for electronic records in clinical investigations clarifies expectations for audit readiness and helps streamline technology selection for programs that intend to cross from research to regulated use. Together, these shifts push the Image-Based Cytometry in Cell Analysis Market toward assays and software that link cell behavior to potency and safety readouts under reproducible, validated conditions.
By End User: CROs Capitalize on Outsourcing Wave, Undercutting Pharma Captive Labs
Pharmaceutical & Biotechnology Companies led with 55.12% in 2025 due to broad in-house screening capacity and the need to protect intellectual property within large discovery organizations. CROs & CDMOs are projected to grow the fastest at an 11.24% CAGR over 2026-2031 as sponsors move to variable-cost models and expand outsourced work for phenotypic screening and organoid assays.
Academic & Research Institutes contribute sizable instrument usage volumes through shared facilities but face budget constraints that limit premium system upgrades and high-throughput runs. Hospitals & Clinical Laboratories are earlier in adoption, where image cytometry enables rare cell enumeration and select translational assays that complement pathology readouts.
CROs & CDMOs are strengthening their differentiation through live-cell kinetic imaging, multimodality assay menus, and integrated analysis pipelines that compress turnaround times for sponsors. Guidance on electronic systems and records in clinical investigations supports method transfer from sponsors to qualified CROs when validation and documentation meet expectations, which helps level the field between captive and outsourced labs. The Image-Based Cytometry in Cell Analysis Market is thus balancing established in-house capacity with a robust outsourcing channel, which together broaden access to advanced imaging workflows across therapeutic areas. Over time, this mix should spread best practices across the value chain and improve data comparability between research and regulated settings in the Image-Based Cytometry in Cell Analysis Market.
Geography Analysis
North America held 47.44% in 2025. The regional lead in North America reflects a concentration of pharmaceutical sponsors, translational research centers, and early adoption of AI-enabled analysis under clear expectations for electronic records and data integrity. Strong live-cell imaging adoption across U.S. R&D groups also supports performance gains when scaling phenotypic screening and kinetic assays at plate scale. The Image-Based Cytometry in Cell Analysis market size in North America benefits from extensive core-facility networks and vendor presence, which shortens deployment timelines for new imaging software and compliant data pipelines.
Asia-Pacific is projected as the fastest-growing region with a 12.32% CAGR through 2031 for the Image-Based Cytometry in Cell Analysis Market. Asia-Pacific is building capacity across CROs and translational hubs to support discovery, potency testing, and organoid imaging, which is raising utilization across biopharma partnerships. Adoption of label-free assays and virtual staining tools supports longitudinal imaging on fragile samples and reduces perturbation in immunology and oncology studies. Hardware innovation around microfluidic organoid platforms is increasing throughput and driving down manual handling, which aligns with expanding screening programs in key APAC research centers. As more programs move from research use to regulated workflows, the need for secure imaging data management and auditable records will shape software procurement in APAC. This growth profile positions Asia-Pacific as the key engine for incremental demand in the Image-Based Cytometry in Cell Analysis Market.
Europe’s demand is steady across discovery and translational use, with momentum in academic-industry consortia that standardize imaging workflows and expand access to advanced platforms. The EU AI Act labels many healthcare image-analysis systems as high risk, which raises documentation needs and post-market monitoring but provides a harmonized route for deployment. Regions in the Middle East and Africa and in South America continue to expand imaging capability at select hubs, often through targeted initiatives and core facility investments that improve access to high-content and live-cell platforms[2]Graham D. Wright et al., “Recognising the Importance and Impact of Imaging Scientists,” Journal of Microscopy, globalbioimaging.org. Over the forecast, procurement decisions across Europe and other regions will reward vendors with strong compliance tooling and clear support for validated image assays in the Image-Based Cytometry in Cell Analysis Market.

Competitive Landscape
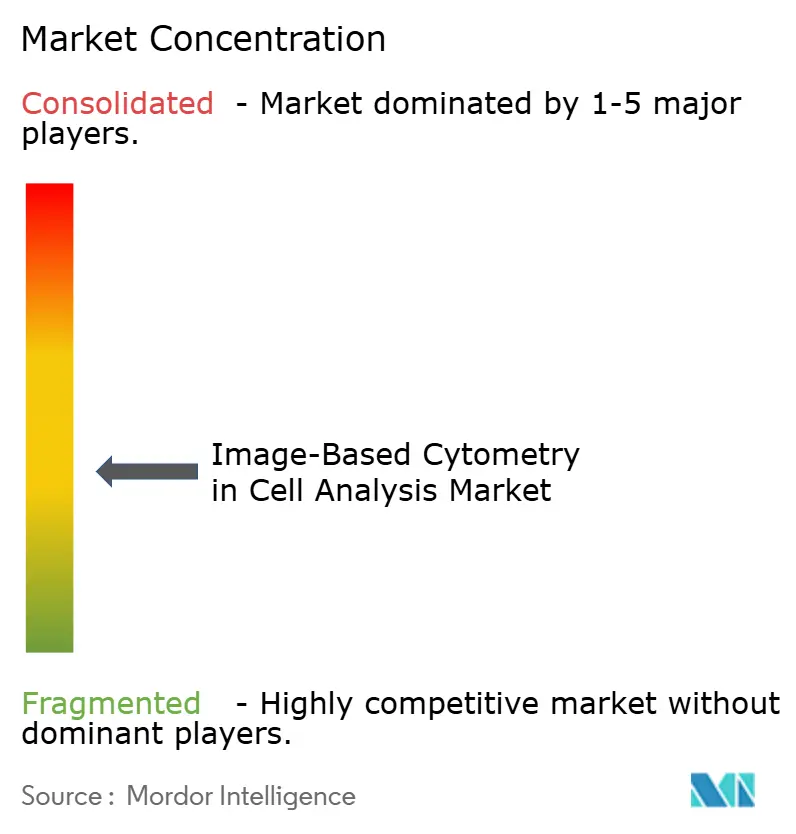
The Image-Based Cytometry in Cell Analysis Market shows moderate consolidation without a single dominant leader, with enterprise buyers prioritizing validated workflows that embed AI analytics, audit-ready data management, and stable performance across batches. Molecular Devices has focused on speed and integrated analytics with ImageXpress HCS.ai and IN Carta modules that automate phenotypic classification and shorten run-to-report cycles. Sartorius has emphasized live-cell kinetic imaging with the Incucyte CX3 platform, which is built for continuous analysis of 3D models with confocal imaging and high throughput. These approaches strengthen lock-in by tying validated assay workflows to proprietary analytics under GxP-aligned data controls.
Strategic moves focus on acquisitions that extend assay menus and on partnerships that link acquisition with downstream analytics and reporting. Sartorius has also supported startup access programs to seed early adoption of live-cell imaging and foster method development at young companies. Araceli has targeted ultra-fast timepoint-based imaging to open live-cell experiments at scale while maintaining resolution in high-content modes. Competitive differentiation is also moving into data layers that support privacy-preserving learning and adaptive illumination to reduce photodamage while still capturing rare cellular events. These themes fit enterprise procurement that values standardized, high-integrity image data and repeatable analysis across sites.
Over 2026, the Image-Based Cytometry in Cell Analysis Market continues to balance hardware innovation with analytic maturity, where software updates that expand model libraries or add compliance features can unlock more value than pure optics upgrades. Vendors with strong user support, clear audit features, and validated methods for potency testing and discovery assays are well placed to capture more spend across pharma and CRO channels. These features also smooth the path from research-only use toward regulated deployments that require complete records and traceability. As more programs adopt 3D models and live-cell kinetics, competitive wins will follow vendors that best balance throughput, image quality, phototoxicity control, and explainable AI.
Image-Based Cytometry In Cell Analysis Industry Leaders
Molecular Devices
Thermo Fisher Scientific
Beckman Coulter Life Sciences
Sartorius
Revvity
- *Disclaimer: Major Players sorted in no particular order

Recent Industry Developments
- March 2026: Sartorius unveiled its next-generation Eveo Cell Therapy Platform, designed to enhance the efficiency of producing autologous cell therapies. By integrating critical processes such as cell selection, activation, gene modification, expansion, washing, concentration, and final formulation into a unified closed system, the Eveo platform leverages a suite of Sartorius solutions, spanning from essential raw materials to advanced bioreactors and separation technologies. Its compact design seamlessly fits into existing facilities and workflows, operates in lower-classification environments, and accommodates both centralized and decentralized manufacturing models. Recognizing that quality control is a significant bottleneck in cell therapy production and release, the Eveo platform incorporates Sartorius’ expertise in live cell imaging and high-throughput flow cytometry, effectively addressing key analytical challenges and broadening accessibility.
- January 2025: Molecular Devices launched the ImageXpress HCS.ai High-Content Screening System with a fifth-generation architecture, faster acquisition, sCMOS detection, confocal capability, and integrated IN Carta AI analysis.


Global Image-Based Cytometry In Cell Analysis Market Report Scope
As per the report’s scope, image-based cytometry in cell analysis is a high-throughput technology that integrates digital microscopy with statistical flow cytometry. This enables the acquisition, segmentation, and analysis of brightfield or fluorescence images at the individual cell level. The technology provides visual verification and automated spatial measurements of cell populations. It also facilitates sub-cellular protein localization without requiring fluidics.
The image-based cytometry in cell analysis market is segmented into product, application, end user, and geography. Based on product, the market is segmented into instruments, consumables & reagents, software & image analysis, and services. Based on application, the market is segmented into drug discovery & development, advanced cell models, cell & gene therapy analytics, and clinical research & diagnostics. Based on end user, the market is segmented into pharmaceutical & biotechnology companies, academic & research institutes, CROs & CDMOs, and hospitals & clinical laboratories. By geography, the market is segmented as North America, Europe, Asia-Pacific, the Middle East and Africa, and South America. The market report also covers the estimated market sizes and trends for 17 countries across major regions globally. The report offers the value (in USD) for the above segments.
| Instruments |
| Consumables & Reagents |
| Software & Image Analysis |
| Services |
| Drug Discovery & Development |
| Advanced Cell Models |
| Cell & Gene Therapy Analytics |
| Clinical Research & Diagnostics |
| Pharmaceutical & Biotechnology Companies |
| Academic & Research Institutes |
| CROs & CDMOs |
| Hospitals & Clinical Laboratories |
| North America | United States |
| Canada | |
| Mexico | |
| Europe | Germany |
| United Kingdom | |
| France | |
| Italy | |
| Spain | |
| Rest of Europe | |
| Asia-Pacific | China |
| Japan | |
| India | |
| Australia | |
| South Korea | |
| Rest of Asia-Pacific | |
| Middle East and Africa | GCC |
| South Africa | |
| Rest of Middle East and Africa | |
| South America | Brazil |
| Argentina | |
| Rest of South America |
| By Product | Instruments | |
| Consumables & Reagents | ||
| Software & Image Analysis | ||
| Services | ||
| By Application | Drug Discovery & Development | |
| Advanced Cell Models | ||
| Cell & Gene Therapy Analytics | ||
| Clinical Research & Diagnostics | ||
| By End User | Pharmaceutical & Biotechnology Companies | |
| Academic & Research Institutes | ||
| CROs & CDMOs | ||
| Hospitals & Clinical Laboratories | ||
| By Geography | North America | United States |
| Canada | ||
| Mexico | ||
| Europe | Germany | |
| United Kingdom | ||
| France | ||
| Italy | ||
| Spain | ||
| Rest of Europe | ||
| Asia-Pacific | China | |
| Japan | ||
| India | ||
| Australia | ||
| South Korea | ||
| Rest of Asia-Pacific | ||
| Middle East and Africa | GCC | |
| South Africa | ||
| Rest of Middle East and Africa | ||
| South America | Brazil | |
| Argentina | ||
| Rest of South America | ||


Key Questions Answered in the Report
What is the Image Based Cytometry in Cell Analysis market size and growth outlook to 2031?
The Image Based Cytometry in Cell Analysis market size is expected to grow from USD 3.62 billion in 2025 to USD 6.68 billion by 2031 at a 10.9% CAGR over 2026-2031.
Which product categories are leading and growing fastest in this space?
Consumables & Reagents led with 58.51% revenue share in 2025, while Software & Image Analysis is projected to expand at a 12.89% CAGR during 2026-2031.
Which applications are most important for near-term adoption?
Drug Discovery & Development accounted for 48.78% in 2025, while Cell & Gene Therapy Analytics is expected to grow the fastest at a 12.08% CAGR through 2031.
Who are the primary end users driving demand in 2026?
Pharmaceutical & Biotechnology Companies remain the largest buyers, while CROs & CDMOs are the fastest-growing users as sponsors shift more imaging assays to external partners.
Which regions will drive the most incremental growth through 2031?
North America held 47.44% in 2025 and Asia-Pacific is projected to be the fastest-growing region with a 12.32% CAGR through 2031 based on ongoing investments and capability build-outs.
What capabilities matter most when selecting platforms for regulated workflows?
Buyers favor validated imaging assays, integrated AI analytics, and audit-ready data management that align with electronic records guidance for clinical investigations.
Page last updated on:


