Hospital Robots Market Size and Share
Market Overview
| Study Period | 2020 - 2031 |
|---|---|
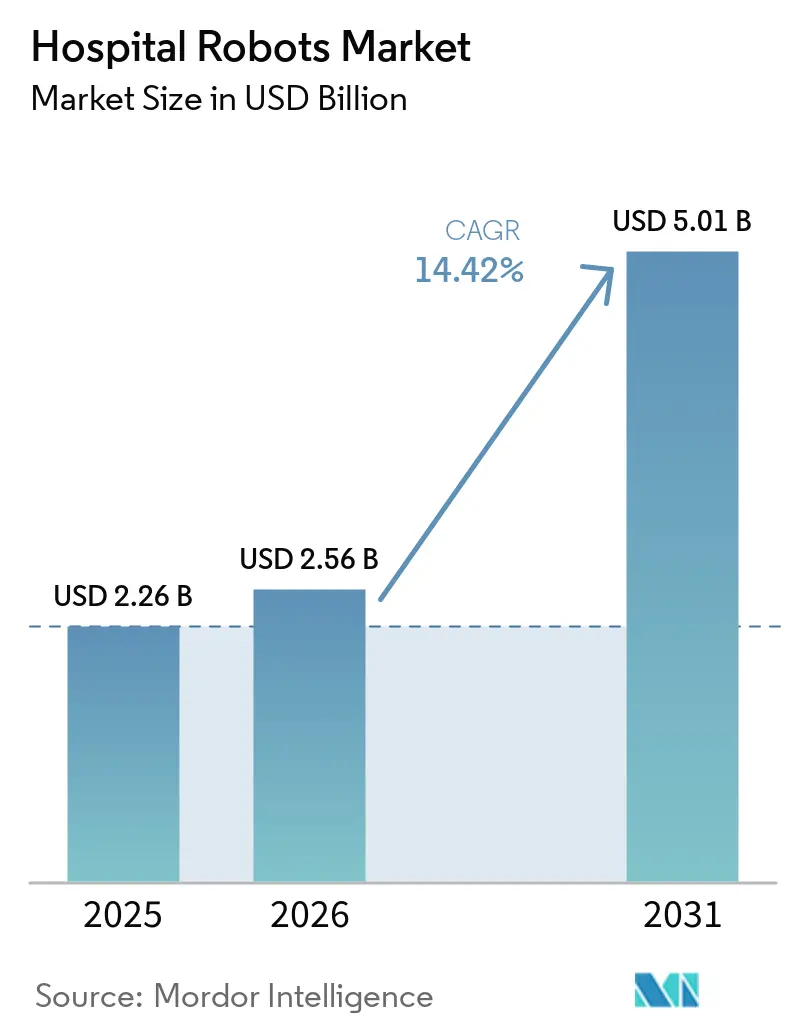
| Market Size (2026) | USD 2.56 Billion |
| Market Size (2031) | USD 5.01 Billion |
| Growth Rate (2026 - 2031) | 14.42% CAGR |
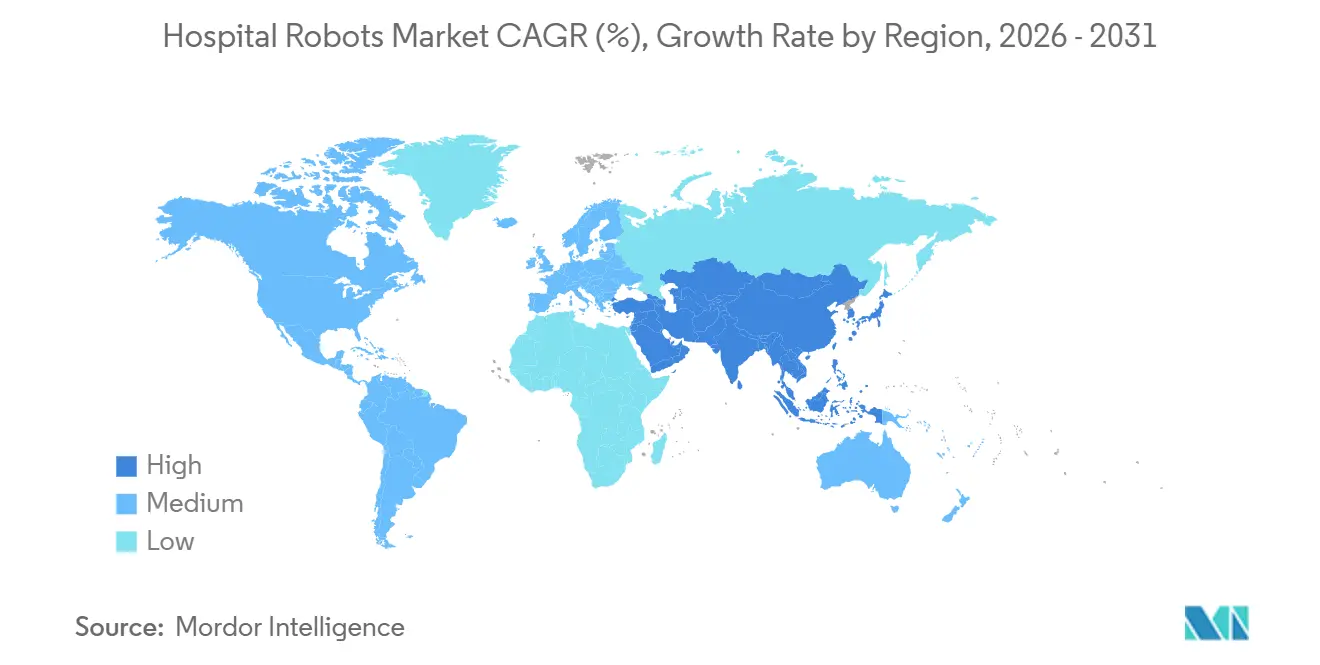
| Fastest Growing Market | Asia-Pacific |
| Largest Market | North America |
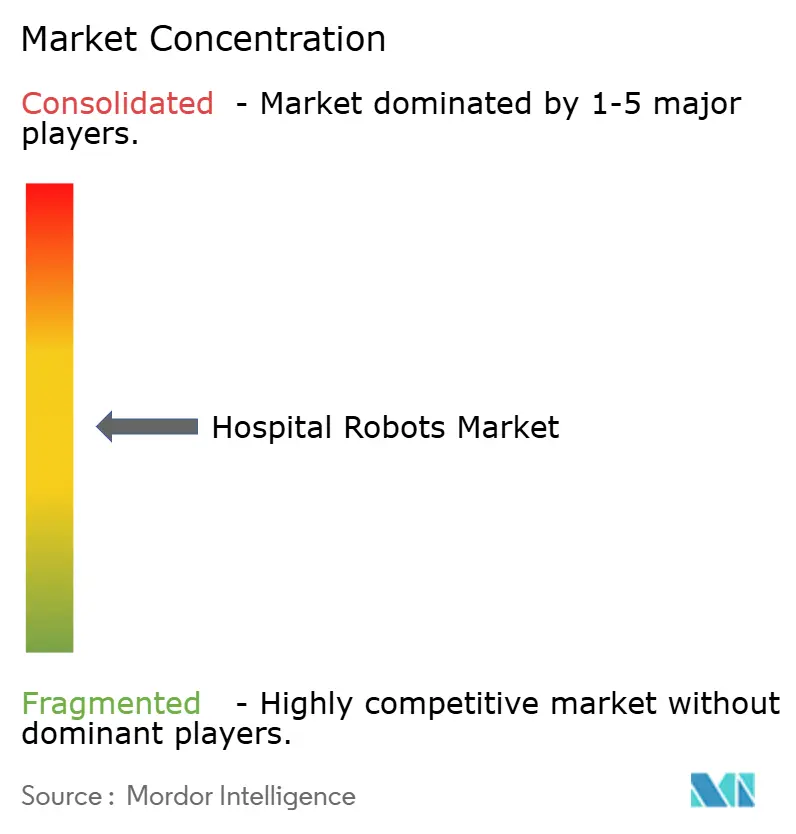
| Market Concentration | Medium |
Major Players *Disclaimer: Major Players sorted in no particular order Image © Mordor Intelligence. Reuse requires attribution under CC BY 4.0. | |
Hospital Robots Market Analysis by Mordor Intelligence
The Hospital Robots Market size is projected to be USD 2.26 billion in 2025, USD 2.56 billion in 2026, and reach USD 5.01 billion by 2031, growing at a CAGR of 14.42% from 2026 to 2031.
Steady procurement of surgical, logistics, and rehabilitation platforms continues despite tighter capital budgets, confirming that automation has moved from pilot projects to core clinical infrastructure. Demand aligns with three structural factors: rising procedure volumes among aging populations, widening nurse and technician shortages that lift wage bills, and proliferating regulatory incentives that reimburse value-based outcomes rather than unit activity. Vendors respond with smaller footprints, usage-based pricing, and embedded cybersecurity controls that answer hospital boards’ risk assessments. Equally important, maturing 5G connectivity now supports safe teleoperation beyond metropolitan hubs, extending robotics coverage to underserved regions and thereby enlarging the hospital robots market.
Key Report Takeaways
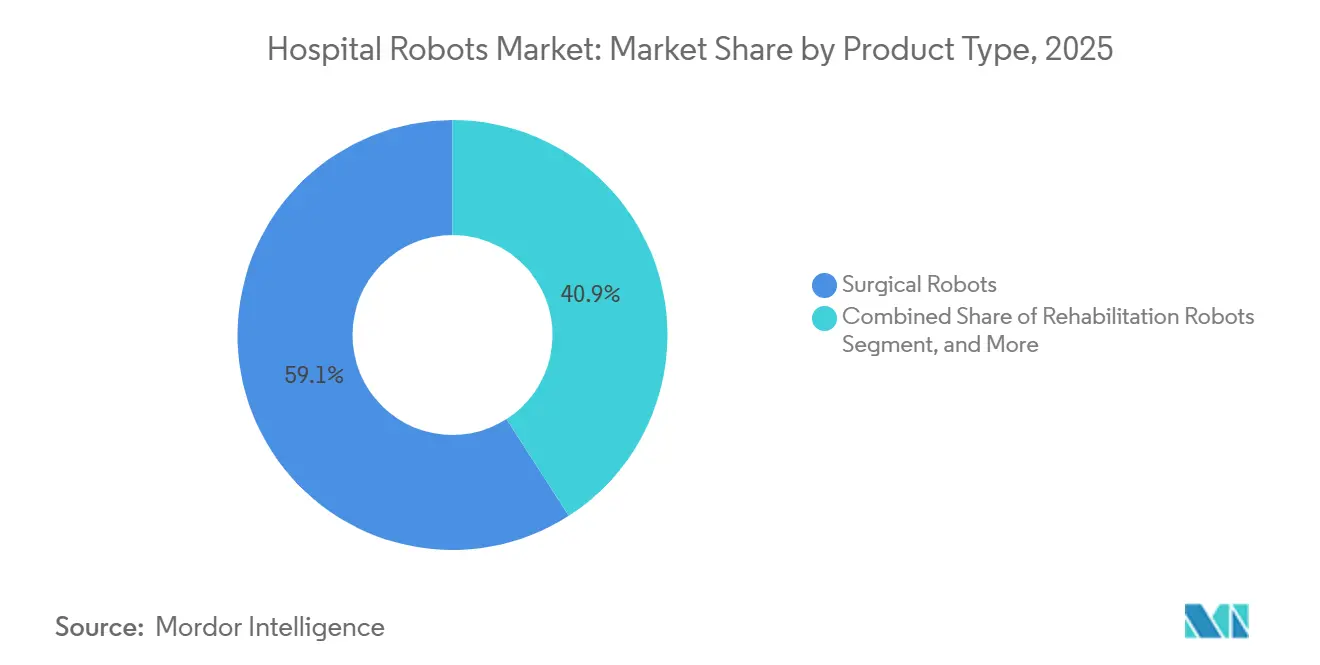
- By product type, surgical robots led with a 59.12% hospital robots market share in 2025; rehabilitation robots are forecast to expand at a 15.06% CAGR to 2031.
- By application, surgery commanded 47.38% of revenue in 2025, while rehabilitation is advancing at a 15.67% CAGR through 2031.
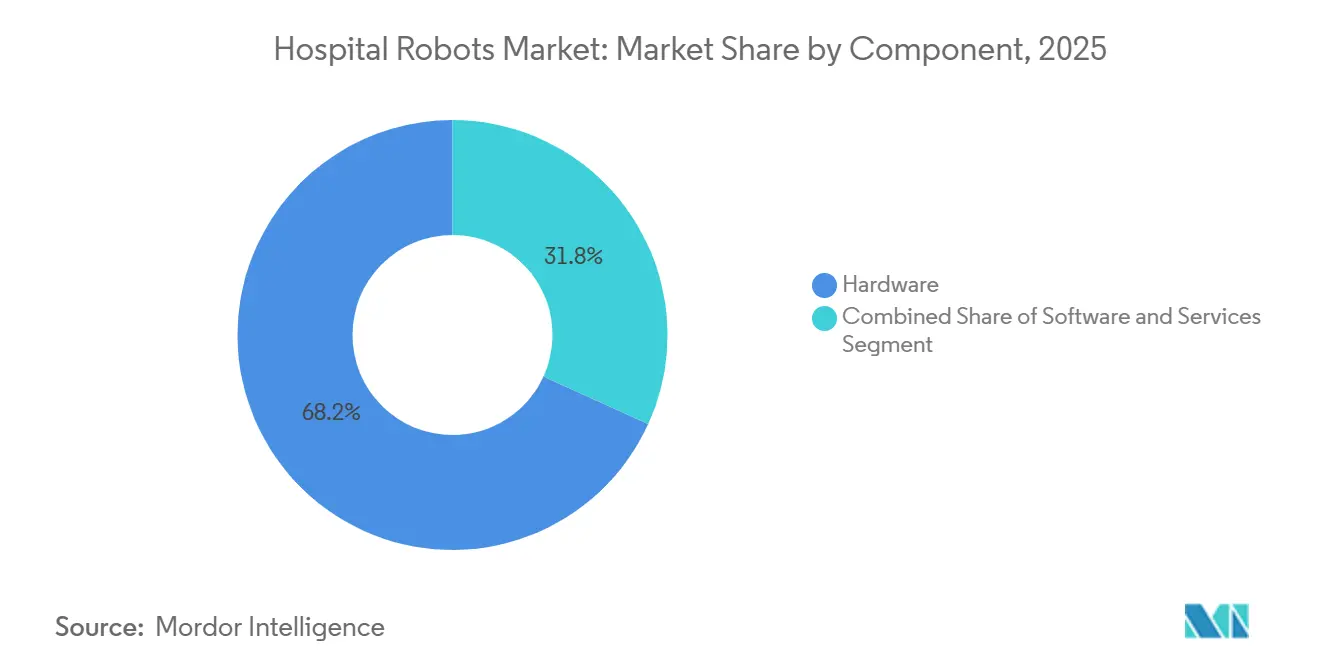
- By component, hardware accounted for 68.21% of the hospital robots market size in 2025, and software is projected to post a 14.96% CAGR over 2026-2031.
- By end user, general hospitals held 46.03% share in 2025, whereas rehabilitation centers are poised for 15.86% CAGR growth by 2031.
- By geography, North America captured 38.83% revenue in 2025; Asia-Pacific is projected to record a 16.14% CAGR to 2031.
Note: Market size and forecast figures in this report are generated using Mordor Intelligence’s proprietary estimation framework, updated with the latest available data and insights as of January 2026.
Global Hospital Robots Market Trends and Insights
Drivers Impact Analysis*
| Driver | (~) % Impact on CAGR Forecast | Geographic Relevance | Impact Timeline |
|---|---|---|---|
| Heightened Post-Pandemic Focus on Infection Control | +2.1% | Global, with early adoption in North America & Europe | Short term (≤ 2 years) |
| Rapid Adoption of Minimally-Invasive Surgery | +3.4% | North America, Europe, Asia-Pacific tier-1 cities | Medium term (2-4 years) |
| Shortage of Clinical Staff & Rising Labor Costs | +2.8% | Global, acute in North America & Western Europe | Long term (≥ 4 years) |
| Integration of 5G-Enabled Telerobotics | +1.6% | Asia-Pacific core, spill-over to Middle East | Medium term (2-4 years) |
| Hospital-At-Home Logistics Pilots Using Mobile Robots | +1.3% | North America, select EU markets | Medium term (2-4 years) |
| Growing Emphasis on Precision Medicine and Personalized Surgical Planning | +1.9% | North America, Europe, Japan | Long term (≥ 4 years) |
| Source: Mordor Intelligence | |||
Heightened Post-Pandemic Focus on Infection Control
Hospitals maintain UV-C disinfection budgets because automated cycles reduce pathogen loads in operating rooms and ICUs within minutes, trimming costly readmissions tied to surgical-site infections.[1]Xenex Disinfection Services, “LightStrike+,” xenex.com LightStrike+ has completed over 35 million cycles and provides ISO 15883-compliant audit logs that simplify Joint Commission reviews. Facilities that adopted the platform during COVID-19 report persistent usage as bundled payments penalize hospital-acquired infections. The FDA 510(k) clearance reassures biomedical engineers that routine maintenance fits existing protocols.[2]U.S. Food and Drug Administration, “FDA Authorizes Marketing of da Vinci 5 Surgical System,” fda.gov As capital budgets rebound, disinfection robots remain a visible first step toward wider hospital robots market deployment.
Rapid Adoption of Minimally Invasive Surgery
Intuitive Surgical’s da Vinci 5 adds force feedback and enhanced 3D vision, addressing earlier tactile gaps and enabling newly approved cardiac indications in 2026. Peer-reviewed studies still show mixed cost-outcome profiles, but faster patient recovery supports value-based contracts. Orthopedic programs mirror the trend; Stryker’s Mako platform surpassed 1.5 million knee and hip procedures in 2025, confirming scale potential when pathways standardize workflows.[3]Stryker Corporation, “Mako SmartRobotics,” stryker.com Together, these advances sustain double-digit growth for the hospital robots market as surgeons seek precision and patients demand smaller incisions.
Shortage of Clinical Staff and Rising Labor Costs
Vacancy rates above 15% in U.S. nursing units shift hospital priorities toward autonomous logistics. Moxi completed more than 1.25 million deliveries by late 2025, removing low-value trips and returning time to bedside care. OhmniLabs telepresence devices extend dietitians’ reach across multiple floors, cutting travel time by up to 40 minutes per consult. As wage pressure climbs, executives model three-year paybacks that now encompass service robots, propelling the broader hospital robots market.
Integration of 5G-Enabled Telerobotics
A multicenter Japanese trial maintained sub-10 ms latency during 50 km remote surgeries, meeting safety thresholds and demonstrating rural feasibility. China’s policy push places surgical robots into tier-2 cities, while regulators refine cross-border licensure standards. The capability widens specialist access without relocating clinicians, making 5G a catalyst for hospital robots market penetration beyond flagship institutions.
Restraints Impact Analysis*
| Restraint | (~) % Impact on CAGR Forecast | Geographic Relevance | Impact Timeline |
|---|---|---|---|
| High Capital Expenditure & ROI Concerns | -2.7% | Global, acute in price-sensitive markets | Short term (≤ 2 years) |
| Complex Regulatory & Credentialing Pathways | -1.5% | North America, Europe, Asia-Pacific | Medium term (2-4 years) |
| Cyber-Physical Security Vulnerabilities | -0.9% | Global, heightened in networked environments | Medium term (2-4 years) |
| Shortage of Skilled Robotics Technicians & Maintenance Support | -1.2% | Emerging markets, rural areas | Long term (≥ 4 years) |
| Source: Mordor Intelligence | |||
High Capital Expenditure and ROI Concerns
Acquisition prices ranging from USD 1 million to USD 2.5 million deter hospitals operating on single-digit margins. A Baird survey found 77% of executives rank ROI validation as the top purchasing criterion, and 71% still rely on retained earnings for funding. Usage-based leases from Intuitive Surgical and Stryker reduce upfront cash but shift utilization risk to vendors. Absent distinct DRG codes, facilities bundle robotic costs into existing reimbursements, favoring high-volume centers and limiting near-term hospital robots market adoption among mid-tier providers.
Complex Regulatory and Credentialing Pathways
FDA Section 524B requires a software bill of materials and vulnerability management plans, elongating submission files and boosting compliance expenses. Europe’s Medical Device Regulation imposes additional clinical evidence and post-market surveillance, extending launch timelines by 12-18 months. Surgeon credentialing remains fragmented because specialty societies have yet to mandate uniform curricula. These layers collectively delay commercialization and slow hospital robots market growth.
*Our forecasts treat driver/restraint impacts as directional, not additive. The impact forecasts reflect baseline growth, mix effects, and variable interactions.
Segment Analysis
By Product Type: Surgical Dominance Meets Rehabilitation Momentum
Surgical robots contributed 59.12% revenue in 2025, benefiting from an installed base of more than 8,000 da Vinci systems and accelerating orthopedic adoption driven by Mako’s 1.5 million procedures. Rehabilitation platforms are on track for 15.06% CAGR through 2031, fueled by aging demographics and payers that recognize cost savings from robotic gait therapy. This pocket outpaces the overall hospital robots market CAGR as stroke and spinal cord injury prevalence rise.
Price competition intensifies as Johnson & Johnson’s Ottava table-integrated design enters FDA review, promising reduced footprint costs. Service and logistics units such as Moxi and Aethon’s TUG diversify revenue by automating specimen, linen, and meal transport. Disinfection and telepresence robots remain niche yet strategic, anchoring infection prevention and remote consultation programs that feed the evolving hospital robots market.


By Application: Surgery Leads Rehabilitation Accelerates
Surgery retained 47.38% share in 2025 because robotic prostatectomy, hysterectomy, and colorectal resections command premium reimbursement. Rehabilitation, projected at 15.67% CAGR, gains traction as insurers accept outpatient exoskeleton therapy and home use following ReWalk 7 clearance in 2025.
Logistics-delivery volumes rise as pharmacy runs shift to Moxi, freeing nursing time and reducing medication turnaround intervals. Cleaning deployments persist post-pandemic as LightStrike+ supports infection-control metrics. Remote engagement remains modest yet expands coverage for dietetic and specialist consults. Together, these indications broaden the hospital robots market beyond the operating suite.
By Component: Hardware Dominates Software Gains
Hardware held 68.21% of 2025 revenue because robotic arms, sensors, and consoles carry high invoice prices, locking in the largest share of the hospital robots market size. Software grows at 14.96% CAGR as AI-enabled planning and predictive maintenance migrate value toward subscription models, generating recurring income streams.
Intuitive Surgical’s cloud analytics forecast instrument wear, and Stryker’s planning algorithms optimize implant placement, exemplifying how software deepens customer lock-in. Services bundles covering installation, training, and 24-hour maintenance underpin uptime-critical programs, reinforcing vendor relationships and smoothing annual budgets.
By End User: General Hospitals Anchor Rehabilitation Centers Surge
General hospitals owned 46.03% share in 2025 by virtue of broad service lines and multi-specialty robotics programs. Rehabilitation centers, however, will post a 15.86% CAGR, reflecting demand for robotic gait therapy in post-acute pathways. Specialty hospitals, particularly orthopedic centers, compress payback periods by concentrating joint replacements on dedicated Mako and Rosa systems.
Ambulatory surgical centers adopt compact or handheld robots such as Mako RPS, cleared in 2026, enabling partial knee arthroplasty without full console investments. Other facilities, including long-term care providers, pilot telepresence and portable rehab devices, are expanding the total addressable hospital robots market.
Geography Analysis
North America contributed 38.83% revenue in 2025, underpinned by favorable reimbursement and a deep installed base. Saturation appears in large urban systems, so growth tilts toward ambulatory sites and community hospitals upgrading to compact systems. Canada trails the United States because provincial budgets limit capital purchases, while Mexico sees sporadic private installations.
Asia-Pacific advances at 16.14% CAGR through 2031, supported by China’s provincial grants that install surgical robots in tier-2 cities and Japan’s 5G teleoperation rollouts that bridge rural gaps. India’s private groups invest in da Vinci and Mako units to capture inbound medical tourism, lifting hospital robots market penetration.
Europe grows steadily despite longer approval cycles under MDR. Germany, France, and the United Kingdom lead deployments, whereas Southern and Eastern markets adopt at a slower rate. The Middle East and South America remain in the early stages but display strategic pilots in Gulf Cooperation Council hospitals and Brazilian academic centers that prove clinical worth and inform future scaling.

Competitive Landscape
Intuitive Surgical retains a hold of the surgical segment by leveraging over 8,000 installed da Vinci systems and continuous software upgrades. Orthopedic leaders Stryker, Zimmer Biomet, and Smith & Nephew erode share by offering differentiated joint-specific robots with lower acquisition costs and strong clinical pathways.
Service-robot specialists Diligent Robotics, Aethon, and Swisslog implement high-volume logistics programs, while rehabilitation innovators such as ReWalk and Ekso Bionics target expanding neuro-rehab populations. Johnson & Johnson positions Ottava for entry in 2027 pending FDA clearance, banking on a table-integrated design that minimizes footprint and accelerates OR turnarounds. Early adopters prioritize platforms that exhibit secure connectivity per FDA Section 524B and IEC 62443 standards, after Cynerio revealed critical vulnerabilities in TUG units in 2024.
Subscription pricing, modular upgrades, and AI-enabled decision support differentiate vendors amid tightening budgets. Those providing quantifiable outcome data, seamless EHR integration, and transparent total cost of ownership will consolidate gains as the hospital robotics market matures.
Hospital Robots Industry Leaders
Intuitive Surgical Inc.
Johnson & Johnson
Medtronic
ReWalk Robotics Ltd.
Siemens Healthineers AG
- *Disclaimer: Major Players sorted in no particular order

Recent Industry Developments
- February 2026: Stryker received FDA clearance for Mako RPS handheld robotics for partial knee arthroplasty.
- January 2026: Johnson & Johnson submitted a de novo FDA application for Ottava, a table-integrated 4-arm surgical robot aimed at upper abdominal procedures.
- January 2026: Intuitive Surgical secured FDA approval for cardiac applications on da Vinci 5, extending reach into mitral valve repair.
- October 2025: Diligent Robotics launched Moxi 2.0 with NVIDIA IGX Thor compute, targeting deployment of 15 units per site by 2030.


Global Hospital Robots Market Report Scope
Hospital robots refer to the deployment of robotic systems and automated technologies specifically designed to operate within hospital environments. These robots support a wide range of non-surgical and semi-clinical tasks aimed at improving operational efficiency, reducing staff workload, enhancing infection control, and optimizing hospital logistics.
The hospital robots market is segmented by product type, application, component, end user, and geography. By product type, the market is segmented into surgical robots, rehabilitation robots, service & logistics robots, disinfection robots, telepresence robots, and pharmacy automation robots. By application, the market is segmented into surgery, rehabilitation, logistics & supply delivery, cleaning & disinfection, patient engagement & monitoring, and medication dispensing. By component, the market is segmented into hardware, software, and services. By end user, the market is segmented into general hospitals, specialty hospitals, ambulatory surgical centers, rehabilitation centers, other end users, and geography, the market is segmented into North America, Europe, Asia-Pacific, Middle East & Africa, and South America. The market forecasts are provided in terms of value (USD).
| Surgical Robots |
| Rehabilitation Robots |
| Service & Logistics Robots |
| Disinfection Robots |
| Telepresence Robots |
| Pharmacy Automation Robots |
| Surgery |
| Rehabilitation |
| Logistics & Supply Delivery |
| Cleaning & Disinfection |
| Patient Engagement & Monitoring |
| Medication Dispensing |
| Hardware |
| Software |
| Services |
| General Hospitals |
| Specialty Hospitals |
| Ambulatory Surgical Centers |
| Rehabilitation Centers |
| Other End Users |
| North America | United States |
| Canada | |
| Mexico | |
| Europe | Germany |
| United Kingdom | |
| France | |
| Italy | |
| Spain | |
| Rest of Europe | |
| Asia-Pacific | China |
| Japan | |
| India | |
| Australia | |
| South Korea | |
| Rest of Asia-Pacific | |
| Middle East & Africa | GCC |
| South Africa | |
| Rest of Middle East & Africa | |
| South America | Brazil |
| Argentina | |
| Rest of South America |
| By Product Type | Surgical Robots | |
| Rehabilitation Robots | ||
| Service & Logistics Robots | ||
| Disinfection Robots | ||
| Telepresence Robots | ||
| Pharmacy Automation Robots | ||
| By Application | Surgery | |
| Rehabilitation | ||
| Logistics & Supply Delivery | ||
| Cleaning & Disinfection | ||
| Patient Engagement & Monitoring | ||
| Medication Dispensing | ||
| By Component | Hardware | |
| Software | ||
| Services | ||
| By End User | General Hospitals | |
| Specialty Hospitals | ||
| Ambulatory Surgical Centers | ||
| Rehabilitation Centers | ||
| Other End Users | ||
| By Geography | North America | United States |
| Canada | ||
| Mexico | ||
| Europe | Germany | |
| United Kingdom | ||
| France | ||
| Italy | ||
| Spain | ||
| Rest of Europe | ||
| Asia-Pacific | China | |
| Japan | ||
| India | ||
| Australia | ||
| South Korea | ||
| Rest of Asia-Pacific | ||
| Middle East & Africa | GCC | |
| South Africa | ||
| Rest of Middle East & Africa | ||
| South America | Brazil | |
| Argentina | ||
| Rest of South America | ||


Key Questions Answered in the Report
How large is the hospital robots market in 2026 and what CAGR is expected to 2031?
The hospital robots market size is USD 2.26 billion in 2026 and is projected to reach USD 5.01 billion by 2031 at a 14.42% CAGR.
Which product type leads hospital robotic revenues today?
Surgical robots hold 59.12% of 2025 revenue owing to established da Vinci and Mako installations.
What is the fastest growing application area for hospital robots?
Rehabilitation is forecast to expand at a 15.67% CAGR through 2031 as payers adopt robotic gait and upper-limb therapy.
Which region will post the highest growth in hospital robotics to 2031?
Asia-Pacific is expected to grow at 16.14% CAGR through 2031, propelled by China, Japan, and India.
How does high capital expenditure restrain adoption?
Robots cost USD 1 million to USD 2.5 million, and 77% of executives demand clear ROI, so many hospitals delay purchases despite clinical benefits.
Page last updated on:


