
Home Spirometer Market Size and Share
Market Overview
| Study Period | 2021 - 2032 |
|---|---|
| Market Size (2027) | USD 196.77 Million |
| Market Size (2032) | USD 290.60 Million |
| Growth Rate (2027 - 2032) | 8.11 % |
| Fastest Growing Market | Asia-Pacific |
| Largest Market | North America |
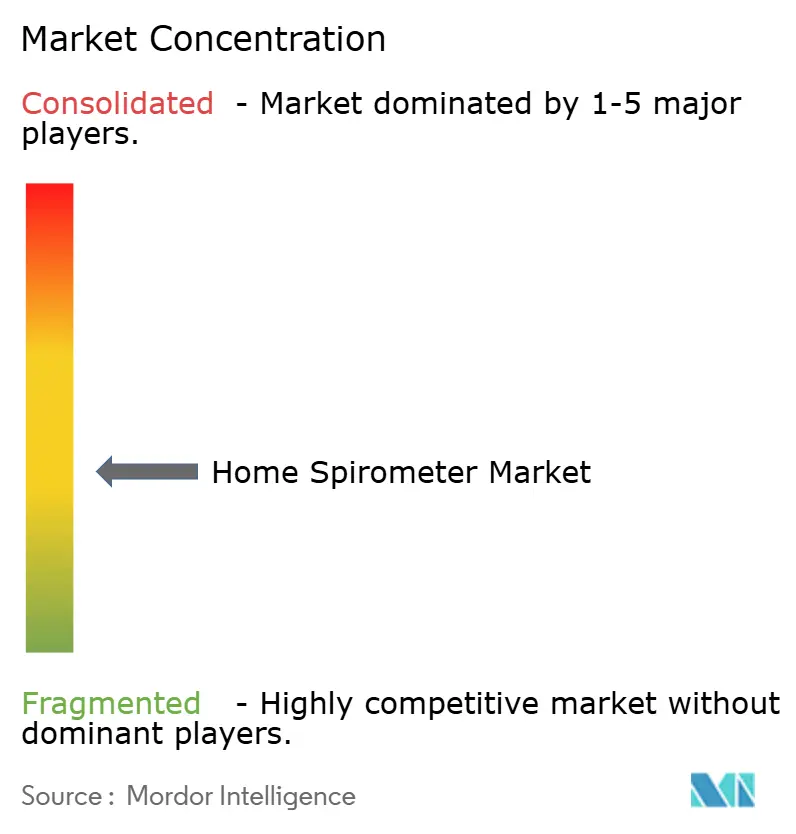
| Market Concentration | Medium |
Major Players *Disclaimer: Major Players sorted in no particular order Image © Mordor Intelligence. Reuse requires attribution under CC BY 4.0. | |
Home Spirometer Market Analysis by Mordor Intelligence
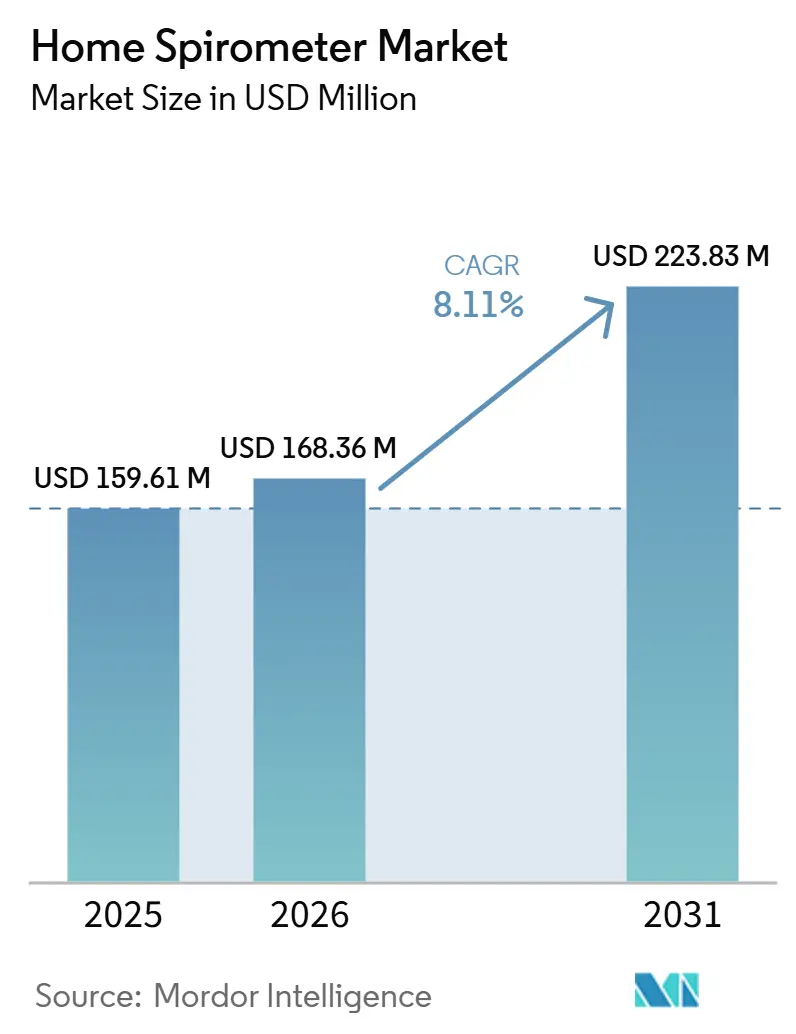
The Home Spirometer Market size was valued at USD 182.01 million in 2026 and is estimated to grow from USD 196.77 million in 2027 to reach USD 290.60 million by 2032, at a CAGR of 8.11% during the forecast period (2027-2032).
The disease burden supporting this demand remains substantial, with COPD causing 3.4 million deaths in 2023 and asthma affecting 363 million people worldwide, which keeps the long-run need for home pulmonary monitoring firmly in place. The home spirometer market is also benefiting from a broader shift toward home-based care, where patients, clinicians, and health systems increasingly expect respiratory monitoring to take place outside hospital settings when device quality and training are adequate. Competitive priorities are moving toward connected devices, remote data flow, and software-led follow-up, which is why wireless and direct-to-consumer models are advancing faster than legacy channels inside the home spirometer market. Compliance demands are rising at the same time, especially for cloud-connected products, as formal cybersecurity guidance for telehealth smart home integration now places more attention on connected home medical devices. The result is a market that still has room for growth through new care models and digital features, while competition remains active across established respiratory device makers and newer platform-led participants.
Key Report Takeaways
- By product type, handheld spirometers held 57.84% of the home spirometer market share in 2026, while portable wireless spirometers are projected to grow at a 8.21% CAGR through 2032.
- By technology, flow-based spirometers accounted for 54.63% share of the home spirometer market size in 2026, while Bluetooth/Wi-Fi-enabled spirometers are forecast to expand at an 8.34% CAGR through 2032.
- By application, chronic obstructive pulmonary disease management represented 40.42% share of the home spirometer market size in 2026, while asthma monitoring is expected to advance at a 9.08% CAGR through 2032.
- By distribution channel, hospital pharmacies captured 41.57% share of the home spirometer market size in 2026, while online pharmacies are projected to grow at an 9.76% CAGR through 2032.
- By geography, North America held 40.26% share of the home spirometer market size in 2026, while Asia-Pacific is forecast to record the highest CAGR at 10.52% through 2032.
Note: Market numbers in this report are based on Mordor Intelligence's proprietary estimation framework, which combines nine months of actuals with Q4 projections for base year 2026.
Market Trends and Insights
Drivers Impact Analysis of Home Spirometer Market*
| Driver | (~) % Impact on CAGR Forecast | Geographic Relevance | Impact Timeline |
|---|---|---|---|
| Rising Home-Based Respiratory Monitoring Adoption | +1.2% | Global, concentrated in North America and Western Europe | Short term (≤ 2 years) |
| Rising COPD and Asthma Prevalence | +1.0% | Global, highest incidence in APAC and LMIC | Medium term (2-4 years) |
| Telehealth Integration with Remote Spirometry Workflows | +0.8% | North America and EU, spill-over to APAC | Short term (≤ 2 years) |
| Consumerization of Connected Respiratory Devices | +0.5% | North America and EU | Medium term (2-4 years) |
| AI-Enabled Trend Detection in Longitudinal Lung-Function Data | +0.4% | Global, early gains in North America and East Asia | Long term (≥ 4 years) |
| Subscription-Based Monitoring and Clinical Follow-Up Models | +0.3% | North America and EU, early pilots in APAC | Medium term (2-4 years) |
| Source: Mordor Intelligence | |||
Rising Home-Based Respiratory Monitoring Adoption
Growing patient and clinician acceptance of home respiratory monitoring is widening the addressable population in the home spirometer market beyond confirmed chronic cases to include newly diagnosed, post-acute, and preventive users. Post-COVID lung recovery needs, broader home healthcare adoption, and pressure on outpatient respiratory services have pushed spirometry closer to routine home use rather than occasional clinic use. A September 2025 study in npj Primary Care Respiratory Medicine found that unsupervised home spirometry in adults showed strong agreement with in-clinic measurements when users received basic training, which directly supports prescribing confidence in home settings.[1] Demand is now forming more often at the patient level, and this changes how quickly devices move from purchase to regular use in the home spirometer market. That shift lowers adoption friction for newer device formats because patients no longer depend as heavily on specialist referral before trying home monitoring.
Rising COPD and Asthma Prevalence
A 2024 Respiratory Research analysis of the GBD 2021 dataset estimated 213.4 million prevalent COPD cases worldwide, which leaves a large under-monitored population for the home spirometer market, especially in low- and middle-income settings.[2] The same demand pattern is reinforced by WHO data showing 363 million people living with asthma in 2023, which expands the pool of users who can benefit from repeat lung-function checks outside clinics. A 2025 study in Frontiers in Pediatrics also supported home telespirometry in pediatric asthma, with interclass correlation coefficients above 0.9, which reduces clinical hesitation in one of the faster-moving care settings.[3]As COPD and asthma spread across younger and more digitally engaged groups in some urban settings, the home spirometer market is gaining users who are more willing to self-manage through connected devices. Disease burden documentation is also giving health systems a clearer basis for portable spirometry programs, which supports demand beyond short-term procurement cycles.
Telehealth Integration with Remote Spirometry Workflows
Telehealth is changing the home spirometer market by turning spirometry from an occasional test into a recurring data stream that can be reviewed remotely. Once spirometry feeds into telehealth platforms and digital records through standardized interfaces, the practical gap between home use and clinic use becomes less about access and more about workflow design. The home spirometer market therefore benefits not only from more device shipments, but also from more frequent use per patient when spirometry is embedded in remote care programs. This progression supports a competitive shift toward vendors that can deliver both hardware and a repeatable monitoring workflow rather than a standalone testing device.
AI-Enabled Trend Detection in Longitudinal Lung-Function Data
Artificial intelligence is starting to redefine the home spirometer market by turning isolated readings into longitudinal pattern recognition tools. In April 2025, TytoCare became the first company to receive FDA clearance for AI-based detection of wheezes, crackles, and rhonchi, which shows how home respiratory assessment is moving toward broader interpretation layers. This direction matters because connected devices with interpretation support can form a premium tier inside the home spirometer market even when core measurement accuracy is already acceptable. It also raises the value of formal Software as a Medical Device compliance, because clinical-grade AI claims now depend as much on regulatory standing as on algorithm performance.
Restraints Impact Analysis of Home Spirometer Market*
| Restraint | (~) % Impact on CAGR Forecast | Geographic Relevance | Impact Timeline |
|---|---|---|---|
| Inconsistent Patient Technique and Test Reliability | -0.5% | Global, most acute in LMIC and primary care settings | Medium term (2-4 years) |
| Reimbursement Fragmentation Across Care Settings | -0.6% | APAC core, MEA, South America | Medium term (2-4 years) |
| Low Clinical Confidence in Unsupervised Use Cases | -0.4% | Global | Short term (≤ 2 years) |
| Cybersecurity and Data-Interoperability Friction in Connected Devices | -0.3% | North America and EU, spill-over as telehealth scales | Long term (≥ 4 years) |
| Source: Mordor Intelligence | |||
Inconsistent Patient Technique and Test Reliability
Technique dependence remains a clear restraint for the home spirometer market because the value of each reading still depends heavily on how well the patient performs the test. A 2025 randomized controlled trial in JMIR Formative Research found that virtual and self-directed training produced spirometry measurements statistically equivalent to face-to-face teaching, but the authors also noted that home readings can still differ from gold-standard clinic measurements. Manufacturers therefore need guided onboarding and coaching tools, not just device hardware, if they want home readings to remain clinically useful over longer periods.
Reimbursement Fragmentation Across Care Settings
Reimbursement fragmentation still limits the home spirometer market because many of the countries with high respiratory disease burden do not yet offer structured funding for home-use devices. OECD care settings generally have clearer payment pathways for spirometry, while many emerging markets still push patients toward out-of-pocket spending, which weakens regular use even when device availability improves. The problem is structural rather than temporary because health systems need device approval, payment rules, and clinical workflow integration to move at the same pace before home spirometry can scale widely. This uneven alignment slows adoption across the home spirometer market even when clinical need is clear from disease burden and telehealth readiness. It also favors companies that can support health systems with compliance, training, and software integration, rather than relying only on device sales.
*Our forecasts treat driver/restraint impacts as directional, not additive. The impact forecasts reflect baseline growth, mix effects, and variable interactions.
Home Spirometer Market Segment Analysis
By Product Type:
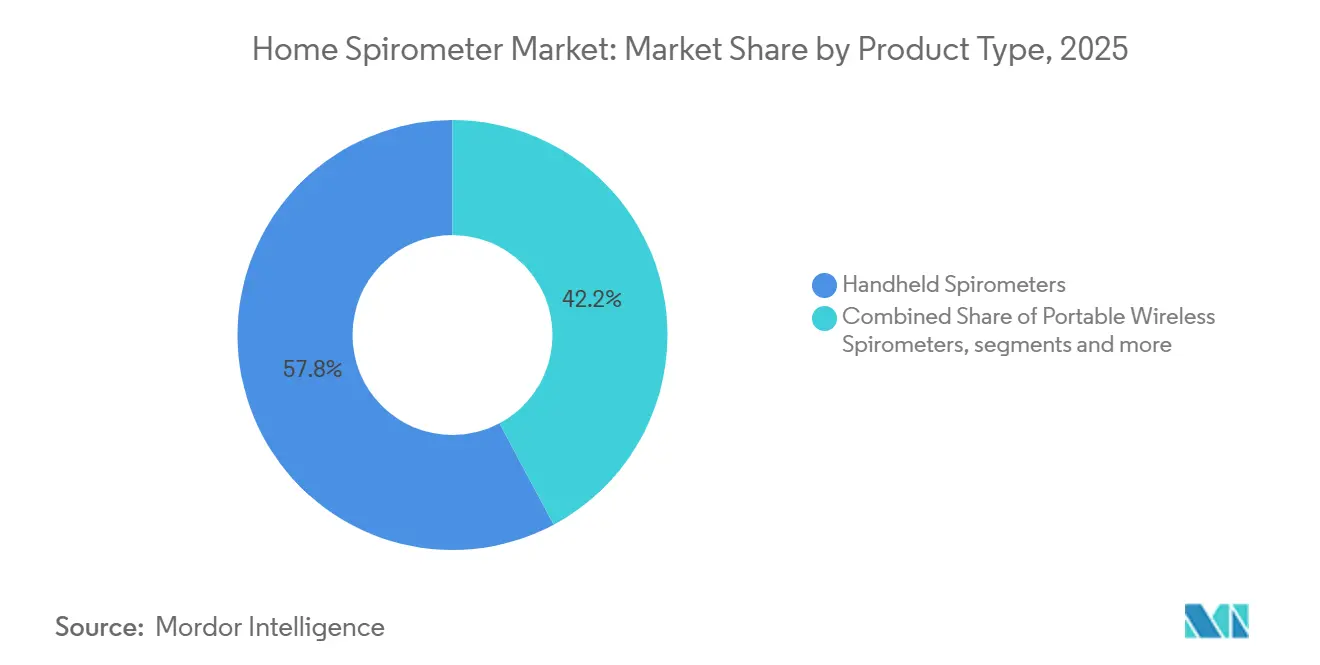
Handheld Devices Anchor Volume, Wireless Portability Narrows the Structural GapHandheld spirometers held 57.84% of the segment in 2026, which made them the leading product category in the home spirometer market. Their position reflects a long record of clinical validation, compact formats that suit single-user home operation, and more familiar procurement pathways than newer device types. This base was reinforced by compliance expectations that were first built around handheld measurement standards, which gave the category a practical head start in both clinician acceptance and reimbursement readiness. Portable wireless spirometers are forecasted to grow at a 8.21% CAGR from 2027 to 2032 as remote data transfer becomes part of routine respiratory follow-up in the home spirometer market. That growth shows that product value is moving beyond the test itself and toward how quickly data can reach clinicians, care teams, and digital care platforms.
Smartphone-linked products still hold a smaller base, but they are gaining relevance where patients already use personal mobile hardware and where clinicians want simpler logistics for remote use. In practical terms, patients want a device that is easy to carry and easy to use, while clinicians want a device that can fit established care and documentation standards. These needs are no longer mutually exclusive, which strengthens adoption prospects for mixed-format products. The product type structure in the home spirometer market therefore still favors handheld devices today, but it is moving toward a more blended model built around portability, connectivity, and workflow fit.

By Technology:
Flow-Based Measurement Holds Core Certification, Connected Platforms Redefine Competitive ValueFlow-based spirometers led the technology mix with 54.63% share in 2026, which kept them at the center of the home spirometer market. Their advantage comes from established accuracy in measuring FEV1 and FVC, which are the core spirometric values used in major respiratory care guidelines. Mature supply chains for turbine and pneumotachograph sensors also support cost control and wide deployment across institutional and retail channels. Bluetooth/Wi-Fi-enabled spirometers are projected to grow at an 8.34% CAGR from 2027 to 2032, which shows how connectivity is becoming a stronger purchase criterion in the home spirometer market. Buyers increasingly value devices that can measure lung function and send results into telehealth or remote patient monitoring systems without extra steps.
Volume-based spirometers still retain value where calibration stability matters over long use periods, especially in protocol-driven monitoring and clinical research settings. The home spirometer industry is therefore moving toward connected versions of multiple sensor types rather than replacing one technology family with another. A flow-based or ultrasonic device can both be attractive if the software layer, battery design, and integration features meet clinical needs. For that reason, manufacturers with experience across both hardware and digital validation are in a stronger position as the home spirometer market places more weight on connected performance. The technology segment still begins with sensor credibility, but it now ends with how well that sensor fits a broader remote care system.
By Application:
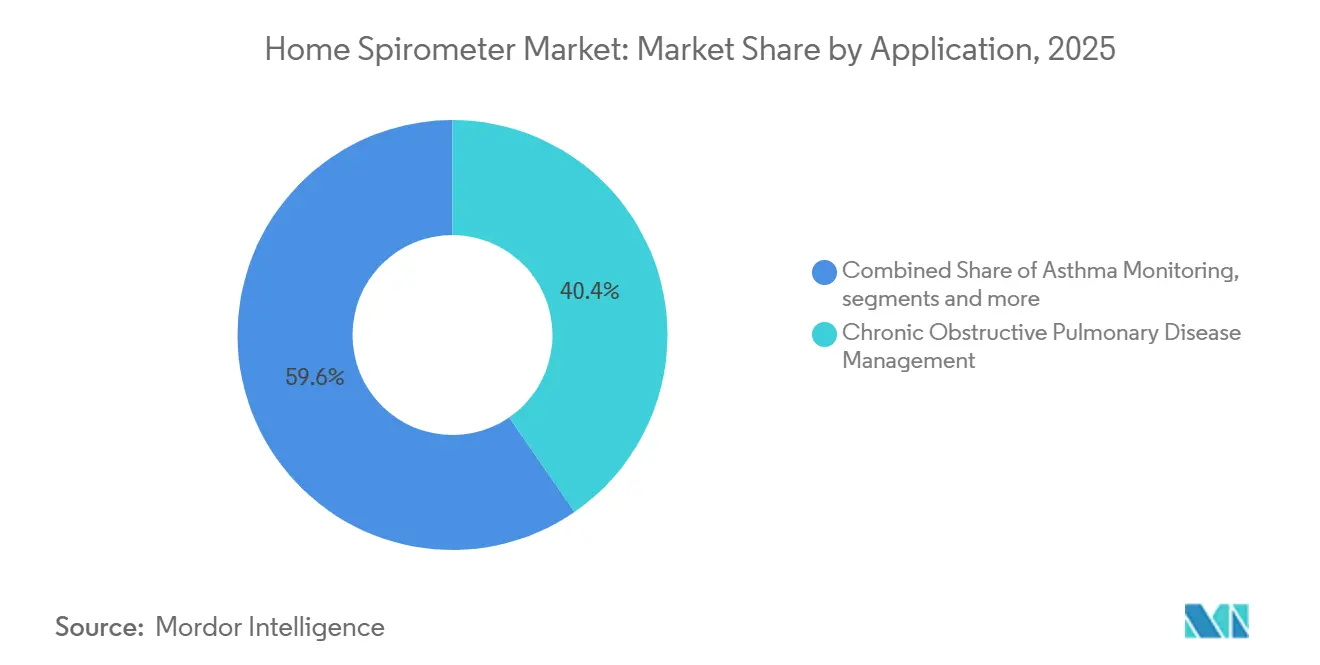
COPD Establishes the Revenue Base, Asthma Monitoring Commands Highest GrowthChronic obstructive pulmonary disease management monitoring held 40.42% share in 2026, making it the largest application in the home spirometer market. Its lead reflects the central role of spirometry in COPD diagnosis, staging, and management, which gives repeat home monitoring a clear clinical purpose over a long disease course. Asthma monitoring is forecasted to grow at a 9.08% CAGR through 2032, supported by a younger user base, stronger digital comfort, and a more flexible home-use environment for connected care. This split gives the home spirometer market a stable revenue base in COPD and a higher-growth path in asthma.
A broader wellness and postoperative recovery application is also beginning to attract visible innovation attention. Airalux Medical’s digital incentive spirometer won the ATS 2025 BEAR Cage Competition, which showed that respiratory monitoring beyond chronic disease management is drawing industry recognition. That emerging category still lacks the same standardized remote protocols seen in COPD and asthma care, so adoption is not yet as structured. Even so, the growing availability of home-capable devices makes it easier for providers to consider postoperative pulmonary follow-up outside hospitals. This leaves the home spirometer market with a clear application hierarchy today and a meaningful future option in recovery-focused monitoring.
By Distribution Channel:
Hospital Networks Define the Core, Digital Commerce Reshapes Patient AccessHospital pharmacies held 41.57% of the segment in 2026, which kept them as the leading distribution route in the home spirometer market. This channel remained strong because many purchases still began with a clinician recommendation at the point of care, which helped ensure product appropriateness and patient confidence. Online pharmacies are forecasted to grow at an 9.76% CAGR through 2032, making them the fastest-growing channel in the home spirometer market. Their rise reflects lower purchase friction, stronger direct-to-consumer health behavior, and wider comfort with ordering connected medical products through digital platforms.
Retail pharmacies continue to serve an important middle ground because they combine wider consumer access with some proximity to traditional healthcare purchasing habits. This matters in locations where home delivery infrastructure or digital health literacy is still uneven. The greatest strategic change is that direct digital sales can support recurring revenue models that are harder to build through institutional intermediaries. Direct channels also give manufacturers first-hand usage data, which improves their ability to refine software, patient coaching, and AI-driven features over time. For that reason, the home spirometer market is not only changing where devices are sold, but also how companies build ongoing relationships with users after purchase.
Geography Analysis
North America Home Spirometer Market
North America held 40.26% of the home spirometer market share in 2026, which made it the largest regional contributor. The region benefited from a mature telehealth environment, a large diagnosed patient pool, and established regulatory pathways for home-use respiratory devices. Clinical scale-up also looks more workable in North America because the 2025 REACH-SPIRO trial found that virtual and face-to-face home spirometry training produced equivalent measurement outcomes, which supports broader use in dispersed patient populations. Canada and Mexico remain part of the regional opportunity, but adoption is still less mature than in the United States because coverage and system-level rollout are less developed.
Europe Home Spirometer Market
Europe remained one of the most important regions for the home spirometer market because chronic respiratory disease burden stayed high and compliance standards remained stringent. The EU MDR transition raised expectations for portable respiratory devices, which filtered the field toward manufacturers with stronger regulatory depth. The United Kingdom and Germany remained the clearest reference points in Europe because they are most directly associated with established home spirometry use and telehealth-enabled care pathways.
South America, APAC and MEA Home Spirometer Market
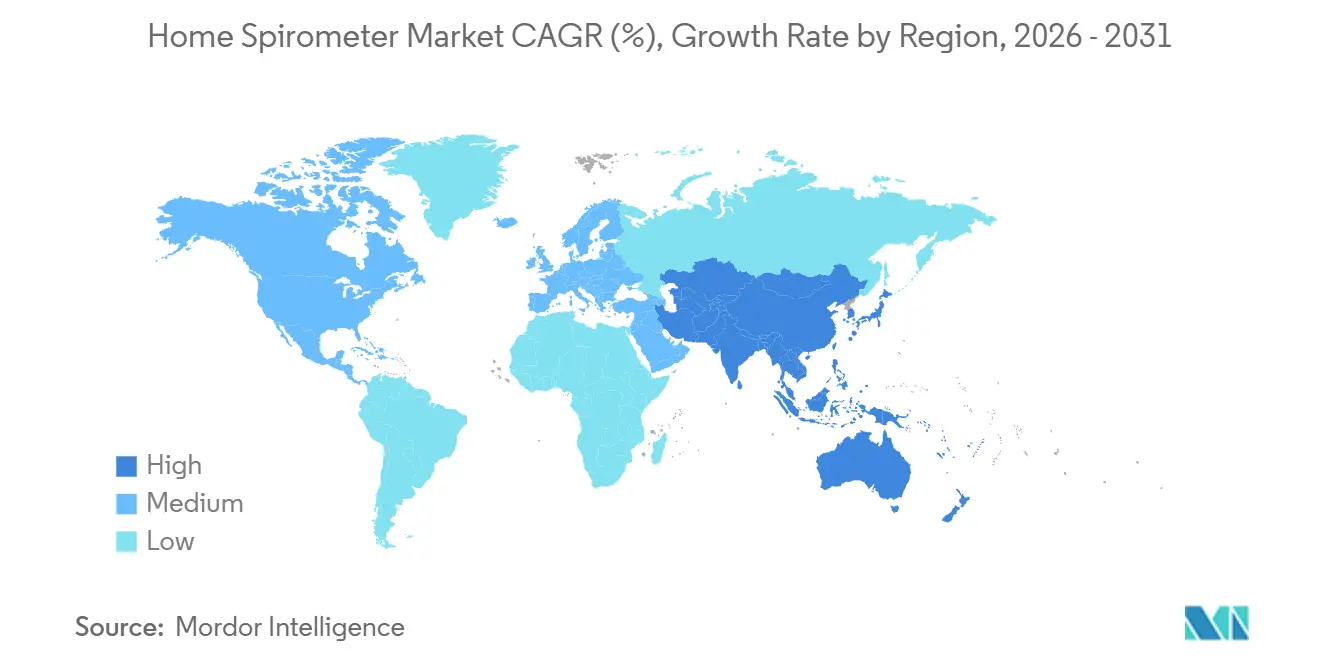
Asia-Pacific is projected to grow at an 10.52% CAGR from 2027 to 2032, which makes it the fastest-growing regional block in the home spirometer market. The region benefits from a large disease burden, rising digital health readiness, and a stronger interest in portable screening tools. Japan adds momentum through demand for compact, cloud-connected monitoring solutions, while South Korea and India support growth through broader healthcare digitalization themes. South America, the Middle East, and Africa still remained earlier-stage opportunities in the home spirometer market because reimbursement depth and distribution coverage were less developed. Even so, Brazil and the GCC stood out as the most visible entry points in those regions.
Competitive Landscape
The home spirometer market is moderately fragmented, with established respiratory specialists such as NDD Medical Technologies, Vitalograph, Koninklijke Philips N.V., and MIR holding recognized positions through clinical history, broad distribution, and regulatory experience. At the same time, digital-first participants such as NuvoAir and Aluna Health are competing by pairing devices with monitoring platforms and ongoing care support rather than relying only on instrument specifications. This creates a market structure where hardware credibility still matters, but software, data handling, and follow-up capability now shape more of the buying decision in the home spirometer market.
Competitive strategies are also diverging between incumbents and newer challengers. Several established manufacturers are extending their core device lines with subscriptions, remote respiratory monitoring tools, and EHR-oriented connectivity so they can remain relevant as the home spirometer market shifts toward service-led models. MIR’s software-linked remote respiratory monitoring offer shows how a legacy spirometry company is using workflow integration to deepen its position beyond hardware alone. These moves matter because the home spirometer market is rewarding vendors that can connect data capture with broader clinical decision support.
The next competitive pressure point is likely to come from AI-enabled interpretation becoming more widely available as a software layer. Formal cybersecurity and software governance are also tightening, with NIST’s telehealth smart home guidance signaling that connected device compliance is becoming more structured. As a result, the home spirometer market still offers room for innovation, but scale will increasingly favor companies that can combine regulatory discipline, secure cloud architecture, and patient-facing usability. This supports that the consolidation pressure is more likely to appear around digital platform capabilities than around basic measurement hardware alone.
Home Spirometer Industry Leaders
-
Koninklijke Philips N.V.
-
Koneksa Health
-
Vitalograph Ltd.
-
NDD Medical Technologies
-
Medical International Research S.p.A.
- *Disclaimer: Major Players sorted in no particular order
Home Spirometer Market Companies Covered in this Report
- Aluna Health Inc.
- CareSimple Inc.
- CMI Health Inc.
- Contec Medical Systems
- e-LinkCare Meditech Co. Ltd.
- Geratherm Medical
- Jones Medical Instrument Company
- Koneksa Health
- Koninklijke Philips
- Medcaptain Medical Technology Co. Ltd.
- Medical International Research S.p.A.
- Medikro Oy
- MIR - Medical International Research
- NDD Medical Technologies
- NuvoAir AB
- OMRON
- Schiller
- Sibelmed S.L.
- Smart Respiratory Products Ltd.
- Vitalograph Ltd.
Recent Industry Developments in Home Spirometer Market
- June 2026: MIR (Medical International Research) and Keva Health announced a commercial partnership to deploy MIR's connected spirometry platform within Keva Health's asthma care management ecosystem. The collaboration positions home spirometers as embedded tools within disease management programs rather than standalone devices, expanding their utilization across primary care workflows targeting asthma patient populations.
- February 2026: NDD Medical Technologies' nddCloud received HITRUST e1 certification, validating adherence to NIST-, ISO-, and OWASP-derived cybersecurity standards for its cloud-connected spirometry platform. This achievement, combined with its ISO/IEC 27001:2022 certification obtained in May 2025, positions nddCloud as a security-compliant enterprise data platform for telehealth procurement decision-makers managing protected health information at scale.
Global Home Spirometer Market Report Scope
According to the report’s scope, the home spirometer market refers to the segment of respiratory monitoring devices designed for self‑use by patients at home to measure lung function. These portable, connected spirometers enable remote monitoring of chronic respiratory conditions such as COPD, asthma, and cystic fibrosis, often integrated with mobile apps and telehealth platforms for data transmission to clinicians.
The home spirometer market is segmented into product type, technology, application, distribution channel, and geography. By product type, the market is segmented into handheld spirometers, portable wireless spirometers, and smartphone-connected spirometers. By technology, the market is segmented into flow-based spirometers, volume-based spirometers, and Bluetooth/Wi-Fi-enabled spirometers. By application, the market is segmented into chronic obstructive pulmonary disease management, asthma monitoring, pulmonary function testing, and postoperative recovery. By distributional channel, the market is segmented into hospital pharmacies, retail pharmacies, and online pharmacies. By geography, the market is segmented into North America, Europe, Asia-Pacific, the Middle East and Africa, and South America. The report also covers the estimated market sizes and trends for 17 countries across major regions globally. The report offers values (USD) for all the above segments.
Segmentation Overview
| Handheld Spirometers |
| Portable Wireless Spirometers |
| Smartphone-Connected Spirometers |
| Flow-Based Spirometers |
| Volume-Based Spirometers |
| Bluetooth/Wi-Fi Enabled Spirometers |
| Chronic Obstructive Pulmonary Disease Management |
| Asthma Monitoring |
| Pulmonary Function Testing |
| Postoperative Recovery |
| Hospital Pharmacies |
| Retail Pharmacies |
| Online Pharmacies |
| Other Distribution Channels |
| North America | United States |
| Canada | |
| Mexico | |
| Europe | Germany |
| United Kingdom | |
| France | |
| Italy | |
| Spain | |
| Rest of Europe | |
| Asia-Pacific | China |
| Japan | |
| India | |
| Australia | |
| South Korea | |
| Rest of Asia-Pacific | |
| Middle East and Africa | GCC |
| South Africa | |
| Rest of Middle East and Africa | |
| South America | Brazil |
| Argentina | |
| Rest of South America |
| By Product Type | Handheld Spirometers | |
| Portable Wireless Spirometers | ||
| Smartphone-Connected Spirometers | ||
| By Technology | Flow-Based Spirometers | |
| Volume-Based Spirometers | ||
| Bluetooth/Wi-Fi Enabled Spirometers | ||
| By Application | Chronic Obstructive Pulmonary Disease Management | |
| Asthma Monitoring | ||
| Pulmonary Function Testing | ||
| Postoperative Recovery | ||
| By Distribution Channel | Hospital Pharmacies | |
| Retail Pharmacies | ||
| Online Pharmacies | ||
| Other Distribution Channels | ||
| By Geography | North America | United States |
| Canada | ||
| Mexico | ||
| Europe | Germany | |
| United Kingdom | ||
| France | ||
| Italy | ||
| Spain | ||
| Rest of Europe | ||
| Asia-Pacific | China | |
| Japan | ||
| India | ||
| Australia | ||
| South Korea | ||
| Rest of Asia-Pacific | ||
| Middle East and Africa | GCC | |
| South Africa | ||
| Rest of Middle East and Africa | ||
| South America | Brazil | |
| Argentina | ||
| Rest of South America | ||
Key Questions Answered in the Report
What is the expected value of the home spirometer market by 2032?
The home spirometer market is projected to reach USD 290.60 million by 2032 from USD 196.77 million in 2027, with a 8.11% CAGR over 2027-2032.
Which application currently generates the most revenue in home spirometry?
Chronic obstructive pulmonary disease management led with 40.42% share in 2026, supported by the central role of spirometry in diagnosis, staging, and ongoing management.
Which region is growing the fastest for home-use spirometers?
Asia-Pacific is expected to post the fastest growth at an 10.52% CAGR through 2032, supported by high disease burden and growing acceptance of portable screening tools.
Which sales channel is expanding the quickest?
Online pharmacies are forecasted to grow at an 9.76% CAGR through 2032, reflecting stronger direct-to-consumer buying behavior and lower purchasing friction.