
Holographic Imaging Market Size and Share
Market Overview
| Study Period | 2020 - 2031 |
|---|---|
| Market Size (2026) | USD 1.95 Billion |
| Market Size (2031) | USD 5.39 Billion |
| Growth Rate (2026 - 2031) | 22.56 % |
| Fastest Growing Market | Asia-Pacific |
| Largest Market | North America |
| Market Concentration | Medium |
Major Players *Disclaimer: Major Players sorted in no particular order Image © Mordor Intelligence. Reuse requires attribution under CC BY 4.0. | |
Holographic Imaging Market Analysis by Mordor Intelligence
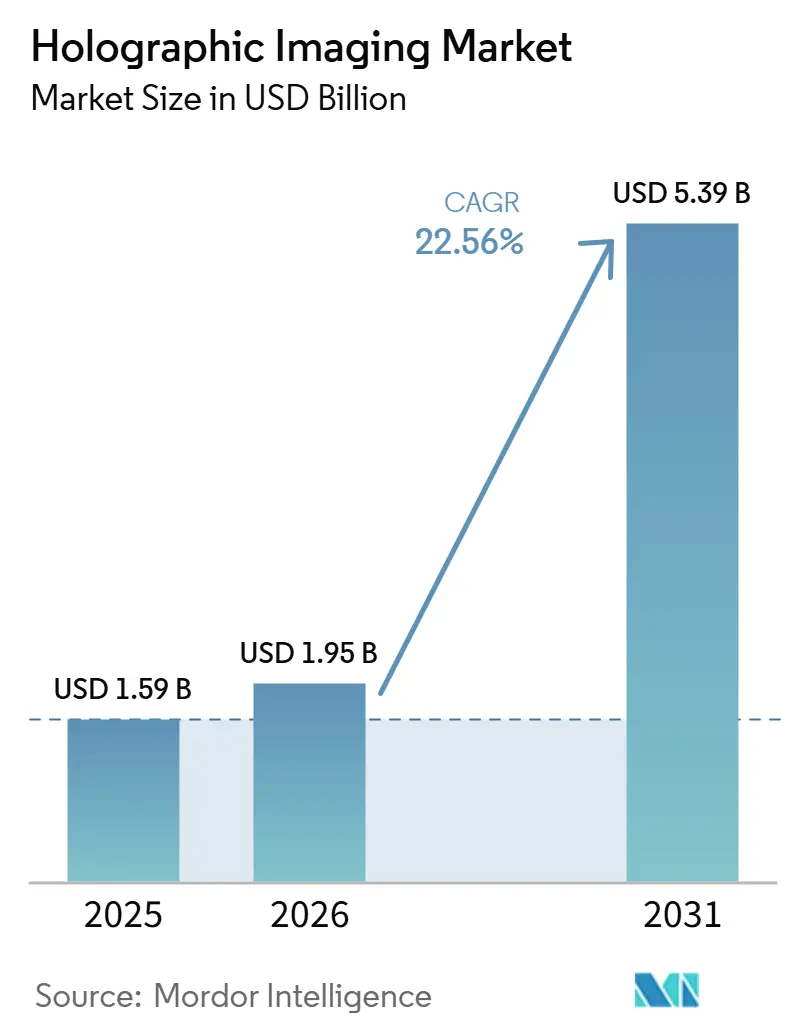
The Holographic Imaging Market size is projected to expand from USD 1.59 billion in 2025 and USD 1.95 billion in 2026 to USD 5.39 billion by 2031, registering a CAGR of 22.56% between 2026 to 2031.
The holographic imaging market is gaining momentum as demand increases across clinical diagnostics, surgical guidance, industrial measurement, and spatial computing devices. Wider access to spatial computing hardware is improving holographic content distribution, while hospital investment in non-invasive volumetric visualization is moving these systems from pilot projects to routine purchasing. Smaller optical components and AI-based reconstruction are supporting integration into clinical workflows and enabling portable and point-of-care applications. The competitive landscape remains moderately fragmented, creating opportunities for specialized vendors while raising integration challenges in closed software and hardware ecosystems. However, slow clinical standardization, long reimbursement cycles, and dependence on specialized optical parts continue to affect growth, making scale, validation, and ecosystem partnerships critical to commercial success in the holographic imaging market.
Key Report Takeaways
- By offering, hardware held 41.65% share in 2025, while services are projected to grow at 24.93% CAGR through 2031.
- By dimension, 3D holographic imaging accounted for 69.23% share in 2025 and is also forecast to expand at 26.67% CAGR through 2031.
- By technology, digital holography led with 39.34% share in 2025, while lensless holography is expected to record the highest CAGR at 23.35% through 2031.
- By application, medical imaging captured 32.88% share in 2025, while surgical planning and navigation is projected to advance at 12.78% CAGR through 2031.
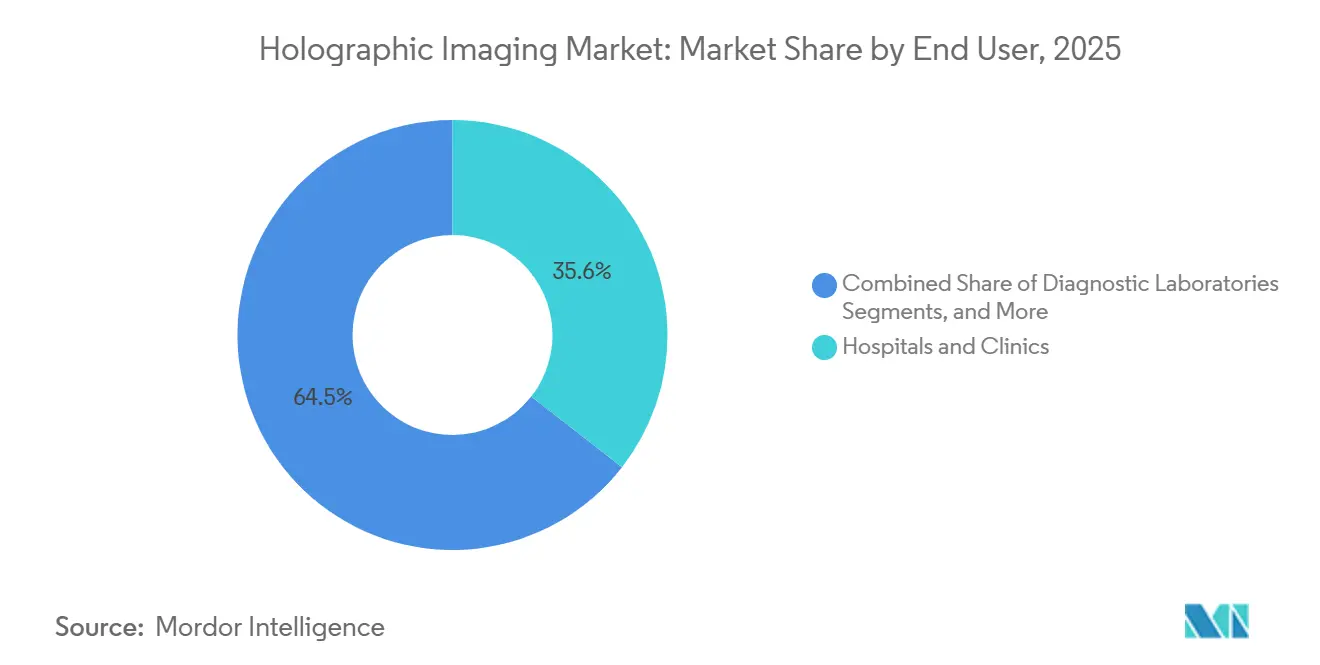
- By end user, hospitals and clinics represented 35.55% share in 2025, while research and academic institutes are projected to grow at 24.66% CAGR through 2031.
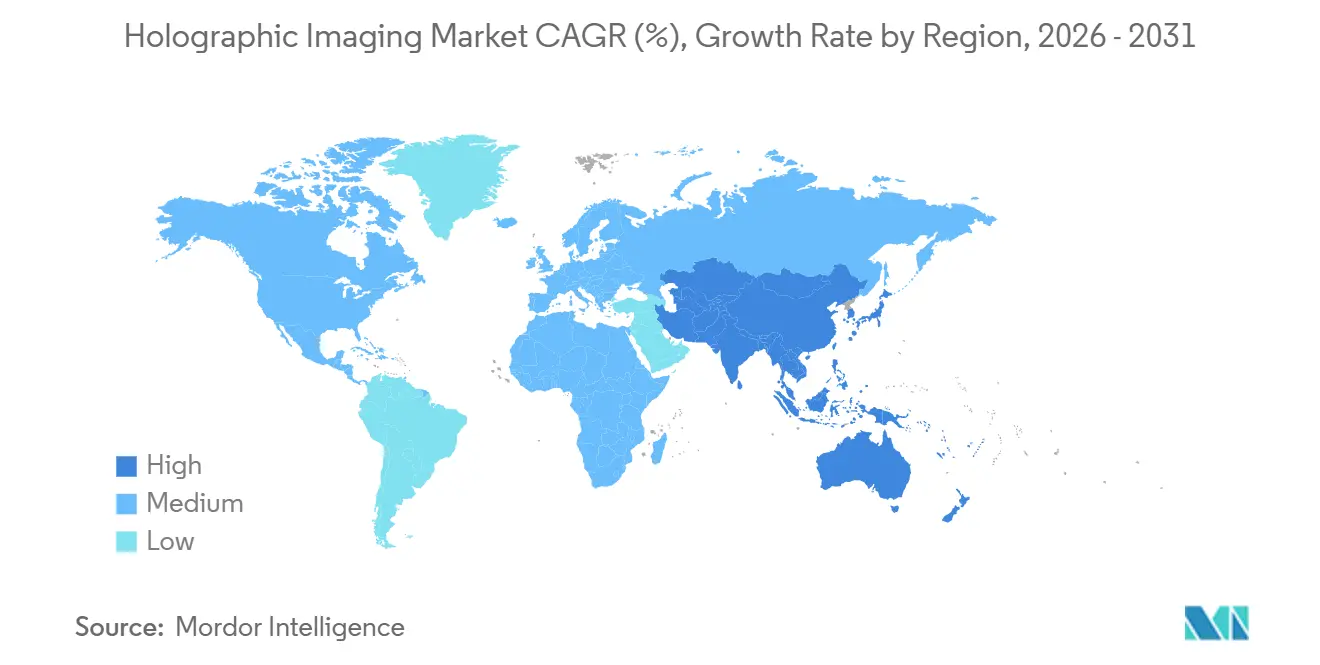
- By geography, North America held 40.56% share in 2025, while Asia-Pacific is expected to post the fastest regional CAGR at 23.56% through 2031.
Note: Market size and forecast figures in this report are generated using Mordor Intelligence’s proprietary estimation framework, updated with the latest available data and insights as of January 2026.
Market Trends and Insights
Drivers Impact Analysis of Holographic Imaging Market*
| DRIVER | (~) % IMPACT ON CAGR FORECAST | GEOGRAPHIC RELEVANCE | IMPACT TIMELINE |
|---|---|---|---|
| Rising adoption of non-invasive 3D visualization in clinical settings | +5.2% | Global, concentrated in North America and Western Europe | Medium term (2-4 years) |
| Expansion of AR, VR, and spatial computing ecosystem | +4.6% | Global, with early scale gains in North America, South Korea, and China | Short term (≤ 2 years) |
| Demand for high-precision imaging in research and medical applications | +3.8% | North America and EU, spillover to APAC research hubs | Medium term (2-4 years) |
| Growing use in surgical planning and medical training | +3.4% | North America, Germany, Japan, South Korea | Medium term (2-4 years) |
| Integration of AI for image reconstruction and interpretation | +4.9% | Global, disproportionately concentrated in AI-mature economies | Short term (≤ 2 years) |
| Miniaturization of holographic optics for portable devices | +2.7% | APAC manufacturing core, with demand uptake in MEA and South America | Long term (≥ 4 years) |
| Source: Mordor Intelligence | |||
Rising Adoption of Non-Invasive 3D Visualization in Clinical Settings
Non-invasive 3D visualization is gaining traction as holographic reconstruction gives clinicians a volumetric view of anatomy without requiring direct contact during image review. In May 2025, a multicenter study in Nature Communications showed that AI-driven 3D reconstruction improved the identification of anatomical variants during lung segmentectomy planning, particularly when standard CT views left bronchial and vascular structures unclear.[1]X. Chen, “Artificial Intelligence Driven 3D Reconstruction for Enhanced Lung Surgery Planning,” Nature Communications, doi.org In the United States, FDA 510(k) clearance for 4DMedical’s CT:VQ software in September 2025, followed by deployment across six leading academic medical centers within seven months, indicated stronger clinical willingness and reimbursement confidence. Cardiac catheterization labs also started using real-time 3D holographic overlays to navigate complex anatomy without repositioning imaging equipment, strengthening the clinical case for the holographic imaging market despite high system prices.
Expansion of AR, VR, and Spatial Computing Ecosystem
The spatial computing ecosystem is lowering the distribution barrier for holographic applications as rendering increasingly shifts from dedicated hardware to broader mixed-reality processing platforms. This shift shortens launch cycles for software developers and helps the holographic imaging market leverage component scale created by consumer and enterprise AR devices. Swave Photonics raised EUR 27 million in January 2025 and secured an additional EUR 6 million in June 2025 to advance its holographic extended reality platform for AR smart glasses and automotive displays, indicating continued investor interest in waveguide-based holography. In June 2026, Nika Optics launched an automated holographic waveguide line with an annual capacity of 1 million units in Tianjin and a combined 1.3 million units across Tianjin and Guangzhou, supporting lower input costs for waveguides and light-shaping components used in medical and industrial systems.
Growing Use in Surgical Planning and Medical Training
The holographic imaging market is gaining support from surgical planning and medical training as these systems move from static reference tools to active guidance platforms. In 2025, a study in Updates in Surgery found that 3D holographic reconstruction paired with intraoperative navigation improved anatomical understanding and surgical precision in laparoscopic partial nephrectomy training for urology residents.[2]R. Lim, “Innovative Integration of 4D Cardiovascular Reconstruction and Hologram, Framework Development of a New Visualization Tool for Coronary Artery Bypass Grafting Planning,” JMIR Medical Informatics, jmir.org NVIDIA’s open-source G-SHARP pipeline showed that surgical environments could integrate real-time 3D scene reconstruction from endoscopic video with GPU acceleration, making deployment more practical within existing procedural workflows. Medical schools and training centers also began using holographic simulation to replace some cadaver-based instruction, while RealView Imaging’s November 2025 patent for displaying holographic images within real objects supported the move toward real-time anatomical overlays directly on the patient’s body surface during procedures.
Integration of AI for Image Reconstruction and Interpretation
AI is changing the economics of the holographic imaging market by reducing computation time and enabling reconstruction on hardware that previously could not support real-time use. In 2025, a JMIR Medical Informatics framework described a 4D cardiovascular hologram system that used deep learning to generate dynamic holograms from CT and MRI data for coronary artery bypass grafting planning, with clinician-validated spatial accuracy during preoperative rehearsal. Research published in Photonics in 2025 also showed that a lightweight distilled strategy delivered holographic imaging results with only 5.4% of the parameter count of a full U-Net model, supporting mobile and lower-cost devices. In December 2025, Phase Holographic Imaging AB launched HoloMonitor NG with fourfold higher resolution, AI-based automated cell segmentation, and a quality-management-system-ready design aimed at clinical settings.
Restraints Impact Analysis of Holographic Imaging Market*
| RESTRAINT | (~) % IMPACT ON CAGR FORECAST | GEOGRAPHIC RELEVANCE | IMPACT TIMELINE |
|---|---|---|---|
| High system cost and limited hospital capital budgets | -2.9% | Global, most acute in MEA, South America, and Tier-2 hospital systems in APAC | Medium term (2-4 years) |
| Complex calibration, data processing, and integration challenges | -2.1% | Global, more pronounced where IT infrastructure for medical imaging is fragmented | Medium term (2-4 years) |
| Limited clinical standardization and reimbursement pathways | -1.6% | North America and EU, where reimbursement policies govern procurement decisions | Long term (≥ 4 years) |
| Under-reported, fragmented supply chain for specialized components | -1.3% | APAC manufacturing core and North America, with global exposure to geopolitical disruption | Medium term (2-4 years) |
| Source: Mordor Intelligence | |||
High System Cost and Limited Hospital Capital Budgets
High system costs remain a significant barrier, as clinical-grade holographic platforms require substantial investment in optics, computing infrastructure, staff training, and workflow integration. The budget challenge extends beyond the initial device purchase, as the first two years of ownership can involve major spending on processing capacity and integration with PACS and EHR systems. This pressure supports the growth of the services segment, the fastest-growing offering in the holographic imaging market at a CAGR of 24.93%, as vendors shift customers from large one-time purchases to managed-service and cloud-based subscription models. However, these models do not fully address challenges in emerging markets, where bandwidth limitations, data-sovereignty regulations, and the lack of reimbursement codes continue to slow procurement decisions.
Complex Calibration, Data Processing, and Integration Challenges
The holographic imaging market also faces operational challenges because these systems require precise optical alignment, coherence length calibration, and close synchronization between illumination and detection components. Registration accuracy, system standardization, and learning curves were identified as key barriers to broader adoption in surgical practice, although automated calibration and AI-based registration have supported gradual improvement. Real-time 3D and 4D reconstruction can strain hospital IT environments when dedicated GPU resources are unavailable, creating latency risks in time-sensitive settings. Vendors must also demonstrate algorithm reliability across different patient anatomies for FDA and CE submissions, which can extend commercialization timelines by 12 to 24 months and place greater pressure on smaller companies.
*Our forecasts treat driver/restraint impacts as directional, not additive. The impact forecasts reflect baseline growth, mix effects, and variable interactions.
Holographic Imaging Market Segment Analysis
By Offering:
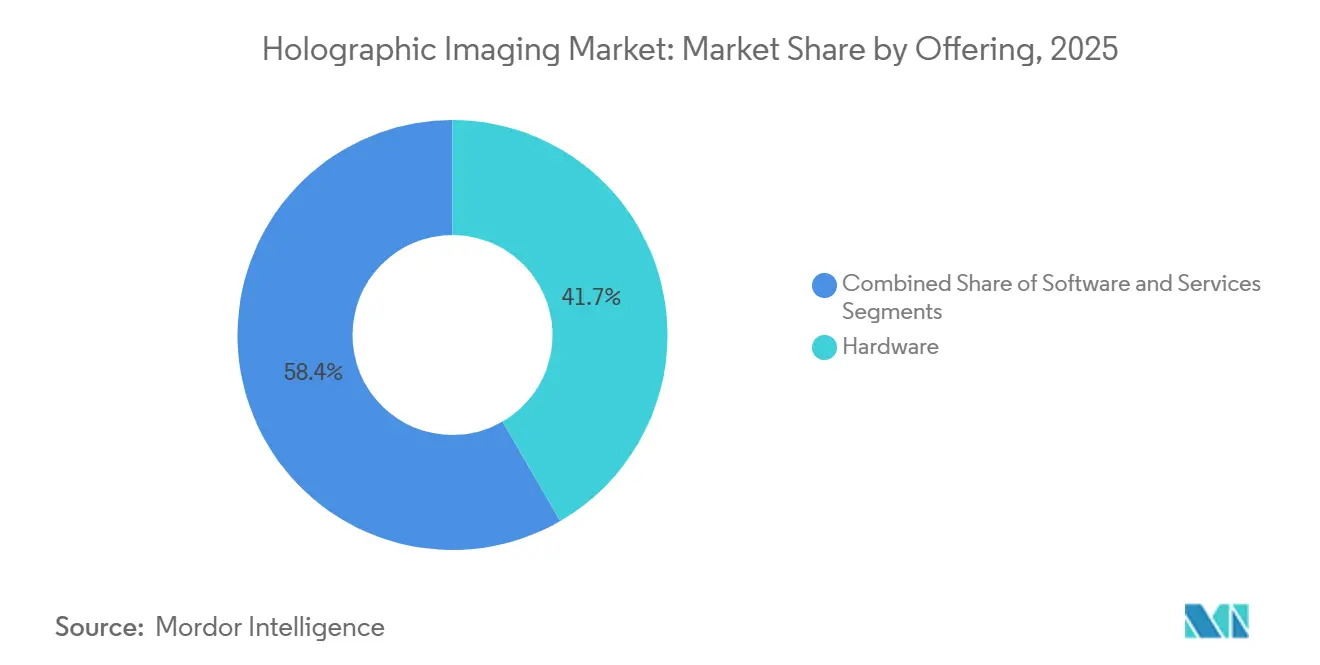
Services Model Gaining Ground as Hardware MaturesHardware held 41.65% of the holographic imaging market share in 2025, reflecting the capital-intensive nature of clinical optics, spatial light modulators, and coherent illumination systems used in new deployments. Hospitals, laboratories, and industrial buyers continued to require dedicated physical systems before realizing software value. Many buyers preferred full-stack platforms with validated components over mixed systems from multiple vendors. Demand for photopolymer recording media, laser sources, and related optical modules kept hardware central to procurement decisions, although buyers increasingly prioritized lifecycle cost, uptime, and ongoing support.
Services is the fastest-growing segment and is forecast to advance at a 24.93% CAGR through 2031, reflecting the holographic imaging market’s shift toward recurring delivery models. Managed-service contracts, cloud reconstruction subscriptions, and calibration support help vendors distribute costs across operating budgets rather than relying on large capital purchases. This model aligns with hospital systems that assess imaging technology based on total cost of ownership and workflow continuity. Software supports this transition through AI updates, feature upgrades, and integration across installed systems, while Looking Glass Factory’s HLD display line, which started shipping in May and June 2026, showed how embedded software reduced content-generation complexity and expanded the usable hardware base.



By Dimension:
3D Holographic Imaging Commands the Core of Demand3D holographic imaging accounted for 69.23% of revenue in 2025, making it the leading dimension in the holographic imaging market. Demand came from depth-resolved visualization in medical imaging, surgical navigation, and industrial workflows, where flat renderings provide limited spatial context. Clinicians and industrial users favored 3D systems because they improved the interpretation of complex structures in real working environments. The segment’s scale also reflected stronger validation and technical maturity than alternatives focused on narrower display or security applications.
3D holographic imaging is also the fastest-growing dimension and is expected to expand at a 26.67% CAGR through 2031, showing that the largest segment is also gaining momentum at the fastest rate. This trend indicates that the holographic imaging market is deepening around the format with the strongest use case support. RealView Imaging’s 2026 patent application for real-time fused holographic visualization in structural heart repair showed how 3D capability advanced toward sub-second, procedure-level rendering requirements. In comparison, 2D holographic imaging remains relevant in security labels, authentication, and decorative industrial applications, where lower cost can offset the absence of depth.
By Technology:
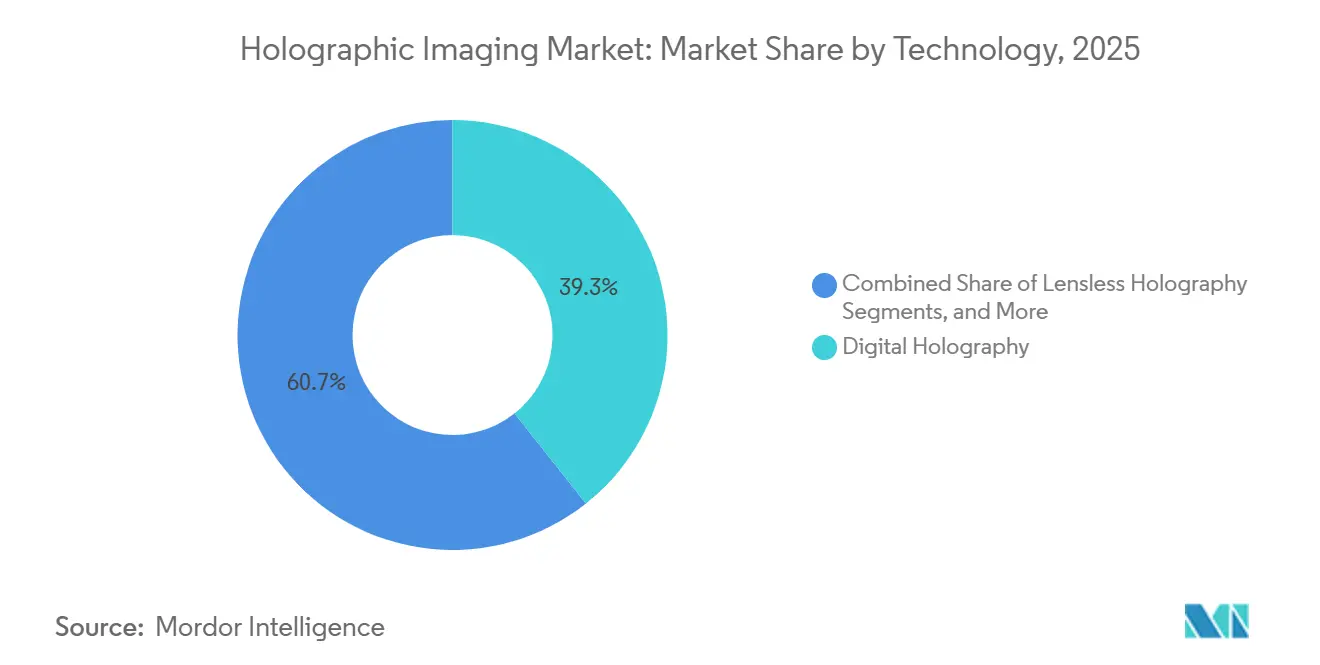
Lensless Holography Reshapes the Cost StructureDigital holography led the technology split with a 39.34% share in 2025, supported by its long laboratory history and established supply chain for lasers and detector arrays. It remained important across research, industrial inspection, and specialized medical imaging because users understood its workflow and performance profile. A deeper base of reference installations also lowered perceived risk for new buyers entering the holographic imaging market. This familiarity supported procurement in settings that prioritized proven optical architectures over more disruptive alternatives.
Lensless holography is forecast to grow at a 23.35% CAGR through 2031, making it the fastest-growing technology in the holographic imaging market size by platform architecture. Removing conventional lens assemblies lowers weight, supports portability, and improves the cost structure for point-of-care imaging, microfluidics, and field inspection. A March 2026 paper in the Journal of Optics showed that AI-based phase demodulation improved image quality across lensless and traditional off-axis digital holographic interferometry, indicating that software became a common enabler across formats. Laser-based holography and computer-generated holography remain important in large-format displays, security applications, and simulation, while Lyncee Tec SA continues to demonstrate focused leadership in digital holographic microscopy.
By Application:
Medical Imaging Holds the Revenue Base While Planning Tools ExpandMedical imaging captured 32.88% share in 2025, placing it at the center of the holographic imaging market by application. The segment benefited from established use in radiology, cardiology, and oncology, where reconstructed CT and MRI data presented anatomical relationships more clearly than standard workstations. Hospitals and specialists valued this capability because it supported better visualization before treatment decisions. Medical imaging also had a stronger path to scale than several newer use cases because it aligned with core hospital workflows and large patient volumes.
Surgical planning and navigation is the fastest-growing application and is forecast to expand at a 12.78% CAGR through 2031 in the holographic imaging market size by use case. Growth is tied to better rehearsal, stronger anatomical understanding, and the potential to reduce complication risk and procedure time. A 2025 paper in Acta Neurochirurgica validated mixed-reality holographic overlays for complex thalamic tumor surgery planning, showing lower risk-assessment time and stronger confidence in approach selection. Medical education is also expanding as holographic simulation can replace some cadaver-based anatomy and procedural training, while industrial inspection, consumer displays, and research imaging continue to broaden the application base.
By End User:
Hospitals Lead Spending While Academia Speeds DiffusionHospitals and clinics accounted for 35.55% share in 2025, making them the largest end-user group in the holographic imaging market. Their lead reflected direct use in radiology, interventional cardiology, and surgical navigation, where clinical-grade platforms were deployed in real care settings. These institutions influenced broader adoption because they tested workflow value, reimbursement potential, and procurement standards. Once systems proved effective in hospital practice, their credibility typically improved across adjacent buyer groups.
Research and academic institutes are forecast to grow at a 24.66% CAGR through 2031, the fastest pace among end users in the holographic imaging market. Grant funding, translational research programs, and close links with teaching hospitals help this segment adopt technologies earlier, especially in cell therapy, regenerative medicine, and computational biology. Phase Holographic Imaging AB’s HoloOocyte direction in livestock IVF showed how research pathways created new user categories around non-invasive assessment workflows. Diagnostic laboratories, OEMs, and defense organizations add depth through pathology, downstream optical integration, structural testing, and secure imaging use cases, while institutional healthcare and research continue to guide market development.
Geography Analysis
North America Holographic Imaging Market
North America held 40.56% of the holographic imaging market share in 2025, maintaining its regional leadership. The region benefited from FDA-cleared platforms, a dense network of academic medical centers, and stronger capital access for technology vendors and buyers. The FDA pathway accelerated commercialization when clinical evidence was clear, as seen when 4DMedical’s CT:VQ received 510(k) clearance in September 2025 and expanded into six major US academic medical centers within seven months. The United States also moved beyond elite hospitals, with a May 2026 commercial agreement placing advanced imaging technology across more than 170 SimonMed outpatient centers in 10 states, indicating broader adoption in routine ambulatory settings.
Europe Holographic Imaging Market
Europe remained the second-largest regional bloc in the holographic imaging market, with Germany, the United Kingdom, and France serving as the main demand centers. Germany supported adoption and supply through its precision optics clusters, which provided manufacturing depth and strong links between research institutions and industrial users. The EU Medical Device Regulation extended commercialization timelines by 12 to 24 months for diagnostic platforms, while improving purchaser confidence after compliance. This trend gained relevance in March 2026 when 4DMedical received CE Mark certification for CT:VQ and announced an AUD 83 million private placement to support European expansion.
APAC, MEA and South America Holographic Imaging Market
Asia-Pacific was the fastest-growing region and expanded at a CAGR of 23.56%, giving it the strongest momentum in the holographic imaging market size by geography. China played an important role by combining optical manufacturing scale with increasing strategic control over key components used in AR and medical holography. Nika Optics’ June 2026 launch of an automated waveguide production line, with an annual capacity of 1 million units in Tianjin and 1.3 million units across Tianjin and Guangzhou, highlighted this supply-side strength. Japan and South Korea supported demand through their semiconductor and photonics ecosystems, while India remained earlier in its adoption path and more research-led than hospital-led. The Middle East and Africa and South America contributed less overall, but GCC hospital modernization and Brazil’s private hospital networks created selective demand pockets that remained important to the long-term shape of the holographic imaging market.

Competitive Landscape
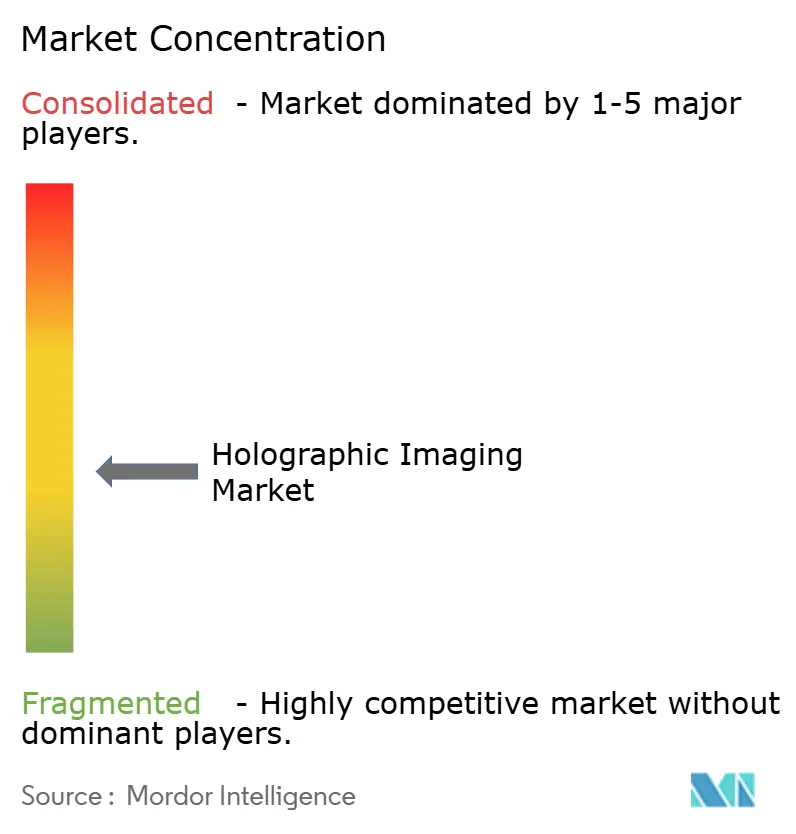
The holographic imaging market remained moderately fragmented, with no single company controlling most of the total addressable space. Competition included pure-play display specialists, clinical holography developers, industrial metrology companies, and spatial computing platform providers with holographic content capabilities. This structure gave buyers multiple options but created challenges around interoperability and platform integration. As a result, companies that combined device performance with usable software, workflow compatibility, and credible evidence strengthened their market position.
Strategic priorities varied by player type within the holographic imaging market. Clinical specialists focused on regulatory progress, hospital validation, and evidence of procedural value, while display-focused companies prioritized hardware performance, user experience, and broader channel reach. WiMi Hologram Cloud reported RMB 347.1 million in net income for fiscal 2025, up 235.9% year over year, showing that companies achieved scale when they linked holographic capabilities to several commercial verticals rather than a single end market. Avalon Holographics raised the competitive bar in May 2025 with the launch of NOVAC, supported by USD 65 million in total funding and 61 patents, as the company positioned true holographic display technology against light-field alternatives.
White-space opportunities remained visible in portable lensless systems, semiconductor inspection tools, and AI-native reconstruction software that operated on existing imaging hardware rather than replacing it. DeepEn GmbH demonstrated emerging specialization by developing lensless holographic endoscopes for hard-to-reach neural and oncological tissue, supported by seed funding and EIC transition backing. MicroCloud Hologram’s April 2026 patent work on quantum key distribution combined with phase modulation holographic imaging showed that wavefront-encoding capability moved into secure authentication and communications use cases. Patent control became more important in display hardware, particularly in waveguide geometry and light-modulation efficiency, where design freedom narrowed.
Holographic Imaging Industry Leaders
Eon Reality Inc.
Holoxica Limited
Holoscene, Inc.
Phase Holographic Imaging AB
RealView Imaging Ltd.
- *Disclaimer: Major Players sorted in no particular order
Holographic Imaging Market Companies Covered in this Report
- 4DMedical Limited
- Eon Reality Inc.
- Hologram Inc.
- Holoscene, Inc.
- HoloTech Switzerland AG
- Holoxica Limited
- Leia Display Systems, Inc.
- Leia Inc.
- Light Field Lab, Inc.
- Looking Glass Factory, Inc.
- Lyncee Tec SA
- Mach7 Technologies Limited
- MicroCloud Hologram Inc.
- NanoLive SA
- OVIZON 3D, Inc.
- Phase Holographic Imaging AB
- RealView Imaging Ltd.
- REALVIZ SA
- WiMi Hologram Cloud Inc.
- Zebra Imaging, Inc.

Recent Industry Developments in Holographic Imaging Market
- June 2026: Nika Optics launched the world’s first automated holographic waveguide production line, with annual capacity of 1 million units in Tianjin and 1.3 million units across Tianjin and Guangzhou.
- May 2026: 4DMedical signed a three-year agreement with SimonMed Imaging to deploy CT:VQ and LDAf across more than 170 outpatient centers in 10 US states.
- April 2026: MicroCloud Hologram developed and patented an authentication system combining quantum key distribution protocol, quantum random number generation, and phase modulation holographic imaging.
- December 2025: Phase Holographic Imaging AB launched HoloMonitor NG, featuring fourfold higher resolution, AI-powered automated cell segmentation, and a QMS-compliant architecture.


Global Holographic Imaging Market Report Scope
As per the scope of the report, holographic imaging is a photographic technique that records the light reflected from an object and reconstructs it into a highly realistic 3D image, known as a hologram. Unlike traditional 2D photography, it encodes both the intensity and phase of light. This allows the 3D image to change perspectives as you move, giving it true depth and realism.
The holographic imaging market is segmented by offering, dimension, technology, application, and end user. By offering, the market includes hardware, software, and services. By dimension, the market is segmented into 2D holographic imaging and 3D holographic imaging. By technology, the market is segmented into digital holography, lensless holography, laser-based holography, and computer-generated holography. By application, the market is segmented into medical imaging, surgical planning and navigation, medical education and training, industrial inspection and metrology, consumer electronics and displays, research and academic imaging, and others. By end user, the market is segmented into hospitals and clinics, diagnostic laboratories, research and academic institutes, original equipment manufacturers, industrial enterprises, and defense organizations. The report offers the market sizes and forecasts in terms of value (USD) for the above segments.
| Hardware |
| Software |
| Services |
| 2D Holographic Imaging |
| 3D Holographic Imaging |
| Digital Holography |
| Lensless Holography |
| Laser-Based Holography |
| Computer-Generated Holography |
| Medical Imaging |
| Surgical Planning and Navigation |
| Medical Education and Training |
| Industrial Inspection and Metrology |
| Consumer Electronics and Displays |
| Research and Academic Imaging |
| Others |
| Hospitals and Clinics |
| Diagnostic Laboratories |
| Research and Academic Institutes |
| Original Equipment Manufacturers |
| Industrial Enterprises |
| Defense Organizations |
| North America | United States |
| Canada | |
| Mexico | |
| Europe | Germany |
| United Kingdom | |
| France | |
| Italy | |
| Spain | |
| Rest of Europe | |
| Asia-Pacific | China |
| India | |
| Japan | |
| Australia | |
| South Korea | |
| Rest of Asia-Pacific | |
| Middle East and Africa | GCC |
| South Africa | |
| Rest of Middle East and Africa | |
| South America | Brazil |
| Argentina | |
| Rest of South America |
| By Offering | Hardware | |
| Software | ||
| Services | ||
| By Dimension | 2D Holographic Imaging | |
| 3D Holographic Imaging | ||
| By Technology | Digital Holography | |
| Lensless Holography | ||
| Laser-Based Holography | ||
| Computer-Generated Holography | ||
| By Application | Medical Imaging | |
| Surgical Planning and Navigation | ||
| Medical Education and Training | ||
| Industrial Inspection and Metrology | ||
| Consumer Electronics and Displays | ||
| Research and Academic Imaging | ||
| Others | ||
| By End User | Hospitals and Clinics | |
| Diagnostic Laboratories | ||
| Research and Academic Institutes | ||
| Original Equipment Manufacturers | ||
| Industrial Enterprises | ||
| Defense Organizations | ||
| By Geography | North America | United States |
| Canada | ||
| Mexico | ||
| Europe | Germany | |
| United Kingdom | ||
| France | ||
| Italy | ||
| Spain | ||
| Rest of Europe | ||
| Asia-Pacific | China | |
| India | ||
| Japan | ||
| Australia | ||
| South Korea | ||
| Rest of Asia-Pacific | ||
| Middle East and Africa | GCC | |
| South Africa | ||
| Rest of Middle East and Africa | ||
| South America | Brazil | |
| Argentina | ||
| Rest of South America | ||


Key Questions Answered in the Report
What is the current size of holographic imaging in 2026?
The holographic imaging market size is USD 1.59 billion in 2026 and is forecast to reach USD 5.39 billion by 2031 at a CAGR of 22.56%.
Which offering segment leads revenue generation?
Hardware leads the current revenue mix with 41.65% share in 2025 because optical components and dedicated systems still anchor most deployments.
Which segment is growing fastest by offering?
Services is the fastest-growing offering and is projected to expand at 24.93% CAGR through 2031 as vendors shift toward subscription, calibration, and managed-service models.
Why is 3D holographic imaging gaining so much traction?
3D holographic imaging held 69.23% share in 2025 and is also the fastest-growing dimension at 26.67% CAGR because buyers value true depth visualization in clinical and industrial settings.
Which region is strongest right now?
North America led with 40.56% share in 2025 due to FDA-cleared platforms, academic medical center adoption, and stronger commercial funding conditions.
Which region is expected to grow the fastest through 2031?
Asia-Pacific is projected to grow at 23.56% CAGR because of optical manufacturing scale in China and rising investment in medical and photonics infrastructure across the region.
Page last updated on:





