
HBM3 Market Size and Share
Market Overview
| Study Period | 2020 - 2031 |
|---|---|
| Market Size (2026) | USD 1.12 Billion |
| Market Size (2031) | USD 1.16 Billion |
| Growth Rate (2026 - 2031) | 0.64 % |
| Fastest Growing Market | North America |
| Largest Market | Asia-Pacific |
| Market Concentration | High |
Major Players *Disclaimer: Major Players sorted in no particular order Image © Mordor Intelligence. Reuse requires attribution under CC BY 4.0. | |
HBM3 Market Analysis by Mordor Intelligence
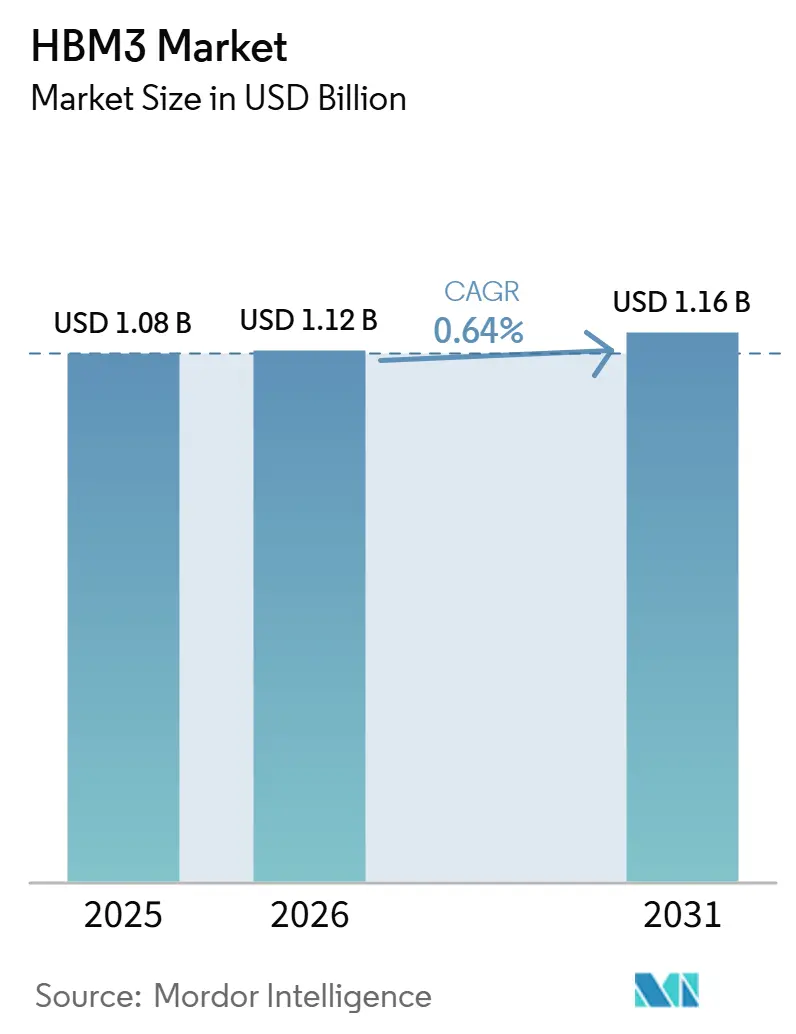
The HBM3 market size is expected to increase from USD 1.08 billion in 2025 to USD 1.12 billion in 2026 and reach USD 1.16 billion by 2031, growing at a CAGR of 0.64% over 2026-2031. The HBM3 market is moving through a stabilization phase rather than a sharp decline because HBM4 entered production in 2026, yet HBM3 still benefits from a mature supply chain, proven reliability, and lower system integration costs for buyers who are not ready to absorb a full platform transition. Demand in the HBM3 market is still supported by procurement for NVIDIA H100-class clusters, especially among enterprise buyers and second-tier cloud operators that continue to deploy supply-accessible HBM3 systems while HBM4 platforms remain constrained at scale. The installed base also matters because depreciation cycles for accelerated computing hardware span several years, keeping replacement memory, service demand, and workload continuity relevant well beyond the first wave of new platform launches. The HBM3 market is also shaped by packaging availability and export controls, as both factors determine how much of the underlying demand can be converted into billable shipments. Competition in the HBM3 market remains concentrated among a small group of suppliers, keeping pricing, qualification timing, and packaging access closely tied to how each vendor manages the transition to newer memory generations.
Key Report Takeaways
- By memory capacity per stack, 12-16 GB held 68.12% revenue share in 2025, while above 16 GB is projected to expand at a 1.24% CAGR through 2031 in the HBM3 market.
- By processor interface, GPU held 73.29% of the HBM3 market share in 2025, while AI accelerators and ASICs are projected to grow at a 1.61% CAGR through 2031.
- By packaging type, 2.5D silicon interposers accounted for 72.67% of the HBM3 market in 2025, while fan-out and embedded-bridge packaging are projected to grow at a 1.18% CAGR through 2031.
- By application, AI training captured 55.31% share of the HBM3 market size in 2025, while AI inference is projected to expand at a 1.84% CAGR through 2031.
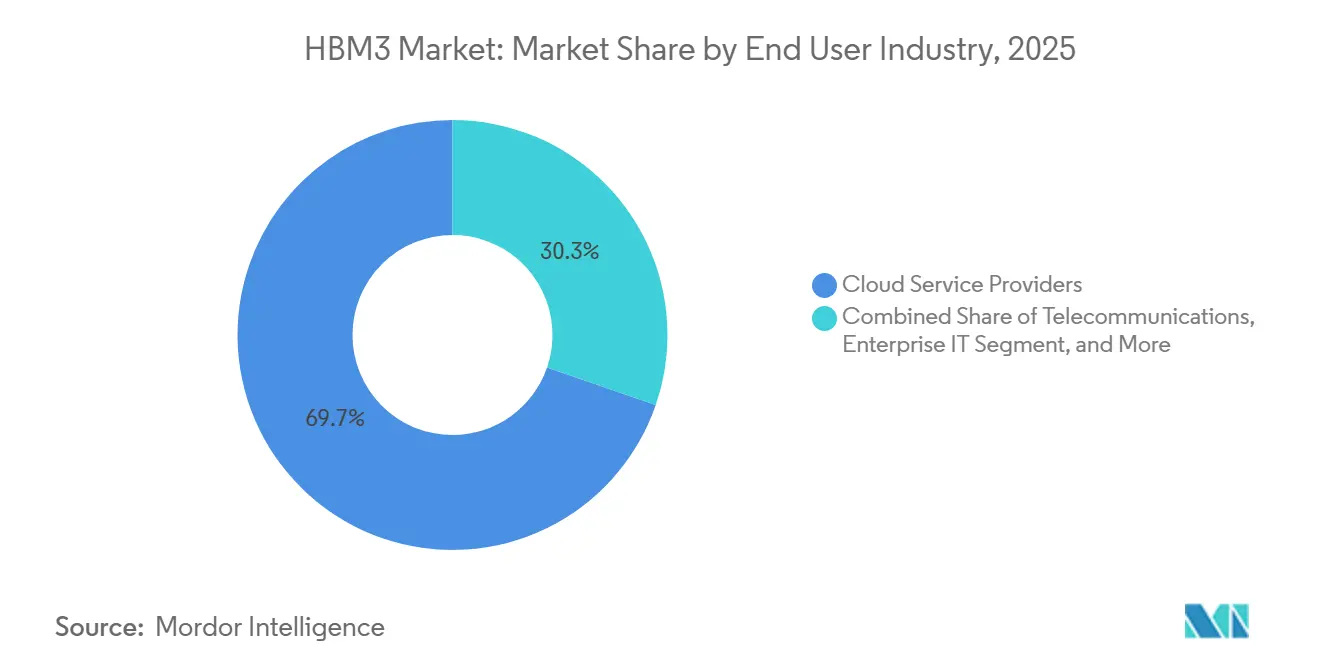
- By end-use industry, cloud service providers accounted for 69.72% of revenue in 2025, while enterprise IT is projected to record the fastest CAGR of 1.79% through 2031 in the HBM3 market.
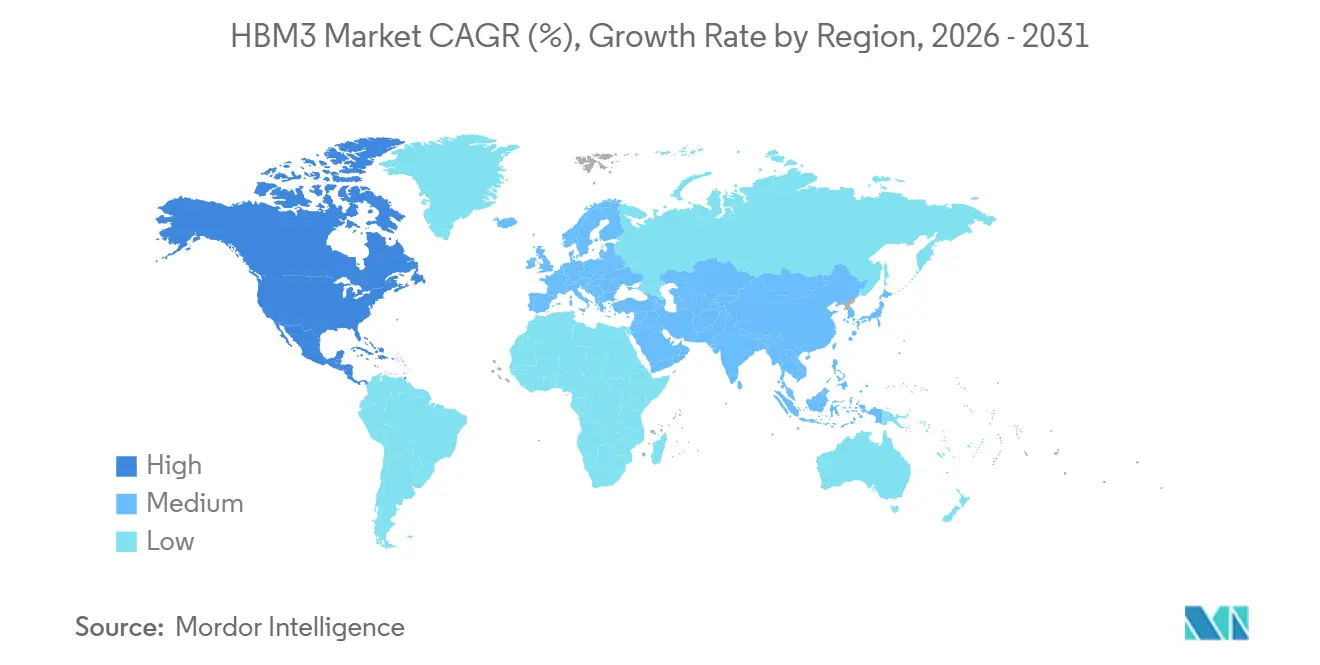
- By geography, Asia-Pacific held 71.41% of the HBM3 market share in 2025, while North America is projected to expand at a 1.57% CAGR through 2031.
Note: Market size and forecast figures in this report are generated using Mordor Intelligence’s proprietary estimation framework, updated with the latest available data and insights as of January 2026.
Market Trends and Insights
Drivers Impact Analysis of HBM3 Market*
| Driver | (~) % Impact on CAGR Forecast | Geographic Relevance | Impact Timeline |
|---|---|---|---|
| AI Server and Accelerated Computing Buildout | +1.1% | Global | Short term (≤ 2 years) |
| Advanced Packaging Capacity as the New Supply Bottleneck | +0.7% | APAC core, spill-over to North America | Short term (≤ 2 years) |
| HBM4 Qualification and Platform Refresh Cycles | +0.3% | Global | Short term (≤ 2 years) |
| Sovereign Semiconductor Incentives and Localized Capex | +0.2% | North America and Europe | Medium term (2-4 years) |
| Hyperscaler ASIC Co-Design and Memory Pre-Allocation | +0.1% | North America and APAC | Short term (≤ 2 years) |
| Edge AI Expansion in Automotive and Industrial Systems | +0.1% | Global | Long term (≥ 4 years) |
| Source: Mordor Intelligence | |||
AI Server and Accelerated Computing Buildout
Sustained spending on AI server infrastructure remains the strongest support factor for the HBM3 market during 2026-2031, even as the latest design wins are shifting toward HBM4 platforms. The HBM3 market still benefits from the fact that many enterprise and second-tier cloud customers are buying hardware that is available now, qualified now, and easier to integrate into existing software and cooling environments than first-wave HBM4 systems. SK hynix stated in its 2026 outlook that ASIC-related HBM demand grew 82% year over year, indicating that demand tied to accelerated computing is still widening across buyer groups rather than narrowing around a single GPU cycle.[1] H100-class clusters also continue to support the HBM3 market because their useful life spans multi-year depreciation schedules, keeping deployed systems active in training, inference, and support roles after newer platforms begin shipping. Operators also face software validation and migration work when they move critical workloads to a new hardware generation, and that makes HBM3-era infrastructure commercially relevant for longer than a simple launch timeline would suggest.
Advanced Packaging Capacity as the New Supply Bottleneck
Packaging availability remains one of the clearest structural supports for the HBM3 market because limited packaging throughput slows the rate at which HBM4 systems can fully replace earlier HBM3-based designs. The HBM3 market is therefore helped by a practical constraint in the supply chain, since advanced packaging slots determine shipment timing just as much as memory die availability does. Each generational transition requires renewed work on interposer layouts, through-silicon via integration, bump structures, and thermal validation, which lengthens the path from engineering readiness to volume system deployment. Research presented at the 2025 Electronics Packaging Technology Conference showed that embedded bridge die interposers are a viable route for heterogeneous integration of NPUs and HBM, supporting the broader industry push to diversify packaging formats beyond conventional interposer-heavy approaches. Synopsys also described its work with Intel Foundry on EMIB-T packaging for larger form factors, demonstrating that the supply chain is actively developing alternatives, even though those alternatives still need time to scale and qualify.[2]
HBM4 Qualification and Platform Refresh Cycles
HBM4 qualification milestones are creating near-term demand pull for the HBM3 market, as buyers with committed HBM3-era designs often make final procurement decisions before the platform window closes. The HBM3 market is therefore seeing support from a transition effect, as confirmation of the next generation encourages customers to complete current-generation projects rather than postpone them. That matters because data center refresh cycles are long, and infrastructure ordered in 2023, 2024, and 2025 remains in service for years after the first HBM4 systems become available in commercial volume. The same logic applies to service memory and replacement components, since the installed base does not disappear when a newer platform starts shipping. Qualification cycles also span multiple quarters, extending the commercial life of each memory generation and helping the HBM3 market retain meaningful demand from buyers that follow hyperscaler transitions with a lag.
Sovereign Semiconductor Incentives and Localized Capex
Government-backed semiconductor investment is extending the production runway for the HBM3 market by creating new packaging and manufacturing capacity in allied economies seeking greater control over strategic memory supply. The US Department of Commerce awarded SK hynix up to USD 458 million in direct CHIPS funding, with access to USD 500 million in loans, for an advanced packaging and research and development facility in West Lafayette, Indiana, where mass production is expected in the second half of 2028.[3] The HBM3 market also benefits from this policy direction because domestic capacity lowers supply risk for North American operators and gives buyers another reason to keep proven HBM3-class platforms in active procurement pipelines while local ecosystems scale. Export control policy reinforces that dynamic because the Bureau of Industry and Security made HBM restrictions effective on December 2, 2024, which created clearer regional separation in how advanced memory can be supplied and deployed. These incentives and controls together support the HBM3 market by protecting demand pools in allied regions and by giving suppliers a reason to maintain commercially useful production lines for incumbent technology during the transition period.
Restraints Impact Analysis of HBM3 Market*
| Restraint | (~) % Impact on CAGR Forecast | Geographic Relevance | Impact Timeline |
|---|---|---|---|
| TSV Yield Losses and Thermal Throttling in High-Stack Devices | -1.10% | Global | Short term (≤ 2 years) |
| CoWoS, SoIC, and Hybrid Bonding Capacity Constraints | -0.70% | APAC core, spill-over to North America | Short term (≤ 2 years) |
| Export Controls and Customer Concentration Risk | -0.40% | North America and APAC | Medium term (2-4 years) |
| Long Qualification Cycles and Interoperability Lock-In | -0.20% | Global | Medium term (2-4 years) |
| Source: Mordor Intelligence | |||
TSV Yield Losses and Thermal Throttling in High-Stack Devices
Yield loss in taller stacked devices remains a direct constraint on the HBM3 market, as each additional die increases the likelihood that the full package will fail to meet cost or reliability targets. The HBM3 market, therefore, faces a ceiling even when demand is healthy, since higher stack counts improve density but also raise manufacturing risk and heat concentration. MDPI Electronics noted that thermal accumulation remains a persistent issue in high-layer HBM structures and that hybrid bonding can materially reduce thermal resistance compared with microbump interconnects, even though the process shift introduces a fresh learning-curve risk of its own. In practice, thermal throttling reduces sustained performance under demanding workloads, weakening the economic case for keeping older HBM3 systems in the hottest, most densely utilized rack environments. These factors compress supplier margins, narrow the price advantage over newer memory generations, and slow the rate of HBM3 market growth, even when procurement intent remains positive.
CoWoS, SoIC, and Hybrid Bonding Capacity Constraints
Packaging bottlenecks limit the HBM3 market because demand that cannot secure packaging capacity on time does not convert into recognized revenue. The HBM3 market is particularly exposed because most high-performance systems still depend on specialized packaging flows that are difficult to expand quickly and even harder to requalify at production scale. The same 2025 EPTC work on embedded bridge die interposers showed that alternatives exist, but it also underscored the development effort needed before those routes can absorb mainstream demand at scale. DOI.ORG. Synopsys also showed that newer packaging architectures, such as EMIB-T, are being advanced for larger substrate formats, yet those options still require tool investment, ecosystem readiness, and customer qualification before they can relieve the pressure on conventional packaging lines. The result is that packaging allocation acts as a rationing mechanism, which caps the HBM3 market below the level implied by raw demand for AI compute capacity.
*Our forecasts treat driver/restraint impacts as directional, not additive. The impact forecasts reflect baseline growth, mix effects, and variable interactions.
HBM3 Market Segment Analysis
By Memory Capacity Per Stack:
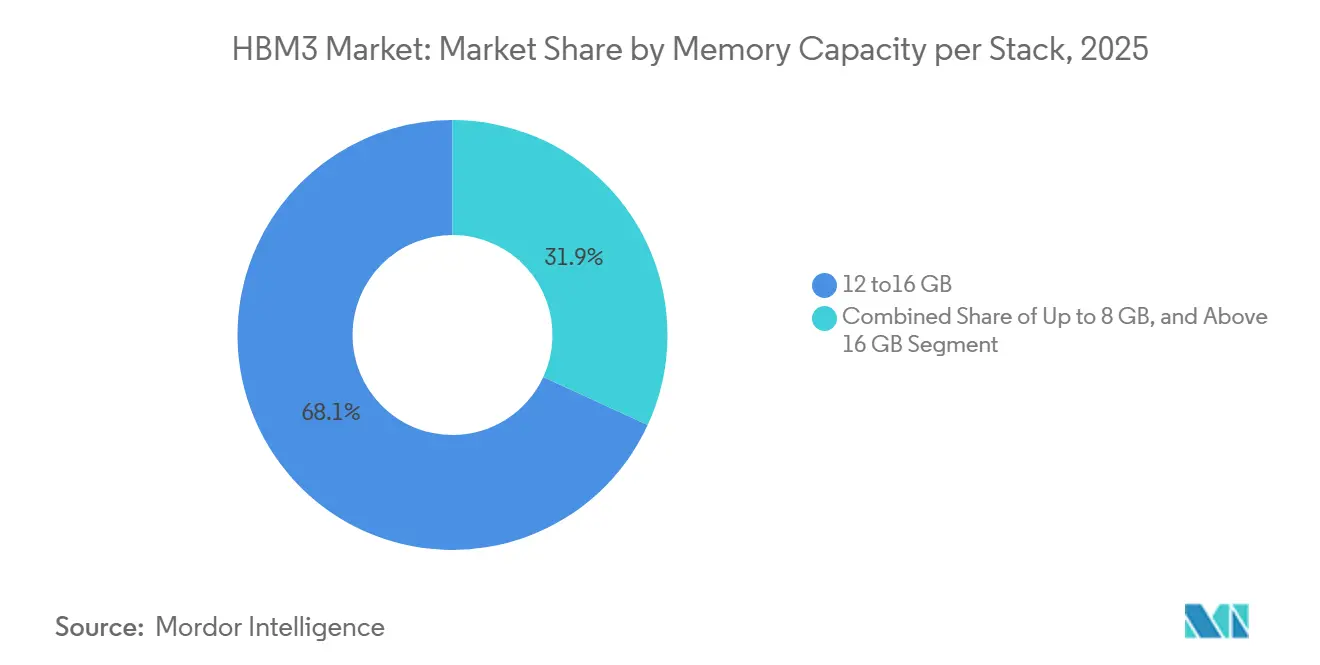
High-Capacity Tier Leads Growth as HPC Adoption ExpandsThe 12-16 GB tier accounted for 68.12% of HBM3 revenue in 2025, making it the dominant capacity class across the HBM3 market, as it matched the reference configuration used in the largest installed base of H100-era accelerated systems. That leading position reflected broad standardization around 16 GB stacks for training density, system balance, and qualification familiarity during the main HBM3 deployment cycle. The up to 8 GB segment, which represented earlier, more cost-sensitive configurations, remained the smallest revenue contributor as system designers shifted toward denser stacks for advanced compute workloads. The above 16 GB tier is projected to grow at a 1.24% CAGR through 2031, making it the fastest-growing capacity range in the HBM3 market for buyers who want higher density without forcing a full platform migration. The HBM3 industry keeps this tier relevant because HPC server deployments and enterprise consolidation programs still value stack density and platform continuity over the higher cost of jumping immediately to the next generation.
HBM3 architecture in this segment remains tied to standards-defined technical limits on interface width and transfer capability, which is why the most advanced capacity points are used in bandwidth-intensive simulation, scientific computing, and tightly packed server environments rather than in broad, low-cost volume deployment. Suppliers also continue to invest in methods that reduce warpage, delamination, and stack stress in high-layer packages, since the commercial future of larger HBM3 stacks depends on making those devices reliable enough for sustained deployment. That effort supports the HBM3 market by keeping higher-capacity options commercially viable for customers who care more about deployed productivity than about being first to move to HBM4. It also suggests that the segment will remain available throughout most of the forecast period because the technical work required to support it is still considered economically meaningful by memory vendors.

By Processor Interface:
ASIC Momentum Diversifies Demand Beyond GPU Installed BaseGPU held 73.29% of processor interface revenue in 2025, underscoring how strongly the HBM3 market was shaped by the installed base built around NVIDIA H100-class training infrastructure. That dominance came from the fact that GPU remained the reference platform for large-scale AI training, and the bulk of HBM3 deployment followed that hardware cycle. AI accelerators and ASICs are projected to grow at a 1.61% CAGR through 2031, making it the fastest-growing processor interface segment in the HBM3 market as custom silicon programs expand the demand base. The HBM3 market gains resilience from this shift because buyer concentration falls when custom accelerator projects from large cloud operators and platform builders consume HBM3E within the same broader supply ecosystem. The HBM3 industry, therefore, becomes less dependent on one merchant GPU roadmap and more tied to a broader set of long-cycle compute programs.
This matters because custom accelerator procurement often runs on multi-year allocation agreements, which improve visibility for memory suppliers even as public GPU cycles transition to newer generations. CPU and FPGA interfaces remain smaller contributors because power delivery, controller complexity, and mainstream server economics still favor DDR5 in standard deployments. Even so, FPGA-based systems continue to matter in aerospace, defense, and specialized embedded compute because these programs undergo long qualification windows and do not migrate quickly to the latest memory generation. The HBM3 market, therefore, retains useful demand outside the main GPU base, and that diversification helps explain why revenue remains positive even after HBM4 entered production.
By Packaging Type:
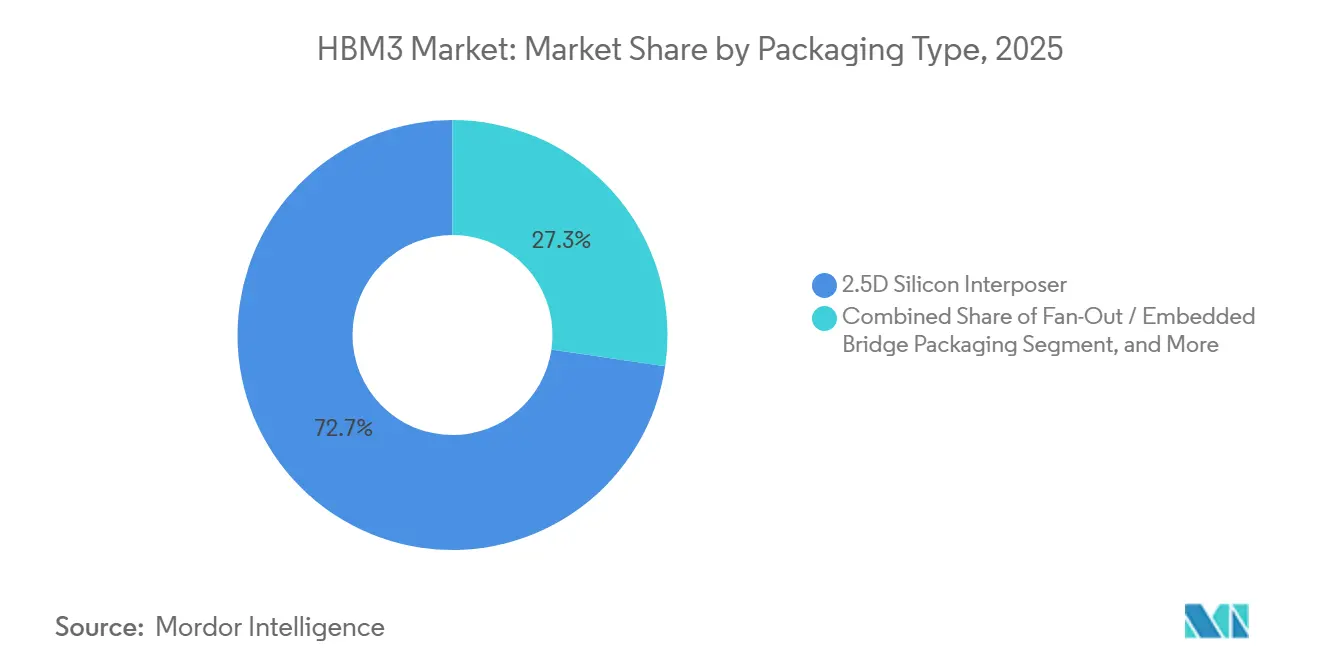
Fan-Out Alternatives Gain Ground as Interposer Limits EmergeThe 2.5D silicon interposer segment accounted for 72.67% of packaging revenue in 2025, confirming it remained the primary integration route across the HBM3 market while also showing that alternative formats already captured a meaningful share. That leadership reflected the installed manufacturing base, design familiarity, and system-level trust attached to interposer-based assembly in high-end AI and HPC platforms. Fan-out and embedded bridge packaging is projected to grow at a 1.18% CAGR through 2031, making it the fastest-growing packaging route in the HBM3 market as the supply chain navigates interposer limits and seeks lower-cost scaling paths. The HBM3 market benefits from this shift because more packaging choices reduce dependence on a single constrained route and make it easier for buyers to sustain procurement when conventional capacity tightens. Embedded bridge research presented at the 2025 Electronics Packaging Technology Conference showed that fan-out-based approaches can support HBM integration in large chip modules, providing technical support for the move away from exclusive reliance on monolithic interposer structures.
The same direction is visible in platform-level packaging development beyond the HBM3 supplier group itself. Synopsys and Intel Foundry stated that EMIB-T packaging can support very large formats with TSV-enabled power delivery, which reinforces the broader industry movement toward bridge-based and heterogeneous package integration. Other advanced packaging types remain limited to earlier-stage qualification and engineering programs, so they do not materially alter the near-term structure of the HBM3 market. Even so, the growth of fan-out and bridge options makes pricing more competitive at the integration layer, and that supports continued demand for HBM3-based systems by trimming part of the total system cost burden.
By Application:
Inference Growth Reflects a Structural Shift in HBM3 Workload MixAI training accounted for 55.31% of application revenue in 2025, making it the largest workload category in the HBM3 market, as the strongest early deployments centered on large training clusters. That outcome followed the broad buildout of H100-based infrastructure, in which HBM3 served as the memory foundation for large language model training in hyperscale and enterprise environments. AI inference is projected to grow at a 1.84% CAGR through 2031, making it the fastest-growing application in the HBM3 market, as more production workloads remain on already-certified systems rather than moving immediately to HBM4. Micron stated that HBM3E can deliver 1.4x the inference throughput improvement over HBM3 in H200-class configurations, but the same comparison also shows why operators weigh migration costs carefully when large fleets still have useful life left. The HBM3 market, therefore, continues to draw support from inference fleets that are expensive to recertify, re-cool, and reconfigure before their depreciation cycles close.
HPC servers, networking, and telecom remain steady contributors because procurement in those areas often follows institutional or infrastructure schedules that are less reactive than commercial GPU refresh cycles. Graphics faces a weaker outlook because gaming-oriented designs continue to favor lower-cost memory architectures, where HBM is harder to justify on system economics alone. Automotive and other specialized compute uses remain smaller in volume, yet they are durable because qualification windows are long and platform changes are tightly controlled. Siemens EDA noted in 2026 that HBM3E and HBM4 remain central design targets for advanced automotive and HPC memory planning, which supports the view that specialized compute applications will continue to sustain a meaningful HBM3-era demand base during the transition window.
By End Use Industry:
Enterprise IT Adoption Lag Sustains Demand Beyond the Hyperscale CycleCloud service providers accounted for 69.72% of end-user revenue in 2025, indicating that the HBM3 market remained primarily driven by hyperscaler buying patterns during the main deployment phase. That concentration meant overall revenue direction was closely tied to the timing of large cloud refresh cycles and the sequencing of hardware migration decisions. Enterprise IT is projected to grow at a 1.79% CAGR through 2031, making it the fastest-growing end-use segment in the HBM3 market, as enterprises typically adopt these systems after hyperscalers validate the platforms and absorb the first wave of deployment risk. The HBM3 market, therefore, benefits from a lag effect, where enterprise procurement in 2025 and 2026 continues to support HBM3-class systems while hyperscalers begin redirecting some leading-edge demand toward HBM4. Telecommunications also adds stability because network processing deployments follow long qualification and replacement windows, which delay abrupt memory-spec changes at the installed base level.
Automotive, aerospace, and defense remain smaller segments, yet they are structurally resilient because design cycles are long and memory choices remain fixed through extended platform lives. The HBM3 market maintains a foothold in these areas because proven memory behavior, qualification continuity, and system certification often matter more than immediate migration to the latest generation. Export controls also reinforce that behavior by segmenting where advanced memory can be sold and how replacement supply can be maintained for sensitive programs. The Bureau of Industry and Security established HBM-specific controls under ECCN 3A090.c. Effective December 2, 2024, this adds another layer of planning discipline for end users who must secure a stable, compliant supply over multi-year operating periods.
Geography Analysis
APAC HBM3 Market
Asia-Pacific accounted for 71.41% of revenue in 2025, making it the core production and value center of the HBM3 market. That position comes from South Korea’s concentration in TSV-stacked HBM manufacturing and Taiwan’s central role in advanced packaging, especially in the interposer and CoWoS ecosystem that still underpins much of HBM3 system assembly. The HBM3 market in Asia-Pacific also benefits from deep supplier relationships, process knowledge, and manufacturing coordination built during earlier deployment cycles that remain useful as the industry navigates a generational transition. China’s role in the broader region is more limited than pure infrastructure demand might suggest, because HBM export restrictions introduced a harder boundary on advanced memory access from late 2024. The Bureau of Industry and Security confirmed those controls on HBM under ECCN 3A090.c, effectively reshaping the regional addressable base and redirecting part of the deployment logic for advanced AI memory.[4]
North America HBM3 Market
North America is projected to grow at a 1.57% CAGR through 2031, making it the fastest-growing regional block in the HBM3 market. Demand in this region is supported by enterprise IT procurement cycles that trail hyperscaler adoption and by the growing policy push to localize advanced semiconductor packaging and manufacturing. The SK hynix CHIPS-backed Indiana project is important here because it creates a domestic packaging and research-and-development anchor that aligns with the period when North American enterprise demand for HBM3-class systems remains active. The National Institute of Standards and Technology confirmed that the project includes up to USD 458 million in direct funding and is expected to enter mass production in the second half of 2028.
MEA and South America HBM3 Market
Europe remains a smaller but steady part of the HBM3 market because procurement is tied more closely to institutional HPC spending, public research systems, and structured technology programs than to large-scale hyperscaler hardware refreshes. That gives the region a more measured demand profile, with volume limited but program continuity stronger across multi-year procurement cycles. South America, the Middle East, and Africa remain early-stage demand pools in the HBM3 market, and their activity is likely to be linked to edge data center buildout, sovereign AI programs, and imported, accelerated systems rather than local fabrication. These regions are likely to keep using proven HBM3-based configurations in the near term because supply accessibility, qualification maturity, and deployment speed remain more important than immediate adoption of the newest memory generation.
Competitive Landscape
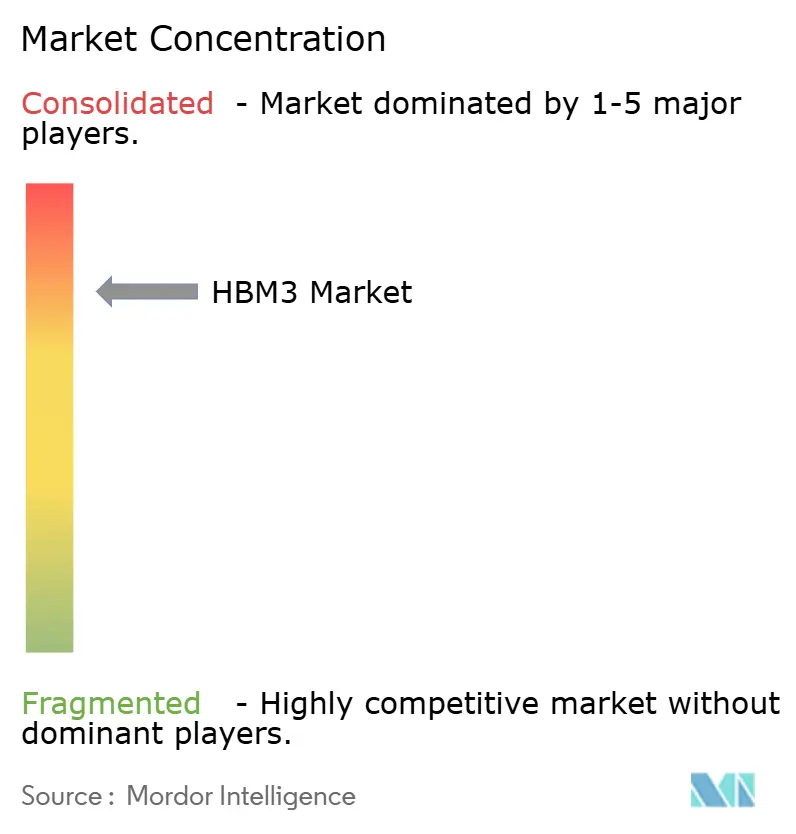
The HBM3 market remains highly concentrated, with SK Hynix, Samsung Electronics, and Micron Technology controlling the commercially viable supply base for this class of stacked memory. The HBM3 market is therefore best described as an oligopoly rather than a broad competitive field, since no meaningful new entrant is positioned to reach scale within the forecast window. SK hynix built an early advantage through faster qualification on the leading GPU cycle, and that helped it secure the most visible leadership position during the main HBM3 deployment wave. Samsung and Micron remain credible challengers because both have continued to close process and qualification gaps while preparing their portfolios for overlap between HBM3E and HBM4. As a result, competition in the HBM3 market is not based on a large number of suppliers, but on how three suppliers balance yield, customer qualification, packaging access, and timing across overlapping product generations.
Strategic moves in this market show that suppliers are competing on ecosystem control as much as on memory die performance. SK hynix’s Indiana advanced packaging project is a clear example because it adds a localized packaging and research-and-development footprint that can improve customer access in North America and reduce dependence on cross-border supply. Another example came in June 2026, when SK hynix shipped 12-layer HBM4E samples to major customers, signaling that suppliers are using next-generation qualification progress to defend long-term account positions even as HBM3 systems continue shipping. The HBM3 market is also shaped by packaging strategy, where bridge-based and heterogeneous integration routes are becoming a competitive lever for system designers who want alternatives to the most constrained assembly pathways.
Competition beyond the memory suppliers also matters because interface IP, advanced packaging capability, and capital equipment shape who can participate effectively in the broader HBM3 market. Synopsys and Intel Foundry’s EMIB-T work shows that packaging innovation is becoming a key part of competitive positioning, especially for larger HBM-integrated formats that aim to expand beyond the historical CoWoS-centered route. Equipment suppliers such as Applied Materials, Lam Research, KLA Corporation, and Tokyo Electron remain strategically important because their tools enable TSV etch, deposition, bonding, and inspection across both HBM3 and HBM4 production. That makes the broader ecosystem durable even as the front-end memory competition stays tightly concentrated.
HBM3 Industry Leaders
-
SK hynix Inc.
-
Samsung Electronics Co., Ltd.
-
Micron Technology, Inc.
- *Disclaimer: Major Players sorted in no particular order
HBM3 Market Companies Covered in this Report
- SK hynix Inc.
- Samsung Electronics Co., Ltd.
- Micron Technology, Inc.
Recent Industry Developments in HBM3 Market
- April 2026: It had been 3 years since SK hynix developed Industry’s first 12-Layer HBM3 and provided samples to customers.
- December 2025: it has been one year since US BIS export control on HBM became effective on December 2, 2024, placing HBM under ECCN 3A090.c and restricting exports to China-headquartered entities or to those with ultimate parent companies in China, introducing a new License Exception HBM (AES C71).
Global HBM3 Market Report Scope
The HBM3 market is segmented by Memory Capacity Per Stack (Up to 8 GB, 12–16 GB, and Above 16 GB), Processor Interface (GPU, CPU, AI Accelerator and ASIC, FPGA, and Other Interfaces), Packaging Type (2.5D Silicon Interposer, Fan-Out / Embedded Bridge Packaging, and Other Advanced Packaging), Application (Graphics, AI Training, AI Inference, High-Performance Computing (HPC) Servers, Networking and Telecommunications, and Other Applications), End Use Industry (Cloud Service Providers, Enterprise IT, Telecommunications, Automotive, Aerospace and Defense, and Other End-user Industries), and Geography (North America, Europe, Asia-Pacific, South America, and the Middle East and Africa. The Market Forecasts are Provided in Terms of Value (USD).
Segmentation Overview
| Up to 8 GB |
| 12 to 16 GB |
| Above 16 GB |
| GPU |
| CPU |
| AI Accelerator and ASIC |
| FPGA |
| Other Interfaces |
| 2.5D Silicon Interposer |
| Fan-Out / Embedded Bridge Packaging |
| Other Advanced Packaging |
| Graphics |
| AI Training |
| AI Inference |
| High-Performance Computing (HPC) Servers |
| Networking and Telecommunications |
| Other Applications |
| Cloud Service Providers |
| Enterprise IT |
| Telecommunications |
| Automotive |
| Aerospace and Defense |
| Other End-user Industries |
| North America | United States |
| Canada | |
| Mexico | |
| Europe | Germany |
| United Kingdom | |
| France | |
| Italy | |
| Rest of Europe | |
| Asia-Pacific | China |
| Japan | |
| South Korea | |
| Taiwan | |
| India | |
| Rest of Asia-Pacific | |
| South America | |
| Middle East and Africa |
| By Memory Capacity Per Stack | Up to 8 GB | |
| 12 to 16 GB | ||
| Above 16 GB | ||
| By Processor Interface | GPU | |
| CPU | ||
| AI Accelerator and ASIC | ||
| FPGA | ||
| Other Interfaces | ||
| By Packaging Type | 2.5D Silicon Interposer | |
| Fan-Out / Embedded Bridge Packaging | ||
| Other Advanced Packaging | ||
| By Application | Graphics | |
| AI Training | ||
| AI Inference | ||
| High-Performance Computing (HPC) Servers | ||
| Networking and Telecommunications | ||
| Other Applications | ||
| By End Use Industry | Cloud Service Providers | |
| Enterprise IT | ||
| Telecommunications | ||
| Automotive | ||
| Aerospace and Defense | ||
| Other End-user Industries | ||
| By Geography | North America | United States |
| Canada | ||
| Mexico | ||
| Europe | Germany | |
| United Kingdom | ||
| France | ||
| Italy | ||
| Rest of Europe | ||
| Asia-Pacific | China | |
| Japan | ||
| South Korea | ||
| Taiwan | ||
| India | ||
| Rest of Asia-Pacific | ||
| South America | ||
| Middle East and Africa | ||
Key Questions Answered in the Report
How large is the HBM3 market in 2026 and where will it reach by 2031?
The HBM3 market stands at USD 1.12 billion in 2026 and is forecast to reach USD 1.16 billion by 2031, with a 0.64% CAGR over 2026-2031.
Why does HBM3 remain relevant after HBM4 entered production?
HBM3 remains relevant because it has an installed base, a mature supply chain, lower integration cost, and ongoing demand from enterprise IT, inference workloads, and extended hardware depreciation cycles.
Which application leads HBM3 demand today?
AI training led application demand with 55.31% revenue share in 2025, reflecting the large installed base of H100-era training infrastructure.
Which application is growing the fastest through 2031?
AI inference is the fastest-growing application, with a projected 1.84% CAGR, as operators keep certified HBM3 systems in production before migrating to newer platforms.
Which region dominates HBM3 revenue?
Asia-Pacific led with 71.41% revenue share in 2025 because South Korea and Taiwan remain central to HBM production and advanced packaging.
What is the biggest challenge holding back HBM3 growth?
The main challenge is the combination of yield loss and thermal pressure in high-stack devices, along with packaging capacity constraints that limit how much demand can be converted into shipments.