Green Code Analysis and Optimization Software Market Size and Share
Market Overview
| Study Period | 2020 - 2031 |
|---|---|
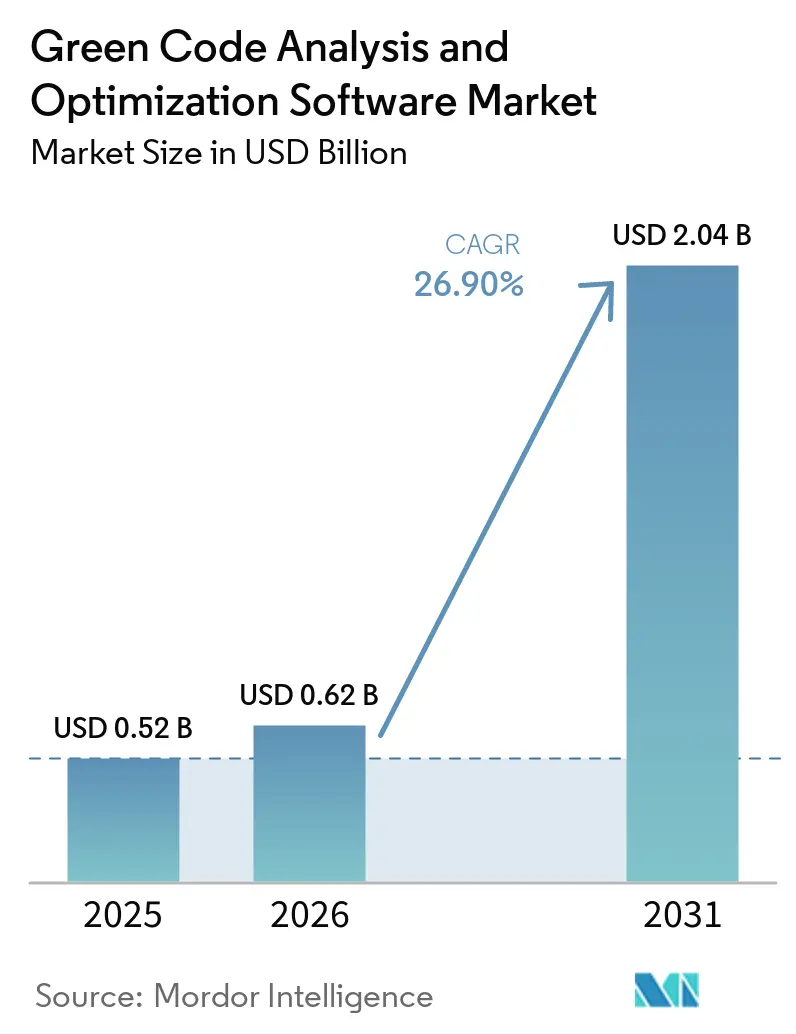
| Market Size (2026) | USD 0.62 Billion |
| Market Size (2031) | USD 2.04 Billion |
| Growth Rate (2026 - 2031) | 26.90% CAGR |
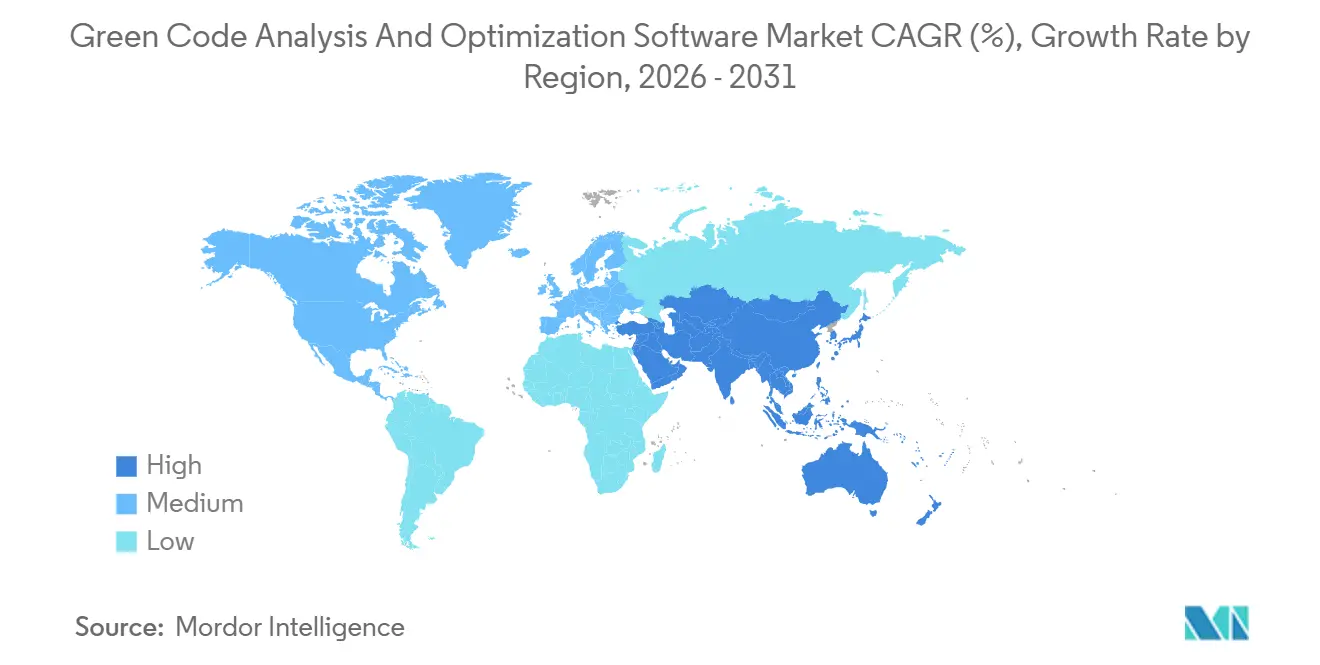
| Fastest Growing Market | Asia-Pacific |
| Largest Market | Europe |
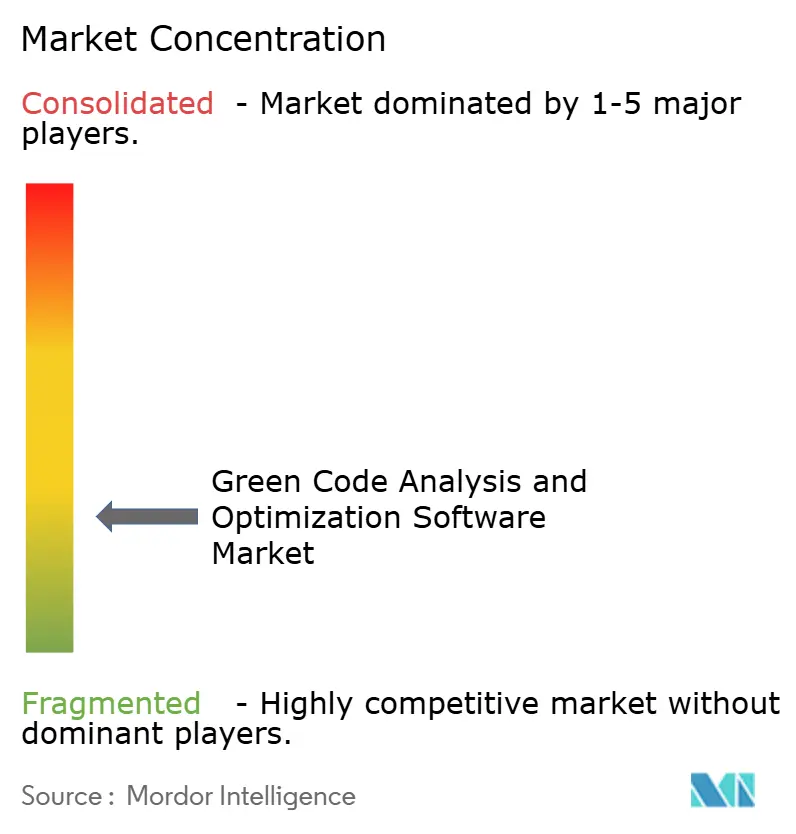
| Market Concentration | Low |
Major Players *Disclaimer: Major Players sorted in no particular order Image © Mordor Intelligence. Reuse requires attribution under CC BY 4.0. | |
Green Code Analysis and Optimization Software Market Analysis by Mordor Intelligence
The green code analysis and optimization software market size is projected to be USD 0.52 billion in 2025, USD 0.62 billion in 2026, and reach USD 2.04 billion by 2031, growing at a CAGR of 26.9% from 2026 to 2031. Demand is being shaped by a sharp rise in computing power use, with global data center electricity consumption reaching 361.6 TWh in 2025 and projected to reach 945 TWh by 2030, pushing enterprises to address software waste before it becomes larger infrastructure costs. That shift is making software-layer optimization more practical than hardware replacement alone, so enterprise buyers are moving toward tools that can measure, compare, and reduce code-related emissions inside normal engineering workflows. The green code analysis and optimization software market also reflects a procurement shift in Europe, where CSRD reporting timelines and software carbon clauses in supplier contracts are pushing buyers to formalize expectations around software efficiency and measurement. Adoption is broadening from stand-alone measurement products to CI/CD automation, hybrid telemetry, and runtime optimization, which shows that buyers are no longer treating code sustainability as a one-time audit task. Growth is also being sustained by large-enterprise demand, rising SME participation, and an active vendor field where open-source plugins, specialists, and cloud-native platforms compete without a single company controlling the full green-code analysis and optimization software market.
Key Report Takeaways
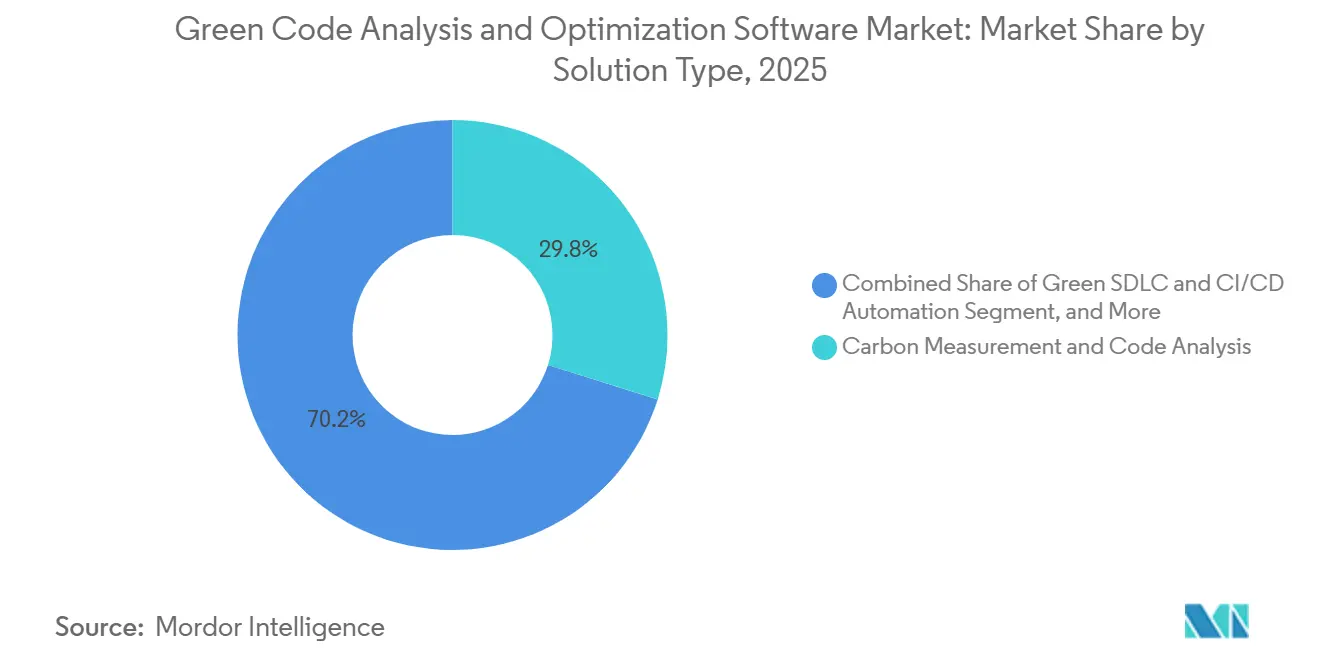
- By solution type, Carbon Measurement and Code Analysis accounted for 29.84% of green code analysis and optimization software market revenue in 2025, while Green SDLC and CI/CD Automation are projected to grow at a 27.56% CAGR through 2031.
- By deployment mode, Cloud held 66.12% of the green code analysis and optimization software market share in 2025, while Hybrid is projected to grow at 27.34% CAGR through 2031.
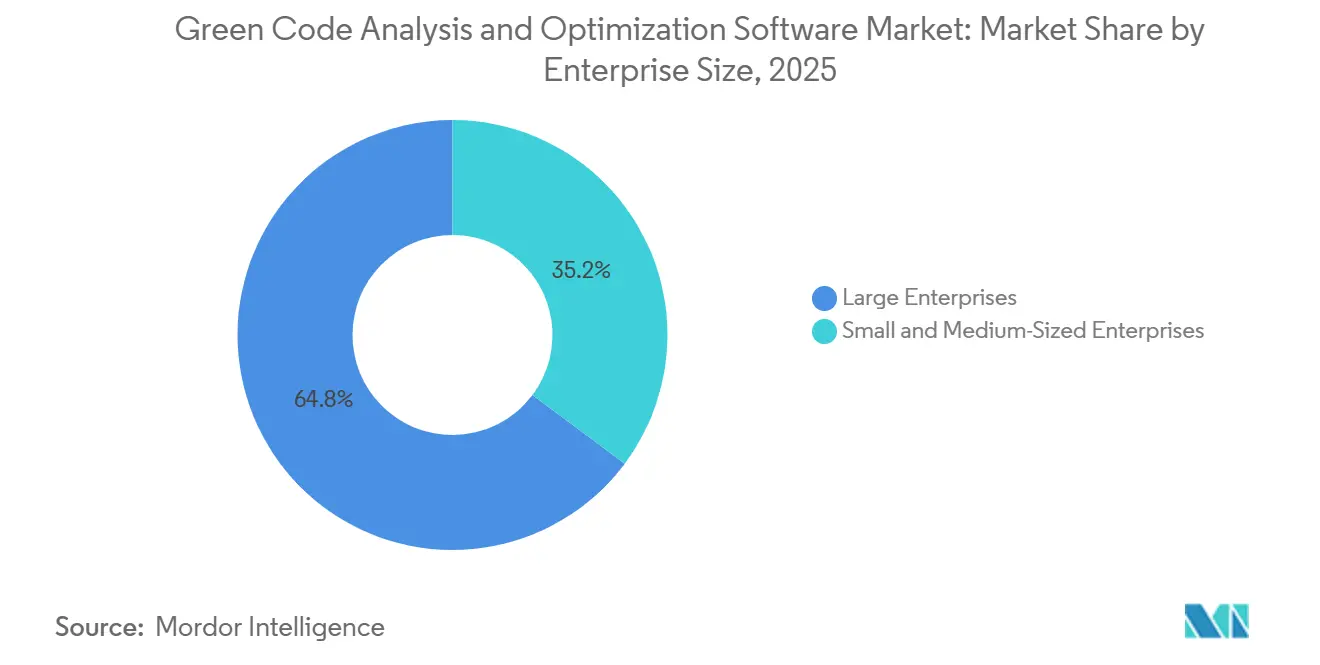
- By enterprise size, large enterprises accounted for 64.78% of the green code analysis and optimization software market in 2025, while small and medium-sized enterprises are projected to expand at a 28.12% CAGR through 2031.
- By end-use industry, IT and Telecom accounted for 26.41% of revenue in 2025, while Retail and E-Commerce are forecast to grow at a 27.05% CAGR through 2031.
- By geography, Europe held 34.67% share in 2025, while Asia-Pacific is projected to expand at 28.45% CAGR through 2031.
Note: Market size and forecast figures in this report are generated using Mordor Intelligence’s proprietary estimation framework, updated with the latest available data and insights as of January 2026.
Global Green Code Analysis and Optimization Software Market Trends and Insights
Drivers Impact Analysis*
| Driver | (~) % Impact on CAGR Forecast | Geographic Relevance | Impact Timeline |
|---|---|---|---|
| Rising Software Carbon Governance Requirements | +7.5% | Global, with concentrated early adoption in EU, UK, and Australia | Short term (≤ 2 years) |
| AI Workload Efficiency Pressure in Cloud-Native Environments | +6.2% | Global, core markets in North America and APAC hyperscale corridors | Short term (≤ 2 years) |
| Code-Level Energy Waste Visibility in CI/CD Pipelines | +5.0% | Global, strongest pull in North America and Northern Europe | Medium term (2-4 years) |
| FinOps and GreenOps Convergence in Enterprise Engineering Teams | +3.8% | North America and EU primarily, extending to APAC cloud-native adopters | Medium term (2-4 years) |
| Carbon-Aware Application Scheduling and Runtime Optimization | +2.9% | North America, EU, APAC, with spillover to MEA as renewable grid penetration rises | Long term (≥ 4 years) |
| Sustainability-by-Design Procurement Clauses from Large Buyers | +2.3% | EU and UK public sector with early uptake in Australia and Canada | Medium term (2-4 years) |
| Source: Mordor Intelligence | |||
Rising Software Carbon Governance Requirements
Enterprise software teams are no longer setting their own pace on environmental disclosure because external rules now define the timetable. CSRD Wave 1 required large listed companies to disclose software-related emissions for the financial year 2024, with reporting taking place in 2025, thereby moving software-related emissions from an internal topic into formal reporting practice. The February 24, 2026, Omnibus Directive adjusted applicability to companies with more than 1,000 employees and EUR 450 million in turnover (USD 509 million), but the broader supply-chain pressure persists because large buyers continue to pass disclosure requirements to vendors through questionnaires and contract terms. The Software Carbon Intensity framework was formalized as ISO/IEC 21031:2024 in March 2024, and the Green Software Foundation states that organizations, including Microsoft, NTT DATA, AVEVA, and UBS, are already applying it as a practical measurement base. A second standards track is also forming through ISO/IEC TS 20125-1:2026, which sets ecodesign requirements across the digital service life cycle from requirements gathering to end-of-life. This mix of reporting rules and technical standards is providing the green code analysis and optimization software market with a direct procurement channel, as buyers increasingly want software vendors to demonstrate how code emissions are measured and controlled.[1]Green Software Foundation, “Software Carbon Intensity (SCI) Specification,” Green Software Foundation, greensoftware.foundation
AI Workload Efficiency Pressure in Cloud-Native Environments
The economics of AI workloads are making software efficiency a board-level budget issue rather than a niche sustainability topic. Global data center electricity consumption reached 361.6 TWh in 2025 and is projected to reach 945 TWh by 2030, providing enterprises with a strong incentive to reduce waste before workloads scale further. In April 2026, MIT researchers published a rapid prediction tool that helps data center operators estimate workload-level power use before deployment, which fits directly into pre-production software review and deployment planning. Google also reported that its seventh-generation Ironwood TPUs deliver a 3.7x improvement in Compute Carbon Intensity over the previous TPU v5p generation, confirming that hardware efficiency is improving but not removing the need for software-side control. When inference demand rises faster than engineering teams can optimize application logic, even the best hardware can be offset by wasteful software design and avoidable token-generation overhead. That gap is expanding the market for green code analysis and optimization software, as finance teams now see code inefficiency as a direct driver of compute costs.[2]International Organization for Standardization, “ISO/IEC TS 20125-1:2026 Information Technology Digital Services Ecodesign Part 1 Ecopractices for Life Cycle Stages,” ISO, iso.org
Code-Level Energy Waste Visibility in CI/CD Pipelines
CI/CD pipelines have become an important entry point for the green code analysis and optimization software market because engineering teams can act on software waste only when it is visible inside normal delivery workflows. A 2025 peer-reviewed analysis estimated that the GitHub Actions ecosystem alone generated 3,162 tonnes of CO2 in 2024, with redundant scheduled runs and runner placement among the largest sources of waste.[3]Google Cloud, “Ironwood TPUs Deliver 3.7x Carbon Efficiency Gains,” Google Cloud Blog, cloud.google.com Fastly’s July to August 2025 survey of 801 developers found that 77% actively considered green coding, yet 54% said the lack of measurement tools was their top obstacle. That mismatch is pushing buyers toward tools that can attach carbon and energy metrics to pull requests, build jobs, and deployment events, where developers already make practical decisions. Research published in June 2026 showed that automated refactoring of inefficient code patterns improved application sustainability by 29%, further strengthening the commercial case for automated analysis in CI/CD environments. The Green Software Foundation’s SOFT framework, ratified in 2025 and scheduled for fuller rollout in 2026, also gives enterprises a way to connect those pipeline-level improvements to auditable organizational metrics.
FinOps and GreenOps Convergence in Enterprise Engineering Teams
Cost control and carbon control are increasingly handled as a single operating issue within cloud engineering teams. The FinOps Foundation has formalized this overlap through its cloud sustainability working group, which frames environmental outcomes and financial efficiency as linked rather than separate objectives. This matters because the same workload data that exposes unused capacity, overprovisioning, and poor scheduling also helps teams identify avoidable carbon output. As a result, buyers do not need two separate software justifications when one tool can support both spend governance and emissions governance. That is making the green code analysis and optimization software market more relevant to finance stakeholders, platform teams, and procurement offices in the same buying cycle. The effect is strongest where enterprises already measure cloud usage at the the workload, service, and team levels, because those organizations can integrate carbon analytics into existing operating routines with less change resistance.
Restraint Impact Analysis*
| Restraint | (~) % Impact on CAGR Forecast | Geographic Relevance |
|---|---|---|
| Limited Green Code Telemetry Standardization Across Toolchains | -3.4% | Global, most acute in multi-cloud and hybrid DevOps environments |
| High Integration Effort With Legacy DevOps and Observability Stacks | -2.7% | North America and EU, pronounced in Financial Services and Manufacturing |
| Fragmented Developer Buy-In Beyond Core Platform Teams | -2.1% | Global, most critical in organizations without centralized platform engineering |
| Ambiguous Short-Term ROI for Code-Only Optimization Programs | -1.6% | North America and APAC, where FinOps maturity is advanced but GreenOps is still developing |
| Source: Mordor Intelligence | ||
Limited Green Code Telemetry Standardization Across Toolchains
The green code analysis and optimization software market still faces a real friction point because software carbon measurement is not yet standardized across all toolchains and runtime environments. ISO/IEC 21031:2024 provides a common methodology, but user adoption still depends on vendor-specific implementations across languages, services, containers, and cloud environments. Research published in MDPI’s Software journal highlighted persistent issues with measurement granularity and the lack of real-time energy data from major cloud providers, forcing teams to rely on estimates rather than fully instrumented actuals.[4]Francesca Arcelli Fontana et al., “Green DevOps A Strategic Framework for Sustainable Software Development,” Software, mdpi.com That makes it harder for buyers to compare tools on a like-for-like basis and slows large procurement decisions across multi-cloud estates. The Green Software Foundation’s hardware standards work is intended to improve lower-level telemetry support, but industry alignment and adoption typically take time. Until teams can capture consistent carbon data across languages and infrastructure layers, enterprise rollouts in the green code analysis and optimization software market will continue to move more slowly than interest levels suggest.
High Integration Effort With Legacy DevOps and Observability Stacks
Integration effort remains a practical barrier because many enterprise development stacks were built long before green instrumentation became a buying requirement. Carbon telemetry often has to be inserted into CI/CD runners, observability systems, and deployment pipelines that were designed around speed, uptime, and security rather than software emissions. That creates direct competition with feature roadmaps, migration programs, and technical debt reduction budgets, especially in organizations with older codebases and tightly coupled tooling. Attribution is also harder in legacy estates because poor documentation and monolithic service patterns make it difficult to trace energy use to specific functions or services. Vendors that can deploy through agent-based or low-change methods are therefore gaining more attention in the green code analysis and optimization software market than tools that require full pipeline redesign. The constraint does not stop adoption, but it stretches implementation timelines and raises total ownership cost for buyers who did not build sustainability instrumentation from the start.
*Our forecasts treat driver/restraint impacts as directional, not additive. The impact forecasts reflect baseline growth, mix effects, and variable interactions.
Segment Analysis
By Solution Type: Measurement Leads While CI/CD Automation Scales
Carbon Measurement and Code Analysis held 29.84% of the green code analysis and optimization software market share in 2025, which shows that most buyers still begin with visibility before moving to optimization. That pattern reflects the practical need to establish a baseline before engineering teams can justify code changes, runtime tuning, or procurement decisions. The Software Carbon Intensity method, formalized as ISO/IEC 21031:2024, is providing buyers with a common reference point, strengthening demand for tools that can measure emissions consistently. The SCI for AI specification, ratified in December 2025, extended that logic into AI training, fine-tuning, and inference, adding a new demand layer for organizations that did not previously track software-specific emissions in those workloads. Green SDLC and CI/CD Automation is projected to expand at a 27.56% CAGR through 2031, indicating that buyers are moving from stand-alone audits to continuous controls embedded in software delivery.
This change matters because the green code analysis and optimization software industry is shifting accountability away from isolated ESG teams and into mainstream engineering practice. Runtime Optimization and Resource Efficiency are growing alongside measurement, as enterprises seek to translate carbon diagnostics into practical rightsizing and workload actions. Sustainability Analytics and Benchmarking also remain relevant, since buyers need comparison views across applications, teams, and business units before they can prioritize remediation. Governance, Compliance, and Certification tools are gaining traction in regulated sectors, where procurement teams seek audit-ready documentation aligned with broader environmental reporting expectations. Tech Mahindra’s Green CodeRefiner, built with Microsoft, reported a 20% to 40% improvement in green impact scores across modernized application codebases, demonstrating that integrated tooling can move beyond scoring into measurable code-improvement programs.


By Deployment Mode: Cloud Holds the Lead While Hybrid Expands Quickly
Cloud accounted for a 66.12% share of the green code analysis and optimization software market in 2025, reflecting the cloud-first posture of enterprises that moved earliest toward software sustainability. SaaS delivery lowers deployment friction for platform teams that already operate in dynamic environments and prefer centralized tool administration. Native cloud carbon dashboards from major providers also provide a basic data layer that can connect with third-party software for analysis and optimization. Hybrid deployment is projected to grow at a 27.34% CAGR through 2031, making it the fastest-growing deployment model in the green code analysis and optimization software market. That growth is being driven by regulated sectors that need carbon visibility across both private infrastructure and public cloud.
On-premise deployment remains smaller, but it still serves sovereignty-sensitive environments in defense, government, and regulated financial institutions. The European Commission’s Sovereign Cloud Framework awarded an EUR 180 million contract, or USD 204 million, to four providers in April 2026 and included environmental sustainability as 1 of 8 sovereignty criteria, which signals that even sensitive environments are being asked to address green performance. That is important because it broadens demand beyond purely cloud-native organizations and into buyers that previously treated sustainability tooling as optional. As these estates modernize, hybrid telemetry becomes more valuable because it supports a single operating view across distributed systems. The green code analysis and optimization software market, therefore, favors vendors that can connect cloud, private infrastructure, and legacy estates without forcing clients into a single infrastructure model.
By Enterprise Size: Large Enterprises Lead While SMEs Add Momentum
Large enterprises accounted for 64.78% of the green code analysis and optimization software market in 2025 because they had the staffing, budgets, and DevOps maturity needed to absorb measurement and integration work. These companies are more likely to have dedicated sustainability engineering functions, central platform teams, and cloud bills large enough to make software efficiency a visible financial issue. That scale also helps them justify formal benchmarking and process change across broad application estates. Cast AI’s customer references include BMW, Cisco, and FICO, which illustrates how large cloud users are turning optimization into a standard operating discipline rather than a one-off project. Software Improvement Group’s Sigrid platform also draws on over 270 billion lines of code across more than 20,000 systems, giving large buyers the benchmarking depth they often want before committing to broad governance programs.
Small and medium-sized enterprises are projected to grow at a 28.12% CAGR through 2031, making them the structural growth engine of the green code analysis and optimization software market. Their demand is being driven less by internal ESG ambition and more by downstream requirements from larger customers, especially as supply-chain contracts now require clearer emissions reporting. That matters because SMEs often sit inside broader software delivery chains even when they do not control final procurement standards. Affordable SaaS tools and lighter CI/CD integrations are lowering adoption barriers for teams without dedicated sustainability specialists. The green code analysis and optimization software industry is, therefore, becoming more accessible to mid-tier vendors that need practical compliance support, cost reduction, and customer retention rather than large-scale transformation programs.
By End-Use Industry: IT and Telecom Anchors Demand While Retail Accelerates
IT and Telecom accounted for 26.41% of the green code analysis and optimization software market in 2025, reflecting the sector’s direct exposure to cloud spending and application performance economics. These firms are often both the earliest users and builders of software carbon tooling, giving them a natural lead in adoption. Platform engineering teams in this vertical are more likely to treat code, runtime, and cloud efficiency as part of a single operating model. The sector also sits close to standards development, which helps it adopt measurement frameworks earlier than other industries. In March 2026, NTT helped formulate cradle-to-grave CO2 calculation rules for the full software product life cycle in Japan, covering procurement, development, operation, and end-of-life, which shows how closely the sector is tied to emerging governance frameworks.
Retail and E-Commerce is forecast to grow at a 27.05% CAGR through 2031, making it the fastest-growing end-use segment in the green code analysis and optimization software market. Its momentum comes from software emissions across logistics, order management, digital commerce flows, and customer-facing platforms, where inefficiency is both visible and expensive. Retail software estates also generate a high volume of transactions, which means even small code waste can quickly compound into larger infrastructure costs and increased emissions exposure. BFSI remains another important vertical because disclosure expectations and energy-intensive analytics environments keep software efficiency on the operating agenda. Manufacturing, Energy and Utilities, Oil and Gas, Food and Beverage Manufacturing, Construction and Infrastructure, and Government and Public Sector are widening the green code analysis and optimization software industry base as buyers apply the same accountability logic to operational software that they already apply to physical assets and energy use.
Geography Analysis
Europe held 34.67% of the green code analysis and optimization software market share in 2025, making it the largest regional contributor. The region’s lead comes from the most formal software sustainability environment, where CSRD and ESRS E1 have made software-related emissions more visible in enterprise reporting and procurement. Commission Implementing Regulation EU) 2026/718, applicable from June 30, 2026, adds minimum environmental sustainability requirements to public procurement procedures covering net-zero technologies, thereby strengthening demand for auditable evidence of software efficiency in government buying. The European Commission also proposed the Cloud and AI Development Act on June 3, 2026, with explicit focus on energy-efficient data center capacity and environmental sustainability rating rules, which increases downstream pressure on software deployed in regional infrastructure. Europe also benefits from a dense vendor base that includes SonarSource, Software Improvement Group, and Greenspector, which keeps the green code analysis and optimization software market close to both buyers and standard-setting activity.
Asia-Pacific is projected to grow at a 28.45% CAGR through 2031, making it the fastest-growing regional segment in the green code analysis and optimization software market. Japan is providing an important policy and procurement signal through NTT’s March 2026 cradle-to-grave software CO2 calculation rules, which align software life-cycle measurement more closely with enterprise purchasing and reporting needs. The region also combines rapid cloud expansion, local infrastructure build-out, and rising interest in software efficiency as digital services scale across industries. Cast AI’s 2025 office openings in India and Singapore, followed by later regional investment activity, show that vendors are actively prioritizing Asia-Pacific as the next major growth zone. China, India, Japan, South Korea, and Australia each add demand through different mixes of software procurement pressures, localization requirements, and cloud-optimization needs.
North America remained the second-largest regional market for green code analysis and optimization software because large enterprises in the region are already active in cloud optimization, AI infrastructure build-out, and FinOps practices. The United States does not yet have a single federal reporting framework equal to CSRD, but state-level climate accountability requirements and supply-chain pressure still keep software emissions on the enterprise agenda. South America is still a smaller market, led by growing cloud adoption and reporting expectations from multinational buyers, while the Middle East and Africa remain earlier-stage regions where national digital programs are beginning to intersect with sustainability reporting needs. The United Arab Emirates and Saudi Arabia are emerging first, while South Africa and Nigeria are moving more gradually because infrastructure constraints still limit the depth and consistency of telemetry across technology estates.

Competitive Landscape
The green code analysis and optimization software market is moderately fragmented, with open-source plugins, niche specialists, and cloud-native optimization platforms competing across overlapping parts of the value chain. No single vendor has a dominant position across measurement, runtime optimization, CI/CD automation, analytics, and compliance, which keeps pricing and positioning varied across the market. This structure also means buyers often evaluate multiple tool types at once rather than running a simple category comparison. Cast AI is the most heavily funded participant in the field, having raised USD 108 million in April 2025 and crossed a valuation above USD 1 billion in January 2026, before adding a strategic investment and a credit facility for further expansion. That capital gives it more room to expand across geography, product depth, and adjacent optimization categories inside the green code analysis and optimization software market.
Sonar is pursuing a different path by extending its code quality franchise into automation and remediation through its Agent-Centric Development Cycle framework and the SonarQube Remediation Agent, demonstrating how incumbents are absorbing green-adjacent capabilities to defend their installed base. Akamas is another clear example of specialist expansion, raising USD 10 million in February 2025 and then widening its autonomous Kubernetes optimization capabilities with HPA-aware optimization in February 2026. Tech Mahindra’s Green CodeRefiner, developed with Microsoft, shows that service-led vendors can compete by linking code modernization and sustainability outcomes into a single offer rather than selling measurement alone. Greenspector and GoCodeGreen remain relevant in narrower scoring and diagnostic roles where buyers want audit-ready application carbon analysis without a broader platform commitment. Competition in the green code analysis and optimization software market, therefore, depends heavily on whether the buyer’s first problem is measurement, remediation, runtime efficiency, or compliance reporting.
A clear white space remains around cross-cloud carbon telemetry aggregation tied directly to FinOps operating models. Buyers increasingly want a single, unified view that connects compute spend, code waste, infrastructure rightsizing, and reporting evidence without locking them into a single cloud or observability stack. Audit trails aligned with ISO/IEC 21031:2024 and CSRD-related reporting expectations are becoming basic requirements for larger enterprise deals. The green code analysis and optimization software market is therefore likely to remain moderately fragmented, as many enterprises will continue to combine open-source tools, specialists, and cloud-native platforms rather than standardize on a single vendor across all use cases.
Green Code Analysis and Optimization Software Industry Leaders
CAST AI Group Inc.
Akamas S.p.A.
Phaidra Inc.
Greenspector
GoCodeGreen Limited
- *Disclaimer: Major Players sorted in no particular order

Recent Industry Developments
- June 2026: The European Commission proposed the Cloud and AI Development Act (CADA) as part of its European Technological Sovereignty Package, explicitly mandating energy-efficient data center capacity and a forthcoming delegated regulation rating data centers on environmental sustainability. The Act is expected to create downstream code-efficiency requirements for all software deployed in EU cloud infrastructure, expanding compliance-driven demand for green code optimization tools.
- May 2026: Sonar globally launched the SonarQube Remediation Agent at ATxSummit 2026 in Singapore. The agent autonomously fixes code issues, scans every fix before deployment, and is positioned as a core pillar of the company's Agent Centric Development Cycle framework for AI-assisted software maintenance. Sonar began providing the agent as a paid offering in May 2026, with full rollout targeted by end of June 2026.
- April 2026: Cast AI Group Inc. released Container Live Migration capabilities for GCP and Azure, extended its Database Optimizer Index Advisor to MySQL, and made the Continuous Rebalancer generally available for Cast AI for Karpenter clusters. These updates reinforce the platform's carbon-efficiency value proposition by eliminating idle compute and reducing unnecessary node provisioning across cloud environments.
- March 2026: NTT, Inc. formulated cradle-to-grave CO2 calculation rules for the full software product lifecycle, covering procurement, development, operation, and end-of-life, aligned with Japan's Ministry of Economy, Trade, and Industry Carbon Footprint Guidelines. This is the first Japanese industry initiative to enable Scope 3 software emissions calculation across the entire supply chain, enabling green software procurement at a national scale


Global Green Code Analysis and Optimization Software Market Report Scope
The Green Code Analysis and Optimization Software market refers to digital platforms and services that embed sustainability intelligence into software development, testing, and runtime environments. These solutions provide capabilities such as carbon measurement and code analysis, runtime optimization for energy efficiency, green SDLC and CI/CD automation, sustainability analytics and benchmarking, and support for governance, compliance, and certification. By integrating carbon-aware practices into the software lifecycle, these systems help organizations reduce energy consumption, optimize resource utilization, and align IT operations with ESG and decarbonization goals.
The Green Code Analysis and Optimization Software market report is segmented by Solution Type (Carbon Measurement and Code Analysis, Runtime Optimization and Resource Efficiency, Green SDLC and CI/CD Automation, Sustainability Analytics and Benchmarking, Governance, Compliance and Certification), Deployment Mode (Cloud, Hybrid, and On-Premise), Enterprise Size (Large Enterprises, and Small and Medium-Sized Enterprises), End-Use Industry (IT and Telecom, BFSI, Industrial Manufacturing, Energy and Utilities, Oil and Gas, Retail and E-Commerce, Food and Beverage Manufacturing, Construction and Infrastructure, Government and Public Sector, and Other End-User Industries), and Geography (North America, South America, Europe, Asia-Pacific, Middle East, and Africa). The Market Forecasts are Provided in Terms of Value (USD).
| Carbon Measurement and Code Analysis |
| Runtime Optimization and Resource Efficiency |
| Green SDLC and CI/CD Automation |
| Sustainability Analytics and Benchmarking |
| Governance, Compliance and Certification |
| Cloud |
| Hybrid |
| On-Premise |
| Large Enterprises |
| Small and Medium-Sized Enterprises |
| IT and Telecom |
| BFSI |
| Industrial Manufacturing |
| Energy and Utilities |
| Oil and Gas |
| Retail and E-Commerce |
| Food and Beverage Manufacturing |
| Construction and Infrastructure |
| Government and Public Sector |
| Other End-User Industries |
| North America | United States |
| Canada | |
| Mexico | |
| South America | Brazil |
| Rest of South America | |
| Europe | Germany |
| United Kingdom | |
| France | |
| Italy | |
| Spain | |
| Russia | |
| Rest of Europe | |
| Asia-Pacific | China |
| India | |
| Japan | |
| South Korea | |
| Australia | |
| Rest of Asia-Pacific | |
| Middle East | Turkey |
| Saudi Arabia | |
| United Arab Emirates | |
| Rest of Middle East | |
| Africa | South Africa |
| Nigeria | |
| Rest of Africa |
| By Solution Type | Carbon Measurement and Code Analysis | |
| Runtime Optimization and Resource Efficiency | ||
| Green SDLC and CI/CD Automation | ||
| Sustainability Analytics and Benchmarking | ||
| Governance, Compliance and Certification | ||
| By Deployment Mode | Cloud | |
| Hybrid | ||
| On-Premise | ||
| By Enterprise Size | Large Enterprises | |
| Small and Medium-Sized Enterprises | ||
| By End-Use Industry | IT and Telecom | |
| BFSI | ||
| Industrial Manufacturing | ||
| Energy and Utilities | ||
| Oil and Gas | ||
| Retail and E-Commerce | ||
| Food and Beverage Manufacturing | ||
| Construction and Infrastructure | ||
| Government and Public Sector | ||
| Other End-User Industries | ||
| By Geography | North America | United States |
| Canada | ||
| Mexico | ||
| South America | Brazil | |
| Rest of South America | ||
| Europe | Germany | |
| United Kingdom | ||
| France | ||
| Italy | ||
| Spain | ||
| Russia | ||
| Rest of Europe | ||
| Asia-Pacific | China | |
| India | ||
| Japan | ||
| South Korea | ||
| Australia | ||
| Rest of Asia-Pacific | ||
| Middle East | Turkey | |
| Saudi Arabia | ||
| United Arab Emirates | ||
| Rest of Middle East | ||
| Africa | South Africa | |
| Nigeria | ||
| Rest of Africa | ||


Key Questions Answered in the Report
What is driving demand for green code analysis and optimization software?
Demand is being driven by regulatory pressure, AI-related power consumption, and the need to reduce software waste before it expands cloud infrastructure cost. The market is projected to grow from USD 0.62 billion in 2026 to USD 2.04 billion by 2031 at a 26.9% CAGR.
Why does Europe lead adoption?
Europe held 34.67% share in 2025 because CSRD, ESRS E1, and public procurement rules are pushing enterprises and public buyers to formalize software carbon reporting and purchasing requirements.
Which solution category is largest and which is growing fastest?
Carbon Measurement and Code Analysis led with 29.84% share in 2025, while Green SDLC and CI/CD Automation is the fastest-growing segment with a 27.56% CAGR through 2031.
Why is hybrid deployment growing faster than on-premise or pure cloud in some cases?
Hybrid deployment is expected to grow at 27.34% CAGR because regulated sectors need carbon telemetry across private infrastructure and public cloud at the same time.
Why are SMEs becoming more important buyers?
SMEs are projected to grow at 28.12% CAGR because larger customers are passing software emissions expectations through supply chains, which pushes smaller vendors to adopt measurement and optimization tools.
How fragmented is vendor competition in this space?
Competition is moderately fragmented because no vendor dominates all solution areas. Buyers often combine specialists, open-source tools, and cloud-native platforms based on whether they need measurement, remediation, runtime optimization, or compliance support.
Page last updated on:


