GMO Labeled Food Market Size and Share
Market Overview
| Study Period | 2020 - 2030 |
|---|---|
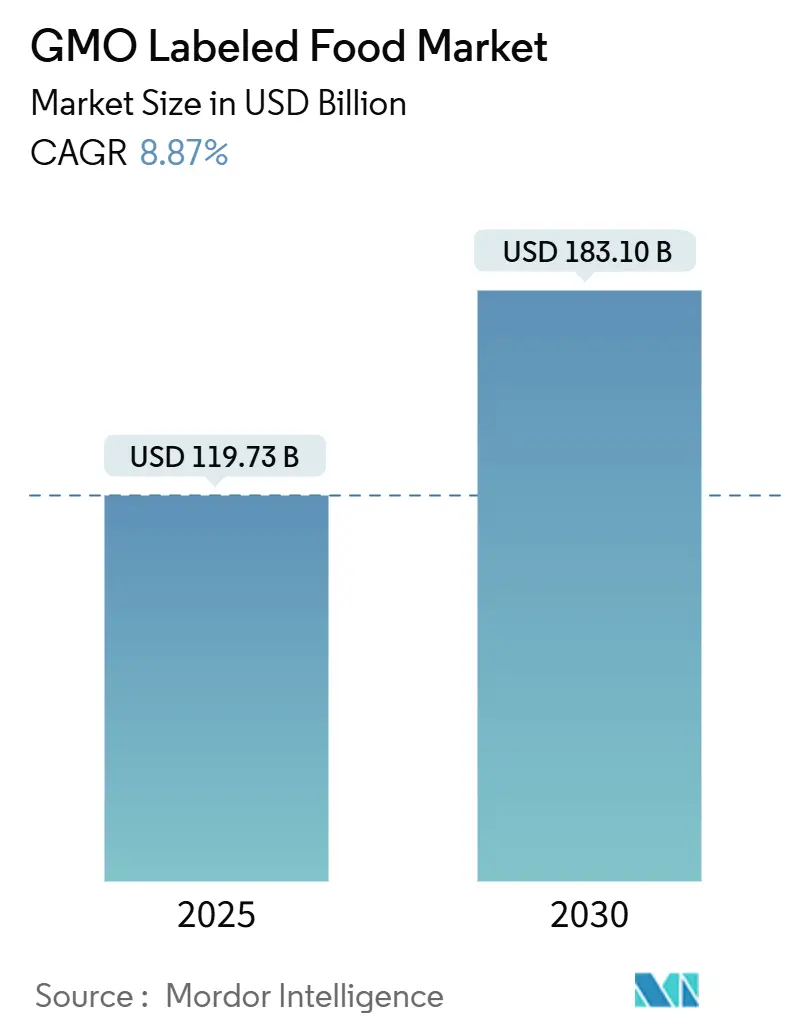
| Market Size (2025) | USD 119.73 Billion |
| Market Size (2030) | USD 183.10 Billion |
| Growth Rate (2025 - 2030) | 8.87% CAGR |
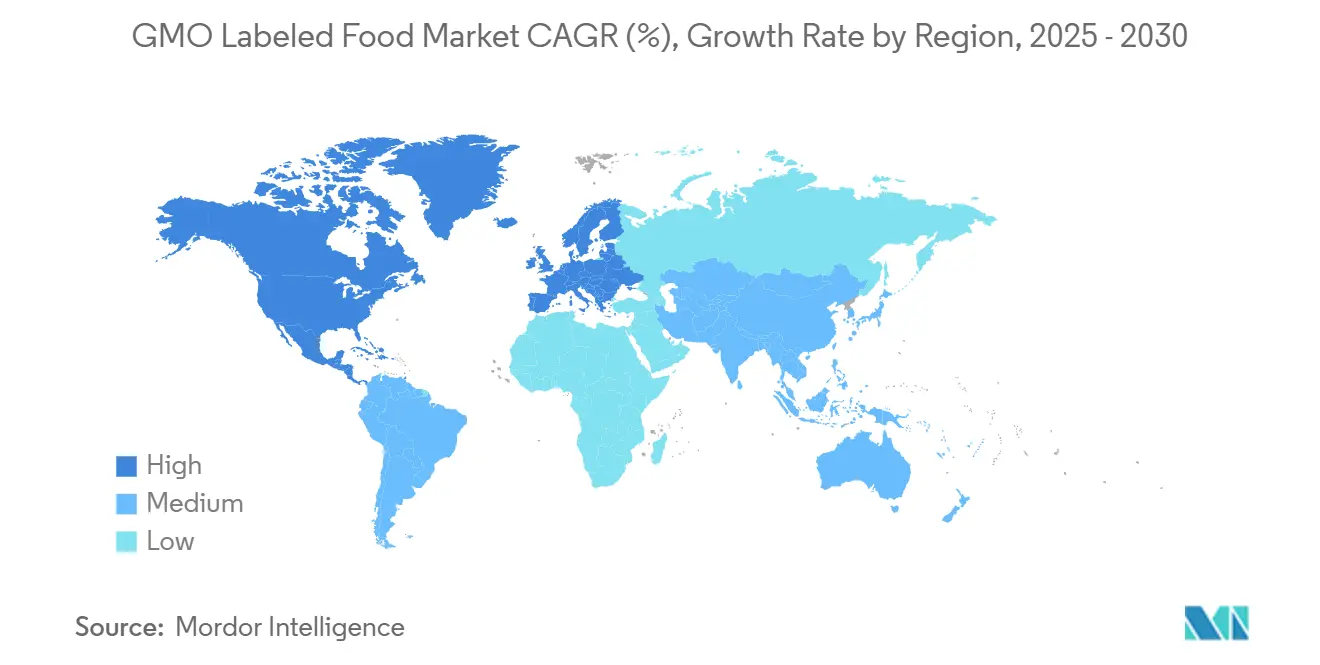
| Fastest Growing Market | Asia Pacific |
| Largest Market | North America |
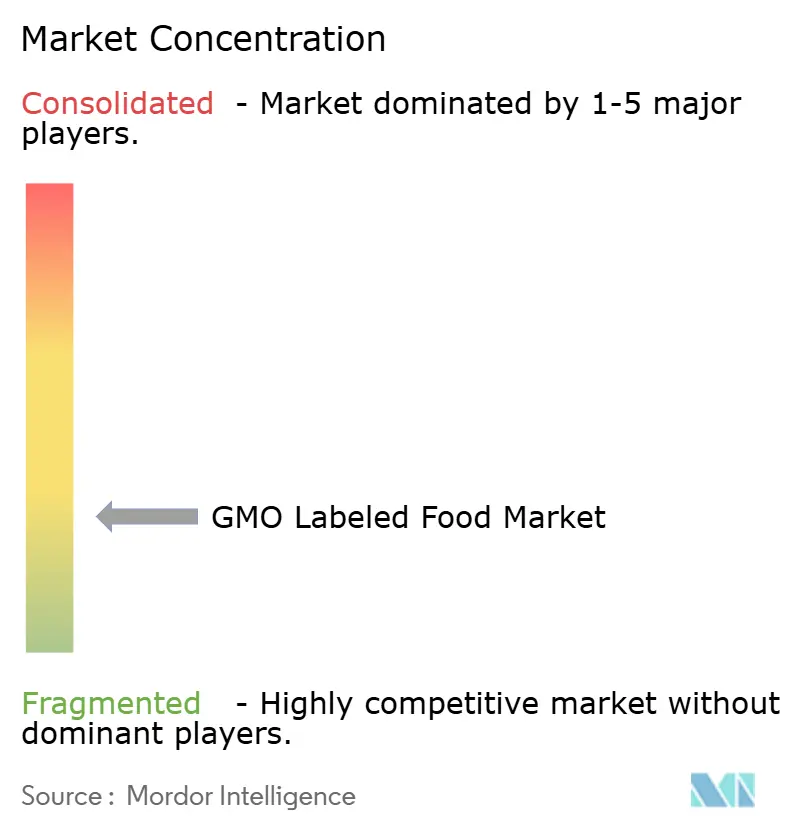
| Market Concentration | Low |
Major Players *Disclaimer: Major Players sorted in no particular order Image © Mordor Intelligence. Reuse requires attribution under CC BY 4.0. | |
GMO Labeled Food Market Analysis by Mordor Intelligence
The GMO labeled food market, valued at USD 119.73 billion in 2025, is projected to surge to USD 183.10 billion by 2030, marking a robust CAGR of 8.87%. In North America and Europe, intensified regulatory scrutiny has transformed what was once a voluntary disclosure into a mandatory compliance requirement. This shift has compelled food companies to differentiate their portfolios, balancing between GMO labeled and non-GMO SKUs, all while competing for coveted shelf space. Consumers, increasingly demanding traceability, are bolstered by QR-enabled packaging and third-party certifications. This trend not only fortifies price premiums for verified products but also broadens the market's reach. Yet, as manufacturers navigate diverse regulations across regions, the rising costs of reformulating recipes become evident. In response, many are forging strategic alliances with testing labs and certification entities to simplify global compliance. Meanwhile, the competitive landscape is heating up. Retailers are vigorously championing their private-label non-GMO offerings, curtailing shelf space for traditional bioengineered brands, and nudging established players towards accelerated innovation cycles.
Key Report Takeaways
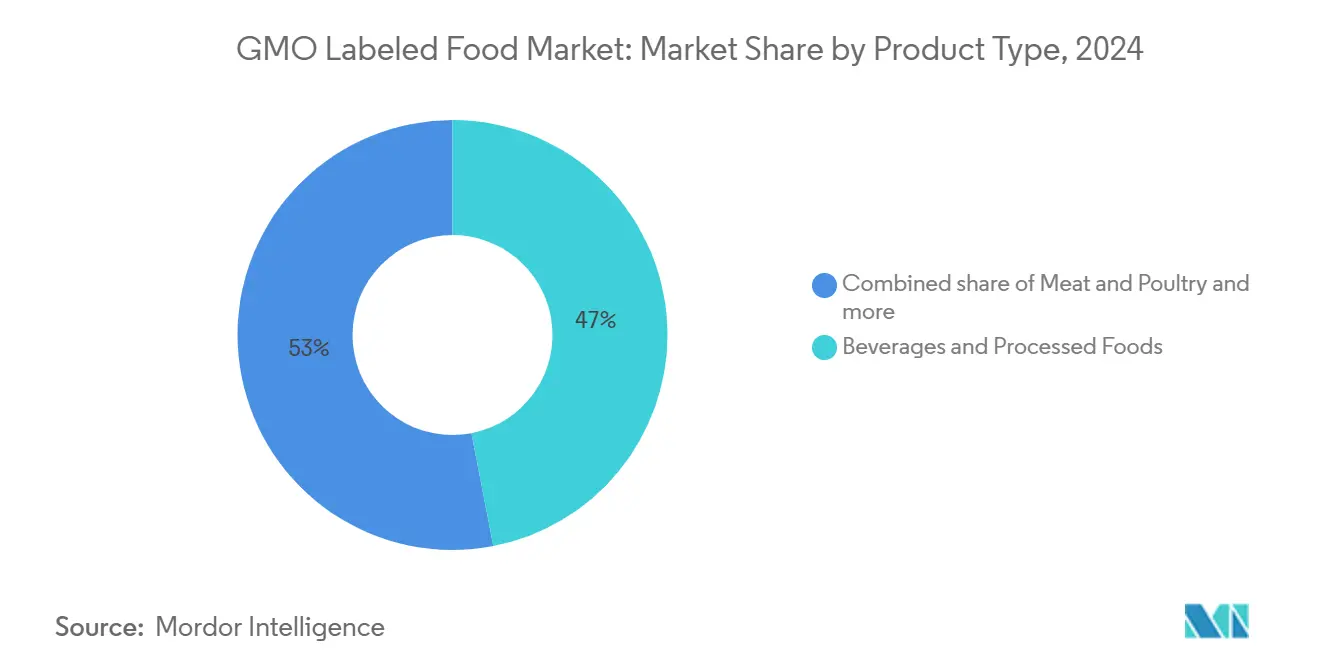
- By product type, Beverages and Processed Foods led with 46.96% of the GMO labeled food market share in 2024, while the Meat and Poultry segment is advancing at a 10.80% CAGR through 2030.
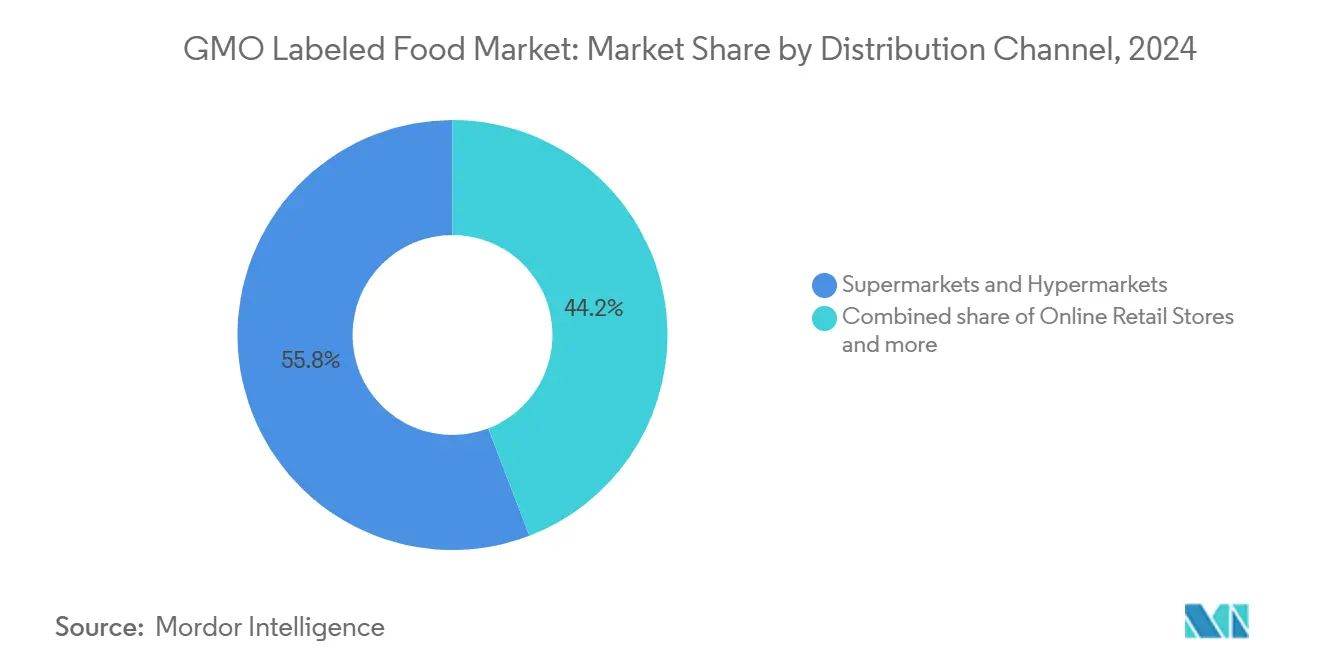
- By distribution channel, Supermarkets and Hypermarkets controlled 55.82% of 2024 revenues, whereas Online Retail Stores are projected to grow at an 11.78% CAGR to 2030.
- By geography, North America accounted for 35.43% of 2024 sales, while Asia-Pacific is poised to expand at an 11.56% CAGR.
Global GMO Labeled Food Market Trends and Insights
Drivers Impact Analysis*
| Driver | (~) % Impact on CAGR Forecast | Geographic Relevance | Impact Timeline |
|---|---|---|---|
| Product and ingredient innovation | +1.2% | Global, with leadership in North America and Europe | Medium term (2-4 years) |
| Flavor fusion and adventurous palates | +0.8% | Global, concentrated in urban Asia-Pacific and North America | Short term (≤ 2 years) |
| Sustainable and eco-friendly packaging | +1.0% | Europe and North America, expanding to the Asia-Pacific | Medium term (2-4 years) |
| Targeted marketing and branding | +0.9% | Global, strongest in North America | Short term (≤ 2 years) |
| Labelling mandates in North America and Europe drive SKU growth | +2.1% | North America and Europe | Long term (≥ 4 years) |
| Private-label non-GMO conversions reduce shelf space for GMO SKUs | +0.7% | North America and Europe, and emerging in the Asia-Pacific | Medium term (2-4 years) |
| Source: Mordor Intelligence | |||
Product and ingredient innovation
Food manufacturers are increasingly using precision fermentation and gene-editing technologies to create novel ingredients, blurring the lines between GMO and non-GMO classifications. This trend is leading to regulatory ambiguities and challenges in labeling. Nestlé's N3 milk, which hit the market in November 2023, utilizes enzyme-based sugar reduction to achieve sweetness without the addition of sugars. Meanwhile, Shiru's OleoPro, through computational protein design, has managed to reduce saturated fat in plant-based oils by up to 90%. According to the FONA International Flavor Forecast 2024, a trend dubbed "Thoughtfully Borrowed" is emerging. This trend sees regional ingredients, like tamarind and coconut vinegar, making their way into mainstream processed foods. While this broadens the flavor spectrum, it also raises the need for transparent sourcing disclosures. Such disclosures become particularly crucial when bioengineered corn or soy derivatives are used as carriers or stabilizers. In 2024, Kraft Heinz unveiled its proprietary 360CRISP platform, backed by a 15% year-over-year boost in research and development spending. This move underscores the industry's push for innovation, especially in the "Substantial Snacking" and "Easy Ready Meals" segments. Here, a clean-ingredient stance often aligns with non-GMO claims, catering to health-conscious consumers. Spring 2025 will see the Non-GMO Project pilot its "Non-UPF verified" certification. This initiative highlights the growing scrutiny on ultra-processed foods and their GMO-free positioning. As brands chase this dual verification, it could redefine product development, especially for those targeting consumers who value both minimal processing and ingredient purity.
Flavor fusion and adventurous palates
Global and fusion flavors are increasingly in demand, leading to product launches that feature exotic ingredients. Many of these ingredients come from regions with lenient GMO regulations, complicating sourcing and labeling. The FONA Flavor Forecast 2024 highlights "Sour Power" and "Indulgence Redefined" as key trends. Ingredients like tamarind, hibiscus, and fermented elements are becoming popular in beverages and snacks. Historically, these categories have depended on bioengineered corn sweeteners and soy-based emulsifiers. An analysis by Agriculture Canada on online product launches revealed that "GMO-free" was a leading claim in 2023. There were 443 launches touting this claim, a drop from 1,086 in 2020. This decline indicates that as "GMO-free" status becomes standard in some categories, brands are shifting their focus to flavor innovation for differentiation. They now view the non-GMO label more as a baseline requirement than a unique selling point. In September 2024, Tyson Foods debuted "Green Street," a line of plant-based ready-to-eat bowls, and "YAPPAH," a snack brand emphasizing food waste. These moves underscore how traditional meat companies are venturing into the plant-based realm. Here, the narratives of flavor innovation and sustainability intertwine with the complexities of GMO labeling, especially since many plant-based proteins derive from soy and pea crops, which have varying levels of GMO prevalence.
Sustainable and eco-friendly packaging
Brands are reshaping their packaging strategies, merging sustainability mandates with GMO labeling. They're increasingly using on-pack claims and digital traceability tools to highlight their environmental credentials and ensure ingredient transparency. In a notable move, Mondi partnered with Traceless in June 2024 to craft bio-circular coatings from agricultural by-products. This initiative boasts a 76% reduction in greenhouse gas emissions compared to traditional virgin PET. Such strides in sustainable packaging not only stand out but also resonate with non-GMO claims, appealing to a growing base of environmentally conscious consumers. The European Union is tightening the reins on labeling. Starting January 1, 2025, processed fruits, vegetables, nuts, and dried fruits will need mandatory origin labels. And from June 2026, honey will face stricter country-of-origin rules. These moves underscore a regulatory push for supply-chain transparency, echoing GMO disclosure mandates. However, they also heighten compliance costs for manufacturers navigating diverse jurisdictions. On March 12, 2024, the UK's Defra unveiled a consultation on food labeling. Their proposal? A five-tier welfare system for pork, chicken, and egg production methods, complete with government-backed assurance registers. This governance framework, while focused on food, hints at potential extensions to GMO labeling, spotlighting the rising trend of input-based labeling across various food categories.
Targeted marketing and branding
Food brands are increasingly turning to celebrity partnerships, co-branding, and digital storytelling to set their GMO labeled products apart in saturated markets. These brands are channeling their marketing investments towards narratives of transparency and technologies that ensure traceability. A case in point is Conagra's June 2025 debut of a frozen meal line featuring Dolly Parton. This move underscores the power of celebrity endorsements in boosting both private-label and branded frozen foods. This category is particularly sensitive to GMO labeling, given the common use of bioengineered corn, soy, and canola in sauces, coatings, and fillings. Meanwhile, Natural Grocers expanded its private-label line in April 2025 with Non-GMO Peruvian Chips. This move, bolstered by the retailer's commitment to over 65% non-GMO products in its assortment and a 100% non-GMO bulk offering, highlights how regional specialty retailers are leveraging a non-GMO private-label strategy to carve out a niche against national brands. On the certification front, SCS Global Services and FoodChain ID are tapping into the rising consumer demand for transparency. They offer services like Non-GMO Project Verification, blockchain traceability, and QR-linked farm-to-fork storytelling. Notably, FoodChain ID's December 2023 acquisition of Organic Certifiers has broadened its certification capabilities, allowing it to provide bundled organic and non-GMO verification services.
Restraints Impact Analysis*
| Restraint | % Impact on CAGR Forecast | Geographic Relevance | Impact Timeline |
|---|---|---|---|
| Availability of healthy alternatives | -1.1% | Global, concentrated in developed markets | Short term (≤ 2 years) |
| Regulatory hurdles and labeling requirements | -0.9% | Global, most acute in Europe and the Asia-Pacific | Long term (≥ 4 years) |
| Supply chain volatility and raw material costs | -1.3% | Global, with acute pressure in emerging markets | Medium term (2-4 years) |
| Manufacturing complexity and high initial investment | -0.8% | Global, barrier to entry for small and mid-sized processors | Long term (≥ 4 years) |
| Source: Mordor Intelligence | |||
Availability of healthy alternatives
As organic, plant-based, and minimally processed foods gain traction, non-GMO is evolving from a premium differentiator to a baseline attribute. This shift is compressing price premiums and curtailing growth for GMO labeled products that lack added health or sustainability credentials. Recognizing this trend, The Non-GMO Project is piloting a "Non-UPF verified" certification in spring 2025. Their move underscores that merely being non-GMO doesn't resonate with consumers keen on avoiding ultra-processed foods. As clean-label and whole-food trends rise, dual verification becomes essential for relevance. A 2024 study by Bayer and Kühl on German consumers unveiled that 92.6% understand that better organic animal-farming practices come at a price. However, it highlighted a "citizen-consumer gap": while high-frequency organic buyers are more amenable to price hikes, medium and low-frequency buyers are not, especially when price sensitivity is a factor. The research also pointed out varied consumer reactions to a complete antibiotic ban in organic farming. While 13% viewed it as a top trust-building measure, 28% placed it at the bottom. This suggests that stringent production standards might inadvertently raise concerns about animal health and welfare. Such dynamics could also influence perceptions around GMO-free positioning, especially if consumers sense trade-offs in yield, cost, or nutritional value.
Regulatory hurdles and labeling requirements
Divergent GMO labeling regimes across jurisdictions create compliance complexities and trade frictions, raising costs for multinational food manufacturers and limiting the scalability of standardized product formulations. A December 2024 finding revealed that Mexico's bioengineered corn decree conflicts with the United States-Mexico-Canada Agreement. This underscores how national GMO policies can clash with regional trade commitments, introducing uncertainty for cross-border supply chains and potentially restricting market access for bioengineered products[1]Source: USDA Economic Research Service, “Grain Market Outlook,” ers.usda.gov. The European Union has proposed new genomic techniques. These would exempt certain gene-edited crops from GMO labeling if their traits could have arisen naturally or through conventional breeding. This proposal has sparked regulatory uncertainty, with stakeholders debating between maintaining strict traceability and adopting a tiered approach that differentiates transgenic GMOs from precision-edited varieties. In the Asia-Pacific, countries are taking varied stances: Japan has commercialized GABA-enriched tomatoes and waxy maize without GMO labeling; India exempted SDN1 and SDN2 gene-editing techniques from biosafety assessments in 2022; the Philippines granted certificates of non-coverage for gene-edited products under its 2022 MC8 guidelines; and Thailand set up a certification framework in 2024. This creates a patchwork regulatory landscape, complicating regional product launches and labeling strategies.
*Our forecasts treat driver/restraint impacts as directional, not additive. The impact forecasts reflect baseline growth, mix effects, and variable interactions.
Segment Analysis
By Product Type: Meat and Poultry Outpace Beverages Despite Smaller Base
In 2024, Beverages and Processed Foods lead the GMO labeled food market with a 46.96% share, driven by the extensive use of bioengineered corn sweeteners, soy lecithin, and canola oil in products like soft drinks, energy beverages, snack bars, cereals, and ready-to-eat meals. This segment benefits from a high SKU count and the ease of incorporating bioengineered ingredients into liquid and semi-solid products, where functionality outweighs ingredient origin. The Meat and Poultry segment is projected to grow at a 10.80% CAGR from 2025 to 2030, spurred by USDA's August 2024 guidelines requiring stricter certification for claims like "Raised Without Antibiotics" and "Fed Non-GMO Feed"[2]Source: USDA FSIS, “Labeling Guideline on Documentation,” fsis.usda.gov . Tyson Foods' September 2024 launch of "Green Street" plant-based bowls and "YAPPAH" food-waste snacks highlights its shift toward plant-based and alternative-protein markets, aligning GMO labeling with sustainability trends.
Fruits and Vegetables, Dairy and Eggs, and Cereals and Grains account for the remaining market share, each shaped by unique GMO labeling factors. Fruits and Vegetables have limited GMO prevalence due to the small number of approved bioengineered crops like papaya, summer squash, and Arctic apples, resulting in lower labeling and awareness. Dairy and Eggs increasingly feature "Fed Non-GMO Feed" claims as retailers like Whole Foods enforce stricter sourcing standards, driving demand for segregated corn and soybean meal supplies. Cereals and Grains frequently display GMO labels due to the widespread use of bioengineered corn, soy, and canola in products like cereals and baked goods, with brands like Kellogg's and General Mills balancing reformulation costs against consumer demand for non-GMO options. The Non-GMO Project's spring 2025 "Non-UPF verified" certification pilot is expected to drive dual verification efforts, appealing to consumers prioritizing minimal processing and ingredient purity.


By Distribution Channel: Online Retail Gains as Transparency Tools Proliferate
In 2024, Supermarkets and Hypermarkets dominate the GMO labeled food market, holding a 55.82% share. They leverage extensive shelf space, promotional strategies, and private-label products to serve mainstream consumers. This dominance highlights the importance of physical retail, where impulse buying, sensory evaluation, and immediate availability drive sales. Meanwhile, Online Retail Stores are growing rapidly, with an 11.78% CAGR from 2025 to 2030, the fastest among distribution channels. Digital platforms enhance transparency through detailed ingredient disclosures, QR-linked traceability, and consumer reviews. Agriculture Canada reported 443 "GMO-free" product launches in 2023, showing how e-commerce helps niche brands reach health-conscious consumers without competing for physical shelf space.
Convenience Stores, Specialty Stores, and Other Distribution Channels cater to distinct consumer segments with varying GMO labeling priorities. Convenience Stores focus on quick purchases, emphasizing price, convenience, and brand familiarity over GMO labeling. This results in fewer non-GMO verified products and more conventional GMO labeled snacks, beverages, and ready-to-eat meals. Specialty Stores, including Whole Foods, Sprouts, and Natural Grocers, treat non-GMO as a standard. Natural Grocers offers over 65% non-GMO products and 100% non-GMO bulk items, limiting shelf space for conventional GMO labeled brands. Other Distribution Channels, such as foodservice, direct-to-consumer, and institutional sales, show varied GMO labeling practices shaped by customer expectations, regulations, and operational challenges. The European Citizens' Initiative "Stop Fake Food: Origin on Label" seeks to expand origin labeling to out-of-home catering and align non-EU producers with EU standards, potentially increasing GMO disclosure requirements beyond retail.
Geography Analysis
In 2024, North America holds a 35.43% share of the GMO labeled food market, driven by the full enforcement of the National Bioengineered Food Disclosure Standard and the Non-GMO Project's verification efforts, which cover over 50,000 products from more than 3,000 brands, generating approximately USD 26 billion annually. The region's leadership stems from its early adoption of mandatory disclosure, a well-established certification infrastructure, and consumer familiarity with GMO labeling, which has normalized transparency expectations across retail channels. The USDA's updated August 2024 guidelines for meat and poultry labeling now require third-party certification or routine testing to substantiate claims like "Raised Without Antibiotics" and "Fed Non-GMO Feed," increasing verification demand and compliance costs for producers. Additionally, a December 2024 finding that Mexico's bioengineered corn decree violates the United States-Mexico-Canada Agreement introduces trade frictions, potentially reshaping cross-border commodity flows and labeling practices. Europe also holds a significant market share, supported by the EU's stringent GMO labeling regulations and the expansion of mandatory origin labeling for processed fruit, vegetable products, nuts, and dried fruits starting January 1, 2025. Stricter country-of-origin rules for honey, effective June 2026, further reflect the EU's broader regulatory push for supply-chain transparency, aligning with GMO disclosure requirements[3]Source: European Parliament, “Origin Labelling in the EU,” europarl.europa.eu .
Asia-Pacific is the fastest-growing region, with a projected CAGR of 11.56% from 2025 to 2030. This growth is fueled by regulatory advancements in Japan, India, the Philippines, and Thailand, which are clarifying gene-editing exemptions and introducing certification frameworks for genome-edited crops. These measures expand the market for labeled products as governments differentiate between transgenic GMOs and precision-edited varieties. Japan has commercialized GABA-enriched tomatoes and waxy maize without GMO labeling, while India exempted SDN1 and SDN2 gene-editing techniques from biosafety assessments in 2022. The Philippines issued certificates of non-coverage for gene-edited products under its 2022 MC8 guidelines, and Thailand established a certification framework in 2024. This evolving regulatory landscape fosters product innovation while maintaining consumer choice through voluntary labeling.
South America, the Middle East, and Africa exhibit lower penetration of GMO labeling due to limited regulatory enforcement, lower consumer awareness, and the dominance of bioengineered commodity crops like soybeans and corn in agricultural exports. However, these regions are witnessing emerging growth in organic and non-GMO segments as urbanization, rising incomes, and exposure to global food trends drive demand for transparency and premium product positioning. While regulatory frameworks in these regions remain underdeveloped, the growing interest in organic and non-GMO products signals a shift toward greater transparency and consumer preference for high-quality food options.

Competitive Landscape
Multinational food giants like Nestlé, Danone, Unilever, and Kraft Heinz compete in the moderately fragmented GMO-labeled food market. Large players leverage their scale advantages in procurement, production optimization, and regulatory compliance. For instance, Mars' USD 35.9 billion acquisition of Kellanova, announced on August 15, 2024, will create a combined entity with over USD 63 billion in pro forma annual revenue and projected annual cost synergies of USD 1.5 billion through procurement efficiencies and redundancy elimination. Kraft Heinz, during its February 2024 CAGNY presentation, highlighted a 15% year-over-year increase in research and development spending and set a USD 2 billion incremental net innovation target for 2023-2027. Proprietary platforms like 360CRISP are enabling differentiation in the "Substantial Snacking" and "Easy Ready Meals" categories, where clean-ingredient positioning often aligns with non-GMO claims. Smaller brands are also making their mark by focusing on non-GMO certification, organic positioning, and direct-to-consumer channels. Natural Grocers, for example, operates approximately 800 private-label SKUs, with over 65% of its assortment being non-GMO, effectively competing against national brands.
Opportunities are emerging at the convergence of non-GMO preferences and the avoidance of ultra-processed foods. This trend is exemplified by the Non-GMO Project's spring 2025 pilot of the "Non-UPF verified" certification, which acknowledges that non-GMO alone is insufficient for consumers prioritizing clean-label and whole-food attributes. Certification providers are expanding their service offerings through consolidation. A key example is FoodChain ID's December 2023 acquisition of Organic Certifiers, which now enables bundled organic and non-GMO verification services alongside blockchain traceability solutions. These services appeal to brands seeking end-to-end supply chain transparency, addressing the growing consumer demand for accountability and authenticity in food labeling.
Disruptive innovations are also reshaping the market. Startups specializing in precision fermentation and gene-editing are developing novel ingredients positioned as non-GMO alternatives to conventional bioengineered inputs. These advancements have the potential to transform ingredient supply chains and labeling classifications as regulatory frameworks evolve to distinguish between transgenic GMOs and precision-edited varieties. Such innovations could redefine the competitive landscape, offering new opportunities for brands to align with evolving consumer preferences and regulatory standards.
GMO Labeled Food Industry Leaders
Nestlé S.A.
The Kraft Heinz Company
PepsiCo Inc.
Unilever PLC
General Mills Inc.
- *Disclaimer: Major Players sorted in no particular order

Recent Industry Developments
- May 2025: Conagra Brands launched the Dolly Parton frozen meal line, leveraging celebrity endorsement and co-branding to differentiate in the competitive frozen meals category, where GMO labeling is prevalent due to the use of bioengineered corn, soy, and canola ingredients in sauces and coatings.
- April 2025: Natural Grocers expanded its private-label line with the introduction of Non-GMO Peruvian Chips, reinforcing the retailer's commitment to maintaining a product assortment of more than 65% non-GMO products and 100 percent non-GMO bulk offerings as a core brand differentiator.
- August 2024: Mars, Incorporated acquired Kellanova for USD 35.9 billion in an all-cash transaction valued at USD 83.50 per share, representing a 44% premium to Kellanova's 30-day volume-weighted average price, with the combined entity expected to generate over USD 63 billion in pro forma annual revenue and USD 1.5 billion in annual cost synergies from procurement and production optimization.
- August 2024: Conagra Brands acquired Sweetwood Smoke & Co., the maker of Fatty brand meat sticks, expanding its portfolio of protein snacks and positioning the company to capitalize on consumer demand for convenient, high-protein options where GMO labeling and clean-ingredient claims are increasingly important.


Global GMO Labeled Food Market Report Scope
| Fruits and Vegetables |
| Dairy and Eggs |
| Cereals and Grains |
| Meat and Poultry |
| Beverages and Processed Foods |
| Supermarkets and Hypermarkets |
| Convenience Stores |
| Specialty Stores |
| Online Retail Stores |
| Other Distribution Channels |
| North America |
| South America |
| Europe |
| Asia-Pacific |
| Middle East and Africa |
| Product Type | Fruits and Vegetables |
| Dairy and Eggs | |
| Cereals and Grains | |
| Meat and Poultry | |
| Beverages and Processed Foods | |
| Distribution Channel | Supermarkets and Hypermarkets |
| Convenience Stores | |
| Specialty Stores | |
| Online Retail Stores | |
| Other Distribution Channels | |
| Geography | North America |
| South America | |
| Europe | |
| Asia-Pacific | |
| Middle East and Africa |


Key Questions Answered in the Report
What is the current value of the GMO labeled food market?
The market is valued at USD 119.73 billion in 2025 and is projected to reach USD 183.10 billion by 2030.
Which product category leads sales?
Beverages and Processed Foods held 46.96% of 2024 sales, driven by the widespread use of bioengineered corn sweeteners and soy emulsifiers.
Which segment is growing fastest?
Meat and Poultry is forecast to expand at a 10.80% CAGR through 2030, thanks to stricter “Fed Non-GMO Feed” verification rules.
How big is online’s role in GMO labeled food sales?
Online Retail Stores are expected to grow at a 11.78% CAGR to 2030, benefiting from digital traceability tools that enhance transparency.
Which region shows the highest growth potential?
Asia-Pacific is poised for an 11.56% CAGR as governments clarify gene-editing exemptions and introduce unified certification systems.
Page last updated on:


