Switchgear Market Size and Share
Market Overview
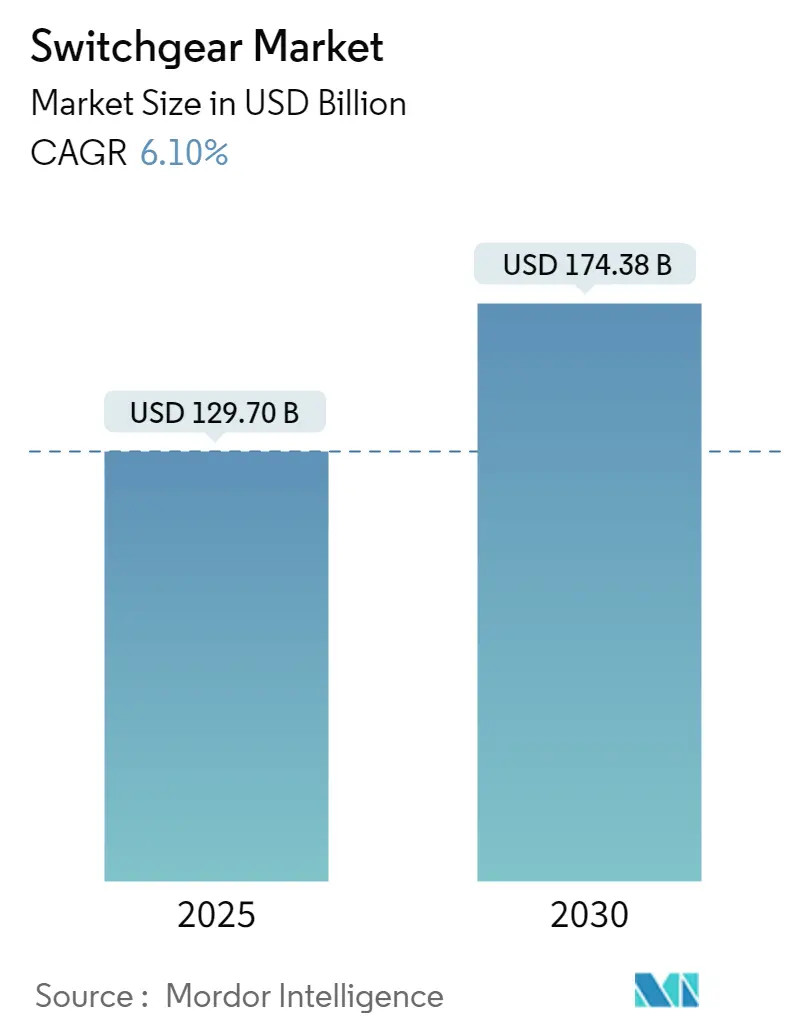
| Study Period | 2019 - 2030 |
| Market Size (2025) | USD 129.70 Billion |
| Market Size (2030) | USD 174.38 Billion |
| Growth Rate (2025 - 2030) | 6.10% CAGR |
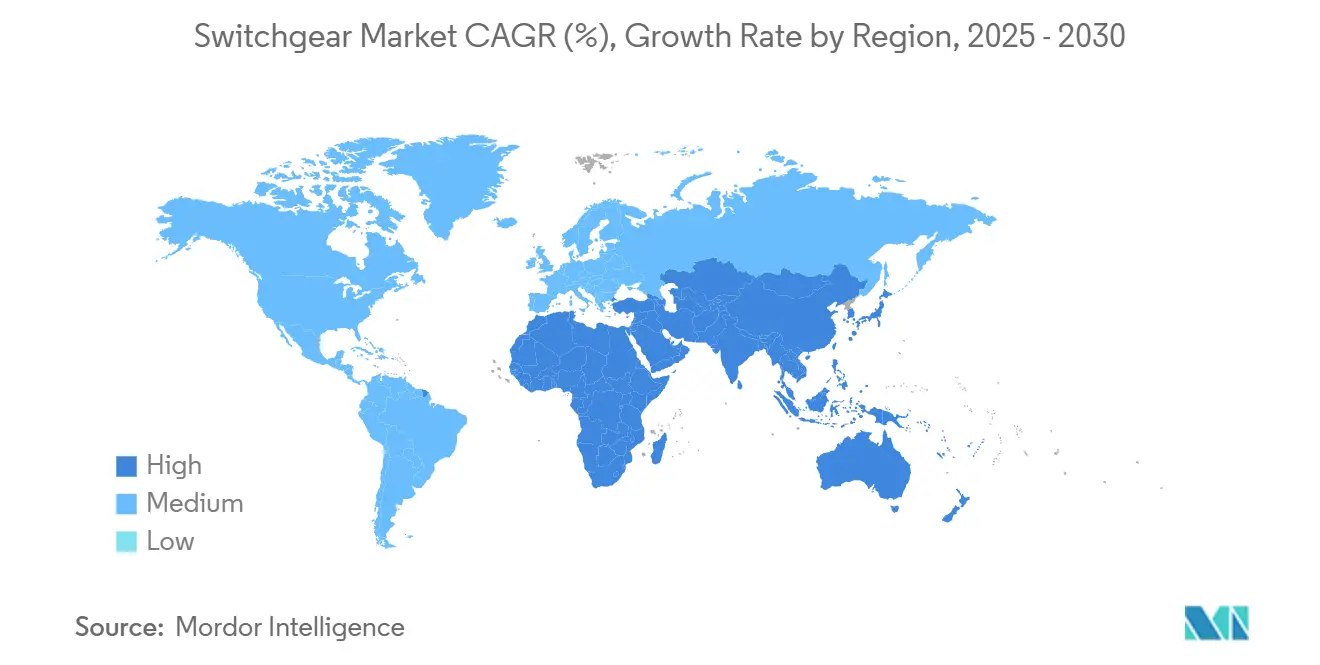
| Fastest Growing Market | Middle East and Africa |
| Largest Market | Asia Pacific |
| Market Concentration | Medium |
Major Players*Disclaimer: Major Players sorted in no particular order Image © Mordor Intelligence. Reuse requires attribution under CC BY 4.0. |
|

Switchgear Market Analysis by Mordor Intelligence
The global switchgear market stood at USD 129.7 billion in 2025 and is forecast to reach USD 174.38 billion by 2030, advancing at a 6.10% CAGR. Intensifying electrification programs, record-high renewable build-outs, and a surge in data-center power density keep procurement volumes on an upward trajectory even in an inflationary environment. [1]U.S. Department of Energy, “IIJA-Grid Resilience and Innovation Partnerships,” energy.gov Mandatory SF₆ phase-outs in the European Union, multi-billion-dollar grid-resilience grants in the United States, and India’s Revamped Distribution Sector Scheme collectively accelerate equipment replacement cycles. [2]European Commission, “Briefing Paper: SF₆ and Alternatives in Electrical Switchgear,” climate.ec.europa.eu Supply constraints have pushed medium-voltage delivery lead times toward 48 weeks, yet utilities and hyperscale operators continue to prioritize orders as switchgear remains non-deferrable critical infrastructure. Established manufacturers with ready SF₆-free portfolios and domestic production footprints are capturing price premiums, widening the competitive gap against late movers.
Key Report Takeaways
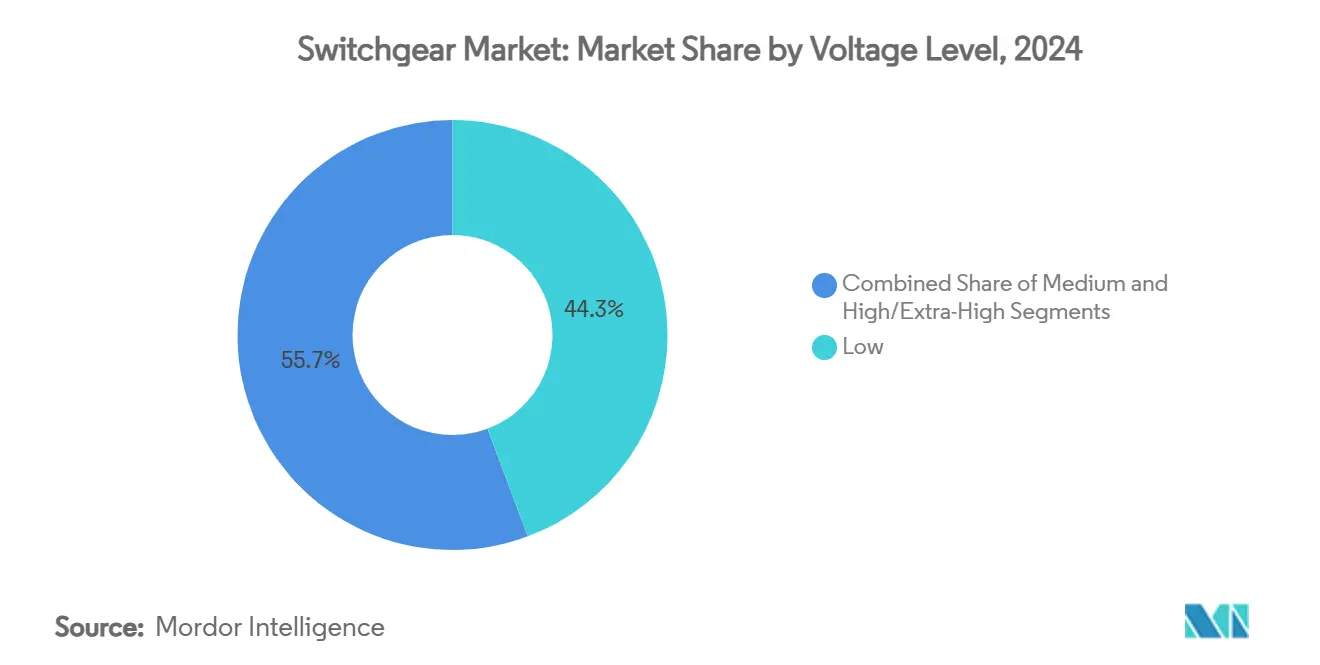
- By voltage level, low-voltage systems held 44.3% of the switchgear market share in 2024, while medium-voltage equipment is projected to expand at a 10.5% CAGR through 2030.
- By installation, indoor configurations captured 60% of the switchgear market share in 2024; outdoor systems are advancing at a 6.2% CAGR.
- By current type, AC equipment dominated with 85% share in 2024, whereas DC switchgear is growing at 6.1% CAGR to 2030.
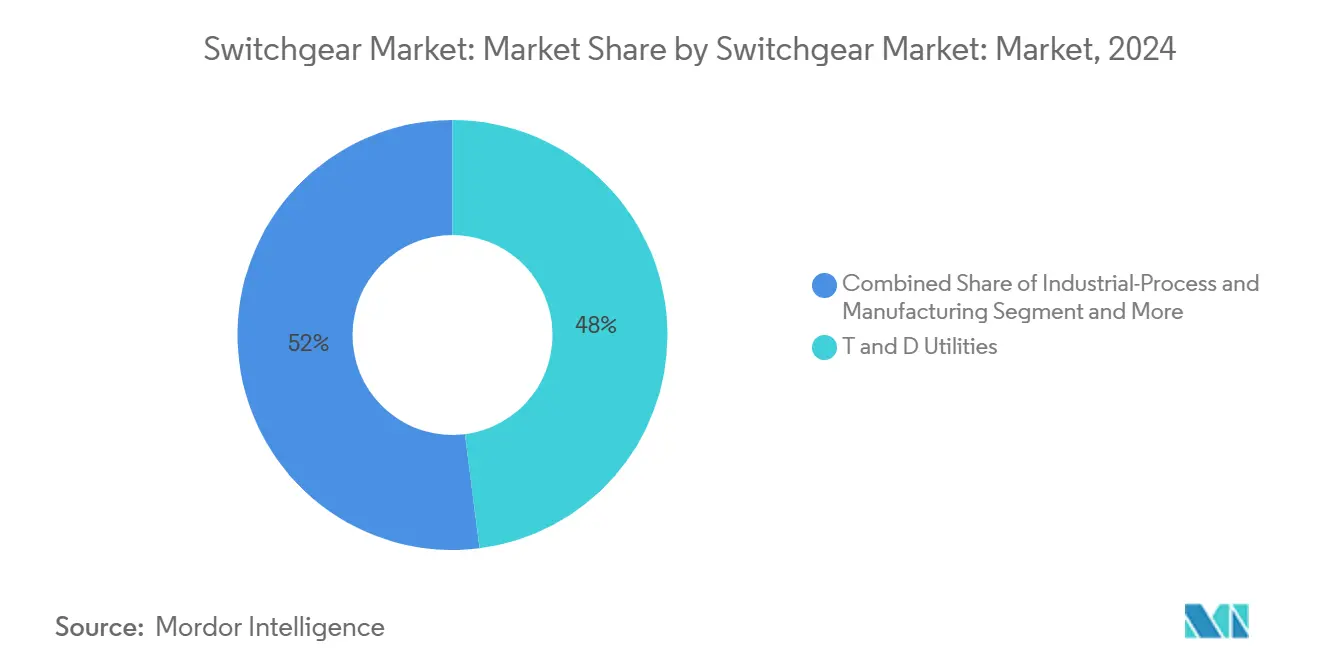
- By end-user, TandD utilities led with 48% share of the switchgear market size in 2024; data centers represent the fastest-growing user segment at 9.2% CAGR.
- By geography, Asia-Pacific accounted for 45% of 2024 revenue, and the Middle East and Africa region is forecast to grow at 6.3% CAGR to 2030.
Global Switchgear Market Trends and Insights
Drivers Impact Analysis
| Driver | (~) % Impact on CAGR Forecast | Geographic Relevance | Impact Timeline |
|---|---|---|---|
| Expansion of Data-Center MV Indoor Switchgear Demand in NA and EU | +1.80% | North America and EU | Medium term (2-4 years) |
| EU F-Gas-Phase-Out Accelerating SF₆-Free GIS Procurement | +1.20% | Europe, spill-over global | Short term (≤ 2 years) |
| India RDSS USD 40 Bn Outlay for Distribution Switchgear 2021–28 | +0.90% | India, South Asia | Long term (≥ 4 years) |
| Offshore-Wind 66 kV Array-Cable GIS Uptake in East Asia | +0.70% | East Asia, APAC | Medium term (2-4 years) |
| US IIJA Grants for Pad-Mounted Grid Modernization | +0.60% | United States | Medium term (2-4 years) |
| GCC Rail Electrification Boosting High-Speed DC Switchgear | +0.40% | GCC countries | Long term (≥ 4 years) |
Source: Mordor Intelligence
Expansion of Data-Center MV Indoor Switchgear Demand in NA and EU
Hyperscale operators are scaling single-site loads from 10-20 MW toward 100 MW, prompting 16% annual growth in medium-voltage indoor switchgear orders through 2030. [3]Schneider Electric, “Schneider Electric set to invest more than $700mn in US energy sector,” ft.com Indoor gas-insulated designs cut required floor space by up to three-quarters, a critical benefit in land-constrained metro campuses. Developers are paying 50% delivery premiums to secure firm slots in congested production lines. Manufacturers with U.S. or European assembly plants have seized the advantage as import lead times stretch past 40 weeks. The focus on guaranteed logistics is redefining allocation strategies across the switchgear market.
EU F-Gas-Phase-Out Accelerating SF₆-Free GIS Procurement
Regulations end SF₆ use in medium-voltage equipment by 2026 and in high-voltage gear by 2030, compelling utilities to standardize on alternative gases. Early movers lock in supply of SF₆-free units 18–24 months ahead of deadlines, mitigating the risk of price surges. Hitachi Energy has already shipped 550 kV SF₆-free GIS, proving high-voltage readiness. [4]Hitachi, Ltd., “Hitachi Energy to deliver the world’s first SF₆-free 550 kV GIS,” hitachi.com Lifecycle savings from avoided gas handling and disposal offset higher up-front costs. The accelerated timetable is amplifying replacement demand inside the switchgear market.
India RDSS USD 40 Bn Outlay for Distribution Switchgear 2021–28
RDSS earmarks USD 8–12 billion for switchgear that integrates IEC 61850 communications and can withstand rural-feeder fault currents. “Make in India” preferences push foreign OEMs to localize assembly, evidenced by GE Vernova’s USD 16 million plant upgrades. Smart distribution objectives favor premium intelligent units, widening the price band versus legacy gear. The program establishes a predictable multi-year procurement pipeline, enabling volume scaling and stable factory utilization in the switchgear market.
Offshore-Wind 66 kV Array-Cable GIS Uptake in East Asia
Typhoon-prone sites require marine-rated 66 kV switchgear that tolerates 200 km/h wind loads and salt spray, driving unit values above USD 2 million. Local content mandates in Taiwan and China encourage joint-ventures such as MHI Vestas-Shihlin Electric for domestic assembly. Annual installations of 400–500 units are expected as China targets 15–20 GW of offshore wind through 2030. Proven offshore experience gives established OEMs an edge, reinforcing their share within the switchgear market.
Restraints Impact Analysis
| Restraint | (~) % Impact on CAGR Forecast | Geographic Relevance | Impact Timeline |
|---|---|---|---|
| SF₆-Free Interrupter Capacity Shortage (Lead-Times > 72 Weeks) | -1.40% | Global, acute NA and EU | Short term (≤ 2 years) |
| Copper and CRGO Price Volatility Pressuring LV OEM Margins | -0.80% | Global, severe APAC | Medium term (2-4 years) |
| Counterfeit LV Units from Informal Exporters in Africa | -0.30% | Africa, emerging markets | Long term (≥ 4 years) |
| Cyber-Security Compliance Costs for IEC 61850 Smart Gear | -0.20% | Global, developed markets | Medium term (2-4 years) |
Source: Mordor Intelligence
SF₆-Free Interrupter Capacity Shortage (Lead-Times > 72 Weeks)
Vacuum and clean-air interrupters require precision metallurgy that existing SF₆ lines cannot replicate, extending production lead times to 72 weeks in Europe and North America. Utilities facing 2026 compliance deadlines are stockpiling conventional gear to hedge transition risk. Hitachi Energy’s USD 155 million U.S. expansion will not be fully online for 18 months. The shortage creates a two-tier pricing environment where SF₆-free units command 30–40% premiums, squeezing capital budgets and slowing some modernization plans within the switchgear market.
Copper and CRGO Price Volatility Pressuring LV OEM Margins
Copper prices have swung 25–30% in annual ranges, while tariffs on imported steel and aluminum add 25% to landed costs in 2025. Copper represents up to 20% of low-voltage material inputs, yet fixed-price utility contracts limit pass-through. Indian OEMs, reliant on 50% copper imports, face dual exposure to currency swings and commodity spikes. Smaller manufacturers lack hedging tools, triggering 6-12 month margin compressions that could lead to consolidation inside the switchgear market.
Segment Analysis
By Voltage Level: Medium-Voltage Drives Growth Acceleration
Medium-voltage equipment is projected to outpace overall switchgear market growth with a 10.5% CAGR to 2030. Low-voltage assemblies still held the largest 44.3% share of the switchgear market size in 2024 owing to pervasive use in buildings and factories. Utilities are accelerating medium-voltage replacements to meet smart-grid mandates, and renewable interconnections require advanced protection schemes. Siemens’ EUR 100 million Frankfurt upgrade focuses on SF₆-free medium-voltage lines, demonstrating how regulation steers capital. Emerging applications in EV charging hubs and battery storage escalate demand, while high-voltage and extra-high-voltage remain niche but command premium pricing.
This voltage stratification illustrates how the switchgear industry is balancing ubiquitous low-voltage needs with fast-growing medium-voltage niches. Established OEMs leverage decades of field data to refine arc-flash mitigation and digital sensors that enhance condition monitoring. New entrants confront daunting certification hurdles, especially in medium-voltage ranges tied to utility safety standards. The up-cycle in replacement investments positions the switchgear market for sustained revenue expansion.
By Installation: Indoor Dominance Meets Outdoor Resilience
Indoor gear captured 60% of 2024 revenue and remains the default in space-constrained urban grids. Gas-insulated technology makes indoor adoption feasible by shrinking footprints by up to 75%. Outdoor assemblies, however, are forecast to grow at 6.2% CAGR as climate-change resilience becomes a priority and utilities harden exposed substations with pad-mounted solutions qualifying for IIJA funding.
In the switchgear market, installers weigh higher enclosure costs against reduced civil works when choosing indoor routes. Rural feeders increasingly favor outdoor or pole-mounted variants that eliminate building shells. Weatherproof ratings and modular skid designs allow rapid rollouts for renewable clusters. While cost-down pressures persist, lifecycle analyses show that sealed indoor GIS units cut maintenance visits, creating a total-cost-of-ownership advantage over 25 years.
By Current Type: AC Dominance Faces DC Disruption
AC configurations dominated 85% of shipments in 2024, a legacy of synchronous grid design. DC switchgear is projected to climb at 6.1% CAGR as offshore-wind HVDC links and energy-storage inverters proliferate. The switchgear market is seeing pilot programs testing medium-voltage DC rings for data-center campuses seeking higher efficiency. GCC rail electrification adds targeted demand for high-speed DC breakers, underlining the technology’s foothold in traction systems.
Designing DC switchgear requires derating clearances and rethinking extinguishing media, raising barriers for late-stage adopters. Hitachi Energy’s HVDC Light installations in the U.S. illustrate both the premium and the expertise demanded. AC incumbency will remain, yet DC advancements are reshaping product roadmaps and planting future revenue seeds for the switchgear market.
By End-User: Utilities Lead While Data Centers Accelerate
Utilities retained 48% spending share in 2024 as they finance grid replacements and resilience projects. Data centers, growing at 9.2% CAGR, have redefined procurement cycles, often bypassing integrators to purchase directly from OEMs for custom medium-voltage line-ups. Industrial plants contribute steady baseline demand, whereas transport and EV charging infrastructures present incremental volumes that diversify the switchgear market.
These end-user shifts influence feature roadmaps: utilities demand remote-monitoring integration, while hyperscalers prioritize footprint and heat-load constraints. OEMs now create product families tailored to each end-user archetype, locking in lifecycle services. Value propositions center on rapid delivery and modularity—attributes that command higher margins in the switchgear market.
Note: Segment shares of all individual segments available upon report purchase
By Application: Substation Equipment Anchors Renewable Growth
Substation primary equipment retains the largest revenue slice due to high unit values and engineering complexity. Renewable plant collection grids are the fastest-growing application as solar and wind farms multiply. Specialized offshore wind switchgear must resist salt mist and vibration, commanding price premiums justified by mission-critical reliability.
Motor control centers remain volume drivers in manufacturing but face commoditization. Emergency and paralleling systems gain traction as utilities and hospitals seek microgrid resilience. Advanced applications increasingly require IEC 61850-enabled automation, blending power engineering with cybersecurity expertise—a convergence shaping next-generation opportunities across the switchgear market.
Geography Analysis
Asia-Pacific held 45% of 2024 revenue, underpinned by China’s scale, India’s RDSS pipeline, and Japan’s high-specification niches. Local content rules and rapid renewable deployments sustain factory utilization and incentivize regional R&D hubs. Capacity expansions announced by global OEMs in China and India confirm the region’s centrality to the switchgear market.
The Middle East and Africa is forecast to expand at 6.3% CAGR to 2030. GCC megaprojects such as NEOM, along with nationwide electrification in Sub-Saharan Africa, demand ruggedized gear for hot, dusty climates. Import reliance presents opportunities for partnerships and assembly JV structures, as evidenced by Schneider Electric’s South African footprint.
North America and Europe are largely replacement markets but benefit from policy-driven tailwinds. The IIJA’s USD 10.5 billion GRIP awards and the EU’s SF₆ ban accelerate ordering cycles. Domestic production investments by Hitachi Energy, Eaton, and Mitsubishi Electric aim to close logistical gaps and maintain delivery promises. High regulatory standards and aging grid assets ensure stable demand streams within these mature yet technologically progressive regions of the switchgear market.
Competitive Landscape
Top Companies in Switchgear Market
Switchgear manufacturing remains moderately consolidated, with the top five players estimated to command roughly 60% of global revenue. Capital intensity, certification hurdles, and installed-base service contracts deter new entrants. Competitive differentiation now hinges on SF₆-free portfolios, digital diagnostics, and local factory presence that insulates customers from geopolitical shocks.
Strategic M&A activity is reshaping capabilities: ABB’s EUR 170 million (USD 200.24 million) purchase of Siemens Gamesa’s power-electronics unit expands control over renewable-focused converters. Siemens’ acquisition of Trayer Engineering deepens pad-mounted offerings aligned with U.S. grid-modernization funds. Market leaders have committed more than USD 6 billion in organic capacity expansions through 2027, signalling confidence in sustained switchgear market growth.
Supply-chain resilience is a new battleground. OEMs with vertically integrated interrupter production and regional steel sourcing can honor aggressive lead-time clauses, winning orders at premium prices. Lifecycle service contracts bundled with analytics platforms improve recurring revenue and customer lock-in. The convergence of electrical hardware and software further raises the entry bar for newcomers in the switchgear market.
Switchgear Industry Leaders
-
Schneider Electric
-
Mitsubishi Electric Corporation
-
Siemens AG
-
ABB Ltd
-
Havells India Limited.
- *Disclaimer: Major Players sorted in no particular order
Recent Industry Developments
- May 2025: Hitachi Energy delivered the world’s first SF₆-free 550 kV GIS to China’s State Grid Corporation.
- April 2025: Hitachi Energy boosted Pennsylvania investments to more than USD 70 million to expand EconiQ production.
- March 2025: Schneider Electric pledged over USD 700 million in U.S. manufacturing and R&D spend through 2027.
- March 2025: nVent Electric acquired Electrical Products Group for USD 975 million.
Global Switchgear Market Report Scope
Switchgear plays a pivotal role in safeguarding power systems. It regulates electrical circuits, manages power distribution, and facilitates testing and maintenance by de-energizing equipment. Key components of switchgear include circuit breakers, isolators, relays, switches, fuses, and control panels.
The switchgear market is segmented by type (voltage (low-voltage, medium-voltage, and high-voltage), insulation (gas-insulated switchgear (GIS), air-insulated switchgear (AIS), and other insulation types), and installation (indoor and outdoor)), end-user industry (commercial, residential, and industrial), and geography (North America, Europe, Asia-Pacific, Middle East and Africa, and Latin America). The market sizes and forecasts are provided in terms of value (USD) for all the above segments.
| By Voltage Level | Low (<1 kV) | ||
| Medium (1-40 kV) | |||
| High/Extra-High (>40 kV) | |||
| By Insulation | Gas-Insulated (SF₆) | ||
| Gas-Insulated (SF₆-free) | |||
| Oil-Insulated | |||
| Vacuum | |||
| Solid-Dielectric | |||
| By Installation | Indoor | ||
| Outdoor | |||
| Pad-Mounted | |||
| Pole-Mounted | |||
| By Current Type | AC Switchgear | ||
| DC Switchgear | |||
| By End-User | T&D Utilities | ||
| Industrial—Process and Manufacturing | |||
| Data Centers | |||
| Infrastructure and Transport (Rail, Airports, EV Charging) | |||
| Commercial and Residential Buildings | |||
| By Application | Substation Primary Equipment | ||
| Renewable Plant Collection Grids (Solar, Wind) | |||
| Motor Control and MCCs | |||
| Emergency and Paralleling Systems | |||
| By Geography | North America | United States | |
| Canada | |||
| Mexico | |||
| Europe | United Kingdom | ||
| Germany | |||
| France | |||
| Italy | |||
| Rest of Europe | |||
| Asia-Pacific | China | ||
| Japan | |||
| India | |||
| South Korea | |||
| Rest of Asia-Pacific | |||
| Middle East | Israel | ||
| Saudi Arabia | |||
| United Arab Emirates | |||
| Turkey | |||
| Rest of Middle East | |||
| Africa | South Africa | ||
| Egypt | |||
| Rest of Africa | |||
| South America | Brazil | ||
| Argentina | |||
| Rest of South America | |||
| Low (<1 kV) |
| Medium (1-40 kV) |
| High/Extra-High (>40 kV) |
| Gas-Insulated (SF₆) |
| Gas-Insulated (SF₆-free) |
| Oil-Insulated |
| Vacuum |
| Solid-Dielectric |
| Indoor |
| Outdoor |
| Pad-Mounted |
| Pole-Mounted |
| AC Switchgear |
| DC Switchgear |
| T&D Utilities |
| Industrial—Process and Manufacturing |
| Data Centers |
| Infrastructure and Transport (Rail, Airports, EV Charging) |
| Commercial and Residential Buildings |
| Substation Primary Equipment |
| Renewable Plant Collection Grids (Solar, Wind) |
| Motor Control and MCCs |
| Emergency and Paralleling Systems |
| North America | United States |
| Canada | |
| Mexico | |
| Europe | United Kingdom |
| Germany | |
| France | |
| Italy | |
| Rest of Europe | |
| Asia-Pacific | China |
| Japan | |
| India | |
| South Korea | |
| Rest of Asia-Pacific | |
| Middle East | Israel |
| Saudi Arabia | |
| United Arab Emirates | |
| Turkey | |
| Rest of Middle East | |
| Africa | South Africa |
| Egypt | |
| Rest of Africa | |
| South America | Brazil |
| Argentina | |
| Rest of South America |
Key Questions Answered in the Report
What is the current size of the switchgear market?
The switchgear market generated USD 129.7 billion in 2025.
How fast is the switchgear market expected to grow?
The market is forecast to post a 6.1% CAGR, reaching USD 174.38 billion by 2030.
Which segment is growing the fastest within the switchgear market?
Medium-voltage equipment leads growth at 10.5% CAGR on the back of grid-modernization and renewable-integration projects.
Why are SF₆-free technologies critical for switchgear suppliers?
European regulations phase out SF₆ in medium-voltage gear by 2026, forcing utilities worldwide to adopt alternative gases and rewarding OEMs with proven solutions.
How are data centers influencing switchgear demand?
Hyperscale facilities scaling to 100 MW loads require compact indoor GIS line-ups, driving 16% annual growth in related medium-voltage orders.
Which region holds the largest share of the switchgear market?
Asia-Pacific accounted for 45% of global revenue in 2024, supported by large-scale infrastructure programs in China and India.
Page last updated on: July 4, 2025

