Market Overview
| Study Period | 2019 - 2030 |
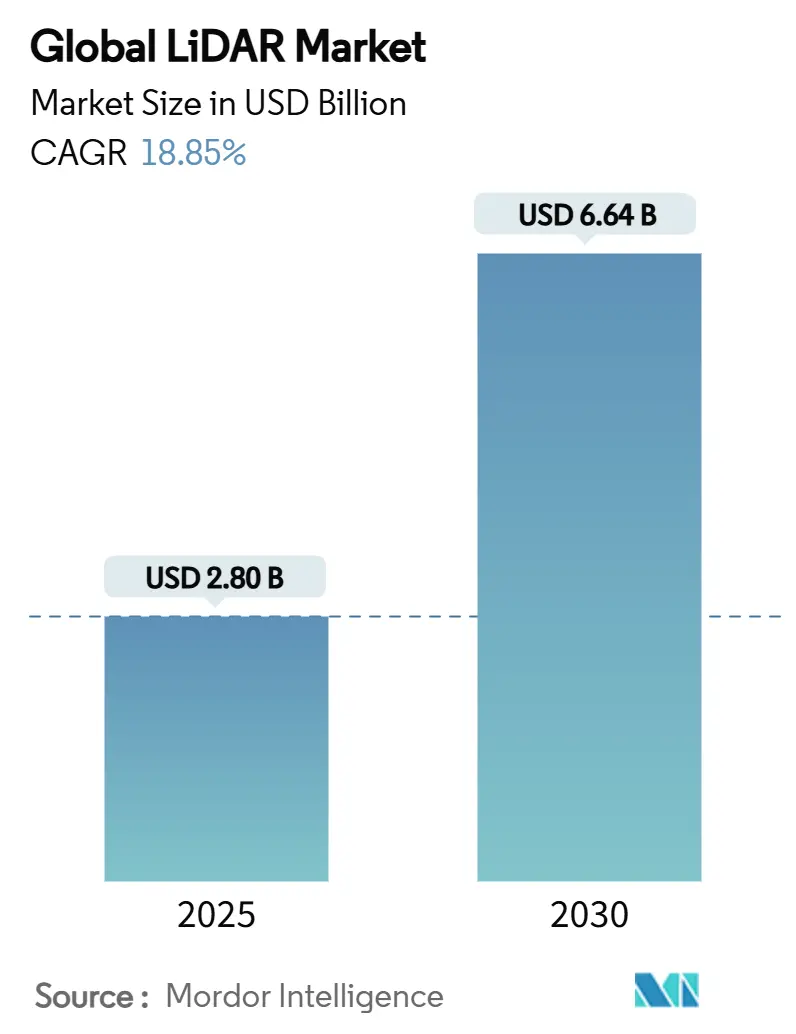
| Market Size (2025) | USD 2.80 Billion |
| Market Size (2030) | USD 6.64 Billion |
| Growth Rate (2025 - 2030) | 18.85% CAGR |
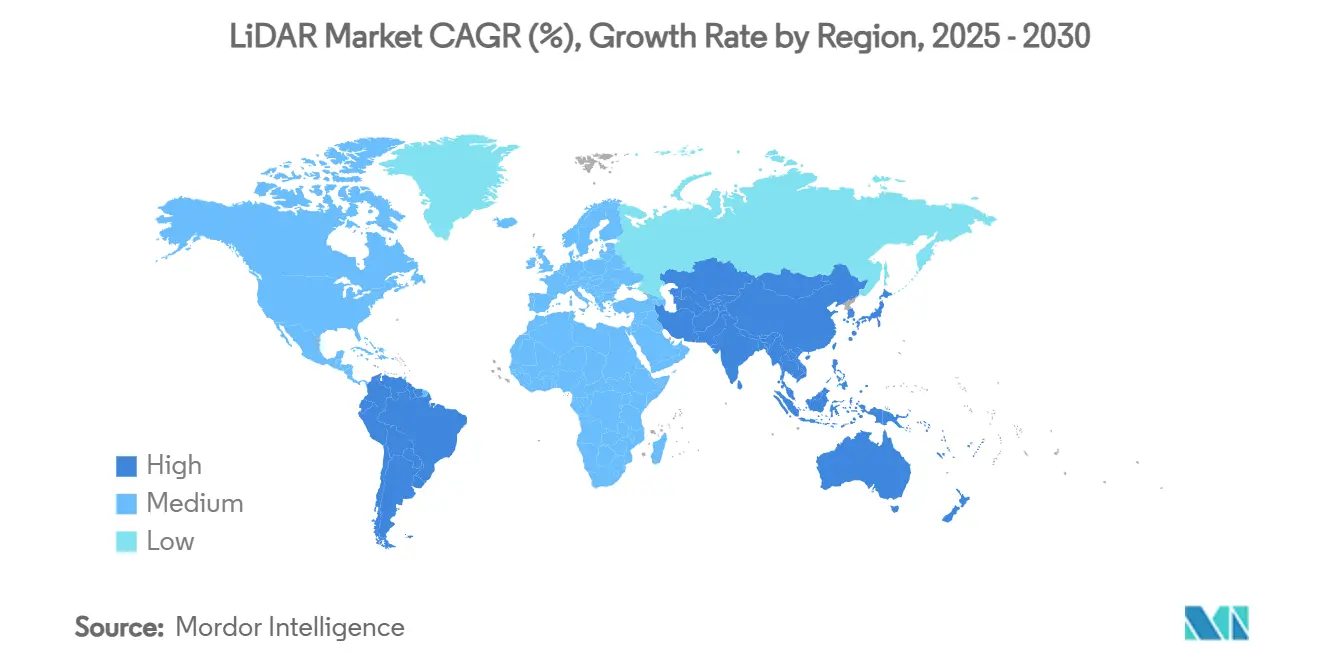
| Fastest Growing Market | Asia Pacific |
| Largest Market | Asia Pacific |
| Market Concentration | Medium |
Major Players*Disclaimer: Major Players sorted in no particular order Image © Mordor Intelligence. Reuse requires attribution under CC BY 4.0. |
|
LiDAR Market Analysis by Mordor Intelligence
The LiDAR market size stands at USD 2.8 billion in 2025 and is forecast to reach USD 6.64 billion by 2030, reflecting an 18.85% CAGR as solid-state sensors break the USD 500 price barrier and Level 3 autonomy regulations take effect .[1]Exclusive: China’s Hesai to Halve LiDAR Prices Next Year,” Reuters, reuters.com Cost-optimized vertical-cavity surface-emitting lasers (VCSELs), maturing single-photon avalanche diode (SPAD) arrays, and automotive-grade system-on-chips are lowering entry costs for mass-production vehicles while extending detection range and reliability. Regulation UN R-157 has removed optionality from sensor choice by specifying depth perception capabilities that radar–camera suites alone cannot satisfy, giving the LiDAR market a durable compliance tail-wind . [2]United Nations Economic Commission for Europe, “Uniform Provisions Concerning the Approval of Vehicles with Regard to Automated Lane Keeping Systems (UN R-157),” unece.orgFederal spending—such as the USD 830 million PROTECT grants and the expanding USGS 3D Elevation Program—anchors the corridor-mapping demand base across North America . Meanwhile, Chinese suppliers leverage complete domestic supply chains and state incentives to compress prices globally, intensifying competitive pressure but simultaneously expanding the LiDAR market by lowering adoption thresholds.
Key Report Takeaways
- By product/technology, the solid-state category led with 83.4% LiDAR market share in 2024, while FMCW sub-technology is projected to grow at 28% CAGR through 2030.
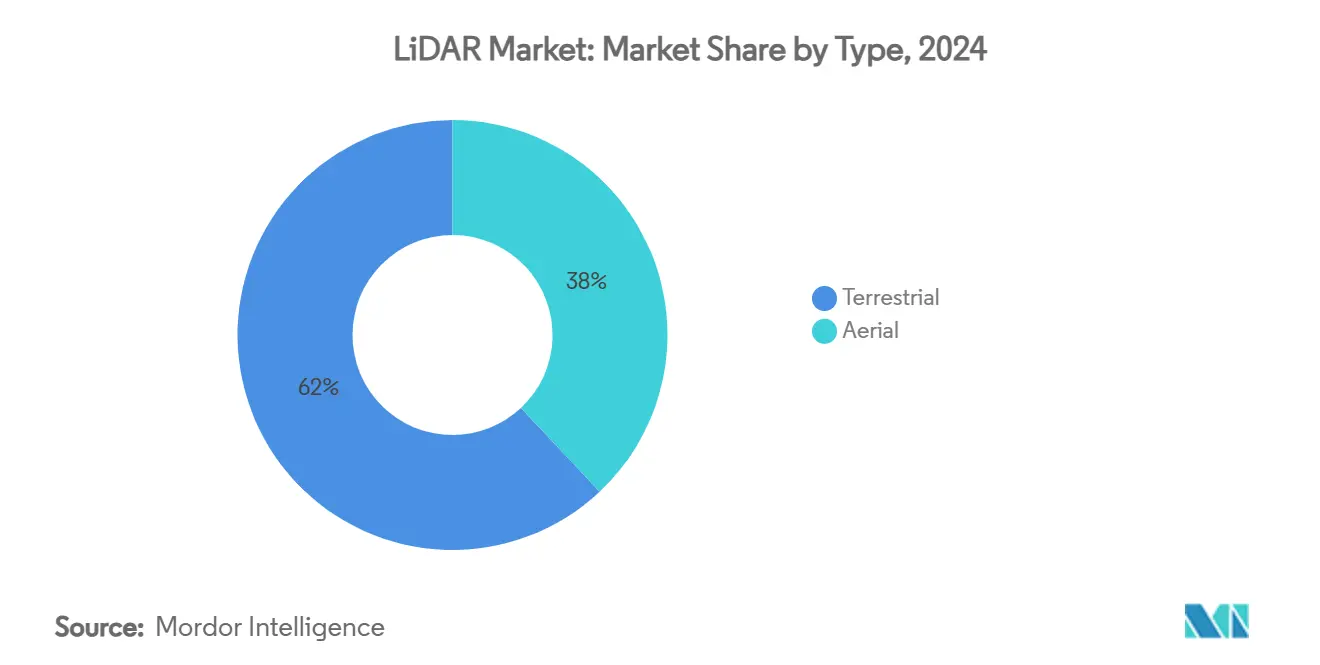
- By type, aerial systems captured 38% of the LiDAR market size in 2024; mobile terrestrial platforms are advancing at 24% CAGR thanks to smart-infrastructure projects.
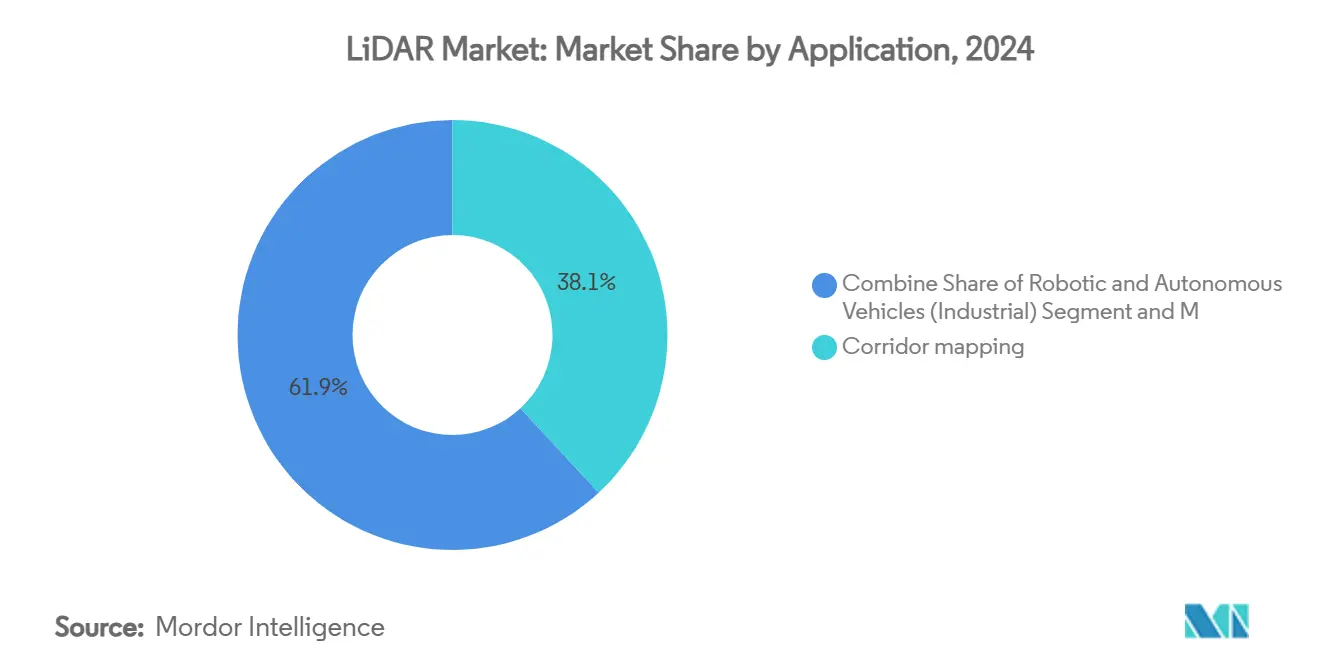
- By application, corridor mapping commanded 38.1% of the 2024 LiDAR market size; ADAS and autonomous driving applications are expanding at 27% CAGR to 2030.
- By range, short-range sensors (<100 m) accounted for 55.3% of the LiDAR market size in 2024, whereas long-range units (>200 m) are climbing at 22% CAGR.
- By geography, Asia-Pacific posted the fastest regional CAGR at 26% in 2024, propelled by China’s electric-vehicle boom and national LiDAR standards development
Global LiDAR Market Trends and Insights
Drivers Impact Analysis
| Driver | (~) % Impact on CAGR Forecast | Geographic Relevance | Impact Timeline |
|---|---|---|---|
| Breakthrough less than USD 500 Solid-State Sensors Accelerating Automotive Design-wins | 4.20% | China, EU, global spill-over | Short term (≤ 2 years) |
| Autonomous-driving regulation UN R-157 | 3.80% | Global, EU early adoption | Medium term (2–4 years) |
| US infrastructure grants for corridor & climate-resilience LiDAR mapping | 2.10% | North America, selective international | Medium term (2–4 years) |
| Drone-based surveys for utility-scale renewables | 1.90% | Africa, South America | Long term (≥ 4 years) |
| Offshore-wind bathymetric LiDAR campaigns | 1.70% | North Sea, East Asia | Medium term (2–4 years) |
| Perception-fusion demand for dark-warehouse robotics | 1.50% | Global | Short term (≤ 2 years) |
Source: Mordor Intelligence
Breakthrough <USD 500 Solid-State Sensors Accelerating Automotive Design-wins in China and EU
Rapid cost compression in VCSEL emitters and stacked SPAD receivers has pushed complete automotive-grade sensor modules below USD 500 without sacrificing 300 m detection range or 5 cm depth resolution . Hesai’s plan to halve list prices again in 2025 signals a price-elastic expansion toward mid-tier models rather than premium flagships, propelling near-term design-win volumes across more than 23 global OEMs . European automakers are synchronizing launch cycles to exploit the improved cost-performance curve, shortening validation timelines because solid-state architecture eliminates mechanical actuators.
Autonomous-Driving Regulation UN R-157 Triggering L3 LiDAR Ramp-ups
UN R-157 enforces minimum depth-perception, field-of-view, and redundancy benchmarks that camera-radar combinations cannot satisfy in highway automation, effectively hard-coding LiDAR into every homologated Level 3 stack. The regulation’s early EU implementation, mirrored by China’s forthcoming GB/T 45500-2025, enables global platform commonality, cutting OEM re-engineering costs and accelerating rollout schedules. Industry-wide collaboration through ISO/PWI 13228 chaired by Hesai is standardizing test protocols, reducing certification friction.
US Infrastructure Bill Funding Corridor & Climate-Resilience LiDAR Mapping
The USD 830 million PROTECT grants incentivize state DOTs to deploy high-resolution LiDAR mapping for flood-risk analysis and asset-hardening, embedding sensors into long-term maintenance budgets . Coupled with the USGS mandate to reach full national 3D Elevation coverage, public spending stabilizes the non-automotive revenue base and spurs private matching investment .[3]Source: U.S. Geological Survey, “3D Elevation Data Crucial to Supporting the Nation’s Infrastructure,” usgs.gov Procurement standards such as LAZ point-cloud delivery formalize workflows and favor providers with scalable data-management platforms.
Drone-based Topographical Surveys for Utility-Scale Renewables in Africa & South America
Solar and wind developers harness drone-mounted LiDAR for rapid terrain modeling, shaving weeks off preliminary engineering while cutting on-site labor in remote regions. Local regulations now mandate environmental baseline studies that LiDAR completes faster than traditional methods, accelerating project approval cycles and expanding addressable demand among utility-scale installations.
Restraints Impact Analysis
| Restraint | (~) % Impact on CAGR Forecast | Geographic Relevance | Impact Timeline |
|---|---|---|---|
| EU eye-safety rules hindering 1550 nm long-range automotive LiDAR | −2.3% | EU, regulatory spill-over globally | Medium term (2–4 years) |
| 4D imaging radar price-pressure on short-range ADAS sensors | −1.8% | Global, automotive focus | Short term (≤ 2 years) |
| Aggressive Chinese price cuts squeezing Western vendor margins | −1.5% | Global, highest in price-sensitive markets | Short term (≤ 2 years) |
| Rising compliance costs from evolving laser-safety standards | −1.2% | Global | Medium term (2–4 years) |
Source: Mordor Intelligence
EU Eye-Safety Rules Hindering 1550 nm Long-Range Automotive LiDAR
IEC 60825-1 Class 1 limits severely restrict permissible laser power at 1550 nm in passenger vehicles, curbing practical detection ranges below the 200 m required for highway autonomy. OEMs therefore pivot to 905 nm or multi-sensor fusion, adding cost and architectural complexity while capping the potential of otherwise superior atmospheric-penetration wavelengths.
4D Imaging Radar Price-Pressure on Short-Range ADAS Sensors
Next-generation millimeter-wave radar integrates MIMO arrays to deliver near-LiDAR angular resolution at a fraction of the price, eroding LiDAR value in low-speed urban functions such as parking assistance. Continental and other tier-ones bundle 4D radar into existing ECU footprints, forcing LiDAR vendors to justify incremental advantages in precision object classification.
Segment Analysis
By Type: Aerial Applications Lead Infrastructure Modernization
Aerial platforms retained 38% of 2024 LiDAR market share as large-area surveys for flood-risk mitigation, offshore-wind siting, and precision agriculture drove sustained flight-hour demand. Single-photon instruments now capture 14 million points per second, cutting mission time and boosting return-on-investment for agencies mapping corridor assets at national scales.
Mobile terrestrial units, however, are expanding at 24% CAGR, propelled by smart-city and vehicle-mounted road-asset inventories that integrate seamlessly with HD map generation. As autonomous-ready highways proliferate, data-collection frequency rises, positioning mobile platforms to rival aerial share by the decade’s end. Continued cost drops in inertial measurement units and real-time kinematic corrections reinforce growth momentum across urban regions.
By Product/Technology: Solid-State Dominance Accelerates FMCW Innovation
Solid-state sensors accounted for 83.4% of 2024 revenues, reflecting OEM preference for vibration-proof architectures and simplified assembly that enable long-term reliability targets. The LiDAR market size for solid-state modules is on track to exceed USD 5 billion by 2030 at segment-leading 28% CAGR.
Frequency-modulated continuous-wave designs measure Doppler velocity alongside range, enriching perception stacks with instantaneous motion cues that traditional time-of-flight lacks. Immune to crosstalk and external illumination, FMCW unlocks high-density urban deployment where many vehicles operate concurrent sensors. Mechanical scanning persists in niche ultra-resolution use-cases, yet declining unit volumes suggest an inevitable transition as wafer-scale beam-steering matures.
By Component: Software Integration Drives Value-Chain Evolution
Laser scanners still delivered 45.5% of 2024 component revenue, but software and analytics subscriptions are growing 23% annually as integrators monetize cloud-based perception-as-a-service. OEMs increasingly outsource point-cloud labeling, object detection, and over-the-air performance updates, generating annuity-style earnings and buffering hardware commoditization.
Sony’s IMX479 stacked SPAD elevates receiver sensitivity to 37% photon-detection efficiency, extending detection to 300 m while maintaining compact form factor, enabling tighter sensor-head packaging on vehicle fascia. Navigation subsystems combining GNSS and MEMS-IMU continue to sell steadily because sensor fusion remains mandatory for centimeter-level localization accuracy.
By Range: Short-Range Dominance Faces Long-Range Growth
Short-range units (<100 m) supplied 55.3% of the 2024 LiDAR market size owing to high-volume adoption in blind-spot monitoring and automated parking. Regulatory momentum toward Level 3 autonomy is now shifting R&D budgets toward long-range (>200 m) modules, producing 22% CAGR as highway pilot features become standard on premium trims.
EU eye-safety ceilings at 1550 nm constrain peak power and thus range, but emerging eye-safe beam-shaping optics and pulse-coding techniques could restore competitiveness without regulatory re-write. In the interim, 905 nm platforms secure new vehicle integrations despite solar-noise trade-offs, highlighting the dynamic compliance landscape that shapes sensor-roadmaps.
By Application: ADAS Growth Outpaces Traditional Mapping
Corridor mapping remained the largest application at 38.1% of 2024 revenue, underpinned by government stimulus and climate-adaptation investments that embed LiDAR into hazard-modeling standards. Yet ADAS and autonomous-driving deployments post the fastest clip at 27% CAGR as OEMs race to satisfy UN R-157 mandates for sensor redundancy.
The LiDAR market size dedicated to ADAS could top USD 2.4 billion by 2030, reflecting the shift from optional luxury feature to regulatory prerequisite. While civil-engineering and marine-survey tasks continue to depend on LiDAR for centimeter-grade accuracy, automotive volumes will dictate future price curves and component-roadmaps.
By End-User Industry: Automotive Surge Reshapes Market Dynamics
Automotive OEMs overtook surveying agencies as the biggest purchasers by unit volume in 2024, absorbing more than 300,000 sensors and committing to multi-year sourcing contracts. The LiDAR market now orients R&D around automotive operating envelopes, from -40 °C to +85 °C, and 15-year life cycles that far exceed electronics norms in adjacent sectors.
Aerospace and defense sustain a profitable high-specification niche, illustrated by Aeva’s national-security contract for critical-infrastructure protection. Energy, utilities, and construction follow closely, embedding LiDAR in predictive maintenance, digital-twin modeling, and renewable-site engineering—use-cases that demand lower volumes but command healthy margins.
Geography Analysis
Asia-Pacific led in growth with a 26% regional CAGR in 2024, driven by Chinese OEM production that now integrates LiDAR on mid-tier EVs after high-profile camera failures highlighted depth-perception gaps. Hesai and RoboSense leverage vertically integrated supply chains and provincial subsidies to offer sensors at price points that undercut global averages by up to 40%, broadening domestic adoption and setting aggressive benchmarks abroad. National standard GB/T 45500-2025 establishes performance floors that ripple across global homologation programs and incentivize export-oriented hardware conformity.
North America maintains sizable share anchored by federal infrastructure outlays and strong venture capital backing for autonomous-driving startups. The PROTECT grants allocate USD 830 million toward LiDAR-enabled climate resilience mapping, ensuring recurring demand beyond automotive verticals. Advanced space-borne programs such as NASA’s GEDI continue to stretch technical frontiers and funnel spin-off components into commercial channels. Canada’s offshore technology push, exemplified by Kraken’s acquisition of 3D at Depth, expands underwater-survey capabilities and diversifies revenue streams.
Europe balances strong regulatory pull with stringent laser-safety limitations. Type-approval Regulation (EU) 2019/2144 compels ADAS fitment, elevating LiDAR procurement, yet IEC 60825-1 hampers 1550 nm automotive adoption, forcing platform developers to juggle eye-safety and range needs. High offshore-wind build-rates in the North Sea drive bathymetric LiDAR campaigns, while single-photon airborne sensors shorten survey windows for cross-border rail corridors. Emerging markets in Latin America and Africa increasingly deploy drone-based LiDAR to accelerate renewable-energy siting and mining exploration, benefitting from falling per-flight costs and expanding cellular backhaul coverage.
Competitive Landscape
Chinese companies now account for roughly 60% of automotive LiDAR revenues, with Hesai alone capturing 37% global share on 195,818 unit shipments in Q1 2025—making it the first profitable pure-play in the segment. Economies of scale, domestic VCSEL fabrication, and state tax credits enable list prices that reset the global ASP baseline. RoboSense mirrors this strategy and has secured multiple international OEM nominations.
Western incumbents pivot toward differentiation. Luminar restructured to trim USD 50–65 million in annual costs while doubling down on its Halo 1550 nm long-range platform and perception software stack, betting that premium performance will command margins where price competition is unsustainable. Ouster and Innoviz seek scale through mergers and licensing deals targeting defense, heavy industrial, and smart-infrastructure sectors rather than volume passenger cars.
Component and software specialists expand horizontally: Viavi’s USD 150 million purchase of Inertial Labs folds navigation-grade IMUs into its sensor-test portfolio, underscoring a trend toward vertically integrated perception ecosystems. Sony’s SPAD receivers give external module assemblers a plug-and-play path to compact formats, while Aeva’s FMCW IP positions it as a licensable technology nucleus for tier-ones seeking interference immunity and direct velocity data.
LiDAR Industry Leaders
-
Sick AG
-
Velodyne LiDAR
-
Leica Geoystems AG
-
Faro Technologies Inc.
-
Denso Corporation
- *Disclaimer: Major Players sorted in no particular order
Need More Details on Market Players and Competitors?
Download PDF
Recent Industry Developments
- June 2025: Sony unveiled the IMX479 stacked SPAD depth sensor with 37% PDE and 300 m range, priced at ¥35,000 (USD 233) for samples.
- May 2025: Hesai reported RMB 525.3 million (USD 72.4 million) Q1 revenue and 195,818 unit shipments, retaining global leadership.
- May 2025: Luminar recorded a 50% sequential shipment increase and announced plans to triple annual production by end-2025.
- May 2025: China released GB/T 45500-2025, its first national automotive LiDAR performance standard with Hesai as lead drafter.
Global LiDAR Market Report Scope
LiDAR, short for Light Detection and Ranging, employs pulsed laser light in its remote sensing technique to gauge distances to the Earth. By integrating these light pulses with additional data captured by airborne systems, LiDAR produces accurate three-dimensional representations of the Earth's contours and surface features.
The LiDAR market is segmented by application (robotic vehicles, ADAS, environment (topography, wind, and agriculture and forestry), and industrial), type (aerial (Topographic and Bathymetric) and terrestrial (Mobile and Static)), and geography (North America, Europe, Asia, Australia and New Zealand, Latin America, and Middle East and Africa). The report offers the market size in value terms in USD for all the abovementioned segments.
| By Type | Aerial | Topographic | |
| Bathymetric | |||
| Terrestrial | Mobile | ||
| Static | |||
| By Product/Technology | Mechanical | ||
| Solid-State (MEMS) | |||
| By Component | Laser Scanner | ||
| Navigation and Positioning (IMU / GNSS) | |||
| Beam-Steering and MEMS Mirrors | |||
| Photodetector / Receiver | |||
| Software and Services | |||
| By Range | Short (<100 m) | ||
| Medium (100-200 m) | |||
| Long (>200 m) | |||
| By Application | Advanced Driver-Assistance Systems (ADAS) | ||
| Robotic and Autonomous Vehicles (Industrial | Delivery | ||
| Corridor and Topographic Mapping | |||
| Environmental and Forestry Monitoring | |||
| Urban Planning and Smart Infrastructure | |||
| Marine and Bathymetric Survey | |||
| By End-User Industry | Automotive | ||
| Aerospace and Defense | |||
| Civil Engineering and Construction | |||
| Energy and Utilities | |||
| Agriculture | |||
| Oil and Gas | |||
| By Geography | North America | United States | |
| Canada | |||
| Mexico | |||
| South America | Brazil | ||
| Argentina | |||
| Rest of South America | |||
| Europe | Germany | ||
| France | |||
| United Kingdom | |||
| Italy | |||
| Spain | |||
| Rest of Europe | |||
| Asia-Pacific | China | ||
| Japan | |||
| South Korea | |||
| India | |||
| Australia | |||
| Indonesia | |||
| Rest of Asia-Pacific | |||
| Middle East and Africa | United Arab Emirates | ||
| South Africa | |||
| Saudi Arabia | |||
| Nigeria | |||
| Kenya | |||
| Rest of Middle East and Africa | |||
By Type
| Aerial | Topographic |
| Bathymetric | |
| Terrestrial | Mobile |
| Static |
By Product/Technology
| Mechanical |
| Solid-State (MEMS) |
By Component
| Laser Scanner |
| Navigation and Positioning (IMU / GNSS) |
| Beam-Steering and MEMS Mirrors |
| Photodetector / Receiver |
| Software and Services |
By Range
| Short (<100 m) |
| Medium (100-200 m) |
| Long (>200 m) |
By Application
| Advanced Driver-Assistance Systems (ADAS) | |
| Robotic and Autonomous Vehicles (Industrial | Delivery |
| Corridor and Topographic Mapping | |
| Environmental and Forestry Monitoring | |
| Urban Planning and Smart Infrastructure | |
| Marine and Bathymetric Survey |
By End-User Industry
| Automotive |
| Aerospace and Defense |
| Civil Engineering and Construction |
| Energy and Utilities |
| Agriculture |
| Oil and Gas |
By Geography
| North America | United States |
| Canada | |
| Mexico | |
| South America | Brazil |
| Argentina | |
| Rest of South America | |
| Europe | Germany |
| France | |
| United Kingdom | |
| Italy | |
| Spain | |
| Rest of Europe | |
| Asia-Pacific | China |
| Japan | |
| South Korea | |
| India | |
| Australia | |
| Indonesia | |
| Rest of Asia-Pacific | |
| Middle East and Africa | United Arab Emirates |
| South Africa | |
| Saudi Arabia | |
| Nigeria | |
| Kenya | |
| Rest of Middle East and Africa |
Need A Different Region or Segment?
Customize Now
Key Questions Answered in the Report
1. What is the current size of the LiDAR market?
The LiDAR market size is USD 2.8 billion in 2025 and is projected to reach USD 6.64 billion by 2030.
Which LiDAR technology is growing fastest?
Solid-state frequency-modulated continuous-wave (FMCW) sensors are growing at 28% CAGR thanks to cost-effective velocity measurement and interference immunity.
How do regulations impact LiDAR adoption in vehicles?
UN R-157 mandates depth-perception capabilities that only LiDAR can meet, driving compulsory integration for Level 3 autonomous functions in key markets.
Why are Chinese vendors dominating the LiDAR market?
Vertical integration, state subsidies, and aggressive pricing have enabled Chinese suppliers such as Hesai to seize approximately 60% of automotive revenues.
Page last updated on: July 6, 2025

