
Healthcare Fintech Market Size and Share
Market Overview
| Study Period | 2020 - 2031 |
|---|---|
| Market Size (2026) | USD 24.80 Billion |
| Market Size (2031) | USD 40.30 Billion |
| Growth Rate (2026 - 2031) | 10.20 % |
| Fastest Growing Market | Asia-Pacific |
| Largest Market | North America |
| Market Concentration | High |
Major Players *Disclaimer: Major Players sorted in no particular order Image © Mordor Intelligence. Reuse requires attribution under CC BY 4.0. | |
Healthcare Fintech Market Analysis by Mordor Intelligence
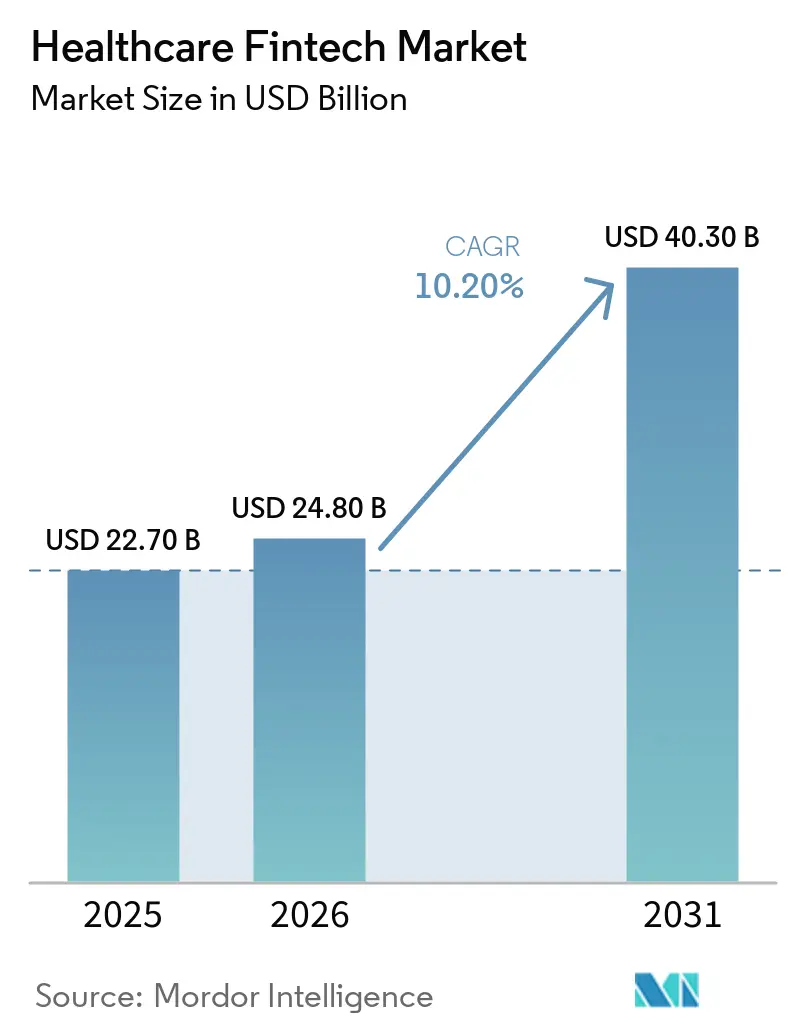
The healthcare fintech market size is expected to increase from USD 22.7 billion in 2025 to USD 24.8 billion in 2026 and reach USD 40.3 billion by 2031, growing at a CAGR of 10.2% over 2026-2031. Rising medical spending is increasing the number and complexity of financial transactions that move among patients, providers, payers, employers, and payment partners, particularly when payment responsibility is divided among several parties, and information must move accurately between their separate administrative systems. United States national health spending reached USD 5.7 trillion in 2025 and is projected to reach USD 6.0 trillion in 2026, providing a broad spending base for the USD 24.8 billion global healthcare fintech market in 2026. Larger platforms are strengthening their positions through transaction scale, network relationships, security controls, and automation capabilities, while enterprise customers often seek fewer systems that can manage related financial activities across their connected customer base. At the same time, software platforms are bringing payment acceptance, financing, and benefits tools into clinical and administrative workflows, allowing financial tasks to sit closer to the information that initiates them. This creates room for specialized suppliers in the healthcare fintech market that can improve a defined part of the care-payment process, connect with established systems, and meet demanding privacy, integration, and operational requirements.
Key Report Takeaways
- By function, healthcare consumer financing held 29.1% of the healthcare fintech market share in 2025, while healthcare B2B payments and provider AP are forecast to grow at a 14.4% CAGR through 2031.
- By economic buyer, healthcare providers held 42.3% of the healthcare fintech market share in 2025, while patients and individual consumers are forecast to grow at a 12.6% CAGR through 2031.
- By channel, direct enterprise held 37.8% of the healthcare fintech market share in 2025, while embedded/API/OEM integration is forecast to grow at a 16.2% CAGR through 2031.
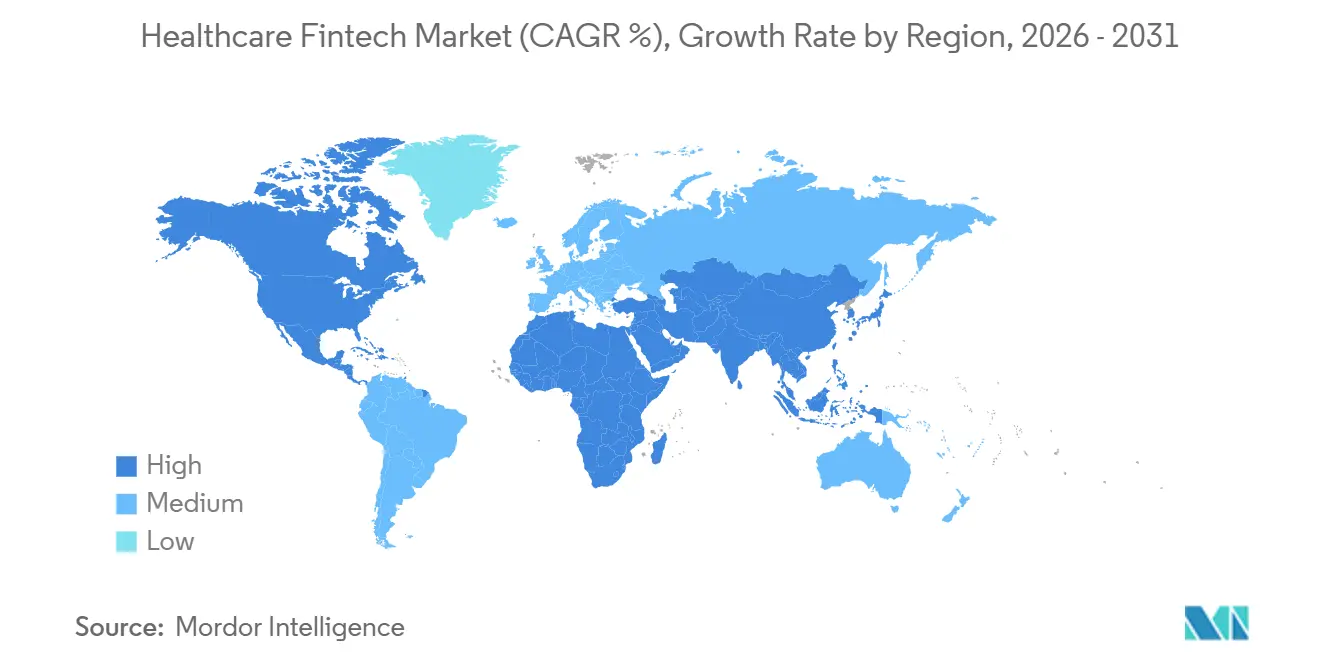
- By geography, North America held 78.9% of the healthcare fintech market share in 2025, while the Asia-Pacific is expected to register the fastest growth through 2031.
Note: Market size and forecast figures in this report are generated using Mordor Intelligence’s proprietary estimation framework, updated with the latest available data and insights as of January 2026.
Market Trends and Insights
Drivers Impact Analysis of Healthcare Fintech Market*
| Driver | (~) % Impact on CAGR Forecast | Geographic Relevance | Impact Timeline |
| Rising Healthcare Costs And Patient Financial Responsibility | +2.8% | North America, with secondary effects in Europe and Asia-Pacific as cost-sharing models evolve | Medium term (2-4 years) |
| Digitalization Of Healthcare Payment And Financial Transactions | +1.8% | Global, concentrated in North America and Asia-Pacific for platform adoption | Short term (≤ 2 years) |
| Complex Healthcare Revenue, Claims, And Reimbursement Workflows | +1.5% | North America and Europe, especially markets with multi-payer systems | Medium term (2-4 years) |
| Integrated Financial Experiences Across The Care Journey | +1.0% | North America, Western Europe, and South Korea | Medium term (2-4 years) |
| Expansion Of Digital And Remote Healthcare Delivery | +0.8% | Asia-Pacific, with spillover to the Middle East and Africa and South America | Long term (≥ 4 years) |
| Healthcare-Specific Embedded Payments And Financing | +1.2% | Global, with fastest adoption in Asia-Pacific and North American embedded software ecosystems | Short term (≤ 2 years) |
| Source: Mordor Intelligence | |||
Rising Healthcare Costs And Growing Patient Financial Responsibility
Patient financial exposure remains a durable source of demand for the healthcare fintech market because cost sharing places more payment responsibility directly on households, often at the point when care is needed. The average single-coverage deductible for employer-plan participants reached USD 1,886 in 2025, and 34% of covered workers had deductibles above USD 2,000[1]. High-deductible plan enrollees were 4.7 percentage points less likely to receive recommended care than people without such plans, which gives financing tools a role in helping patients proceed with needed treatment. A federal court vacated the medical-debt credit-reporting rule in July 2025, leaving patient credit exposure subject to continued policy uncertainty. Providers need faster collections when patients carry larger balances, especially when delayed payments affect follow-up outreach, cash planning, and staff workload. Consumer financing, payment plans, and clear digital billing can support patient access while giving providers a more organized process for managing self-pay balances.
Digitalization Of Healthcare Payment And Financial Transactions
Digital payment tools are moving revenue-cycle work from follow-up billing toward earlier checks, automated decisions, and faster payment posting across provider operations. Around 80% of health systems were exploring, piloting, or implementing generative AI tools in the revenue cycle, and 27% were already using them at scale[2]. This adoption gives providers stronger reasons to connect payment, remittance, coding, and denial management within the same operating process, instead of passing information between separate teams. Automated workflows can identify incomplete information before claims move into slower manual review queues, where delays can create further work for both staff and patients. Real-time payment rails and application programming interfaces can reduce the time between adjudication, remittance, posting, and the availability of information for financial follow-up. The healthcare fintech market benefits when these capabilities become routine operating tools that are connected to existing revenue-cycle processes rather than isolated technology pilots.
Increasing Complexity Of Healthcare Revenue, Claims, And Reimbursement Workflows
Healthcare payment and remittance processes remain difficult because claim information, funds transfer, and accounting reconciliation often follow different paths across payer and provider systems. Electronic remittance advice and electronic funds transfer may arrive separately, while payment batches can contain many claims with limited contextual detail that staff must interpret. More than 41% of healthcare organizations still relied mainly on manual payment reconciliation workflows in 2025. This leaves finance teams with an operational reason to adopt matching tools, workflow automation, and richer remittance data that can be used without repeated manual intervention. It also explains why providers are evaluating systems that link payer data with patient accounts, internal accounting records, denial information, and ongoing claims activity. The healthcare fintech market can grow as vendors reduce this routine administrative workload without requiring providers to replace the core systems already used by clinical and finance teams.
Growing Adoption Of Healthcare-Specific Embedded Payments And Financing Solutions
Embedded finance is making payments a feature of healthcare software rather than a separate vendor interaction that requires users to leave their normal workflow. The Embedded/API/OEM channel is forecast to expand at a 16.2% CAGR through 2031, the fastest rate among channel models in the Healthcare FinTech Market. Healthcare software can bring payment acceptance, financing options, and benefit administration into the same workflow used by front-office staff, finance teams, clinicians, and patients. This approach can reduce handoffs between clinical, administrative, and financial systems, helping organizations present financial choices closer to the relevant care or billing event. It may also shift customer control toward electronic health record and practice-management platforms that own the daily workflow and retain the primary user relationship. Suppliers with strong application interfaces can participate in those workflows without requiring every provider to install a standalone financial platform or manage another separate vendor process.
Restraints Impact Analysis of Healthcare Fintech Market*
| Restraint | (~) % Impact on CAGR Forecast | Geographic Relevance | Impact Timeline |
|---|---|---|---|
| Healthcare And Financial Data Privacy, Security, And Cybersecurity Risks | -1.5% | Global, most acute in North America because of HIPAA requirements and increasingly relevant in Asia-Pacific under new privacy frameworks | Short term (≤ 2 years) |
| Complex Integration With Legacy Healthcare And Financial Systems | -1.0% | North America and Europe, especially markets with varied electronic health record systems | Medium term (2-4 years) |
| Fragmented Payer, Provider, And Reimbursement Ecosystems | -0.8% | North America and South America | Long term (≥ 4 years) |
| Complex Regulatory Requirements Across Healthcare And Financial Services | -0.6% | Global, with the highest compliance cost in North America and the European Union | Medium term (2-4 years) |
| Source: Mordor Intelligence | |||
Healthcare And Financial Data Privacy, Security, And Cybersecurity Risks
Cybersecurity is a material constraint because healthcare financial platforms handle sensitive patient, payment, claims, and identity data across several connected organizations. The Change Healthcare breach affected 192.7 million people and showed how disruption at a payment infrastructure provider can interrupt claims and billing across provider networks[3]. Vendors must meet healthcare privacy duties and payment-card security requirements while demonstrating reliable controls during procurement, implementation, and ongoing operations. These requirements increase the cost and time needed to win enterprise customers because buyers need evidence that sensitive information remains protected through every processing stage. They also increase the value of established vendors that can document security practices, continuity planning, audit readiness, and response procedures for a significant incident. The healthcare fintech market, therefore, favors security capabilities that are built into product design, vendor oversight, operational processes, and customer assurance materials.
Complex Integration With Legacy Healthcare And Financial Systems
Integration remains difficult when providers use different electronic health records, practice-management, billing, and payment systems that were purchased at different times for different operational needs. A mismatch between purchase-order, invoice, and patient-account data can delay a payment even when each separate system appears to be operating normally. Smaller providers face a larger burden because they may lack staff who can manage implementation work, manual exceptions, data mapping, and coordination with several technology suppliers. This can delay adoption even where the financial value of automation is clear, because the immediate implementation demand falls on already constrained teams. Prebuilt connectors and application programming interface-based designs can shorten implementation work, reduce manual adjustments, and improve a supplier’s ability to serve independent practices. The healthcare fintech market must therefore balance product breadth with practical deployment across varied provider technology environments and limited internal implementation capacity.
*Our forecasts treat driver/restraint impacts as directional, not additive. The impact forecasts reflect baseline growth, mix effects, and variable interactions.
Healthcare Fintech Market Segment Analysis
By Function:
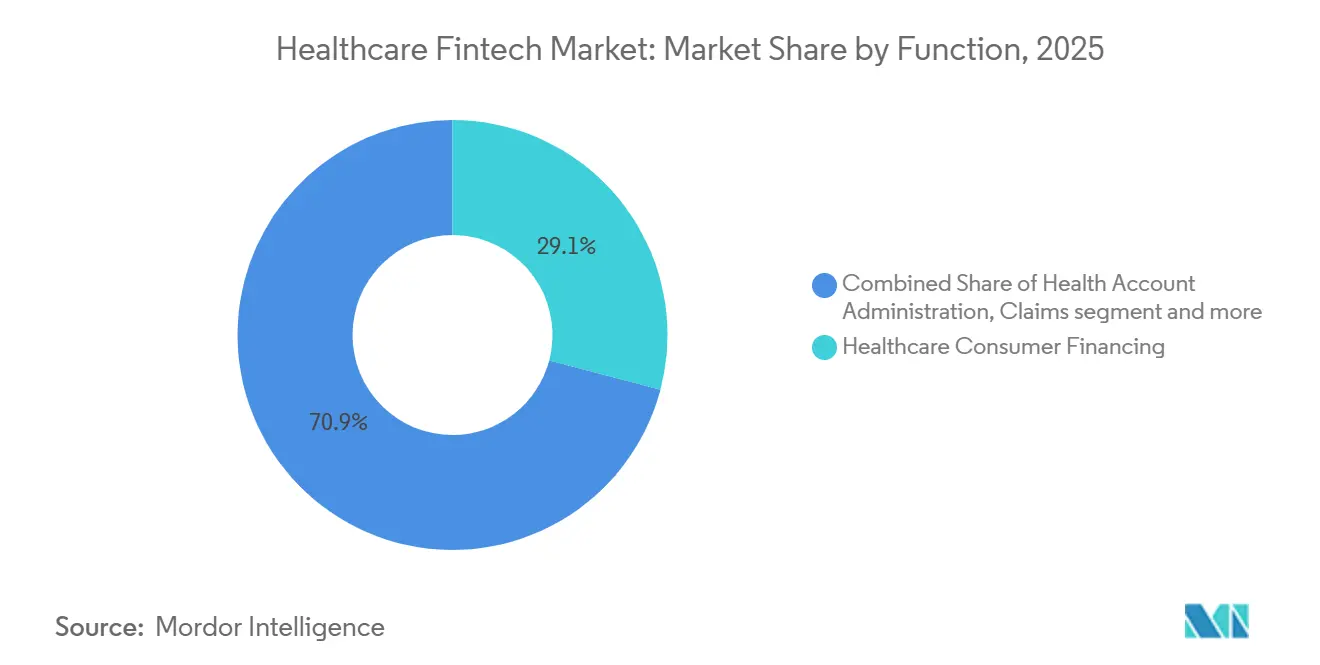
B2B Automation Outpaces Consumer Financing GrowthHealthcare consumer financing held 29.1% of the healthcare fintech market share in 2025, making it the largest function category and showing the scale of direct patient payment responsibility. The category reflects broad use of patient credit products in hospital systems, specialty practices, and ambulatory settings, where treatment decisions may create an immediate payment need. CareCredit, PatientFi, PayZen, and AccessOne have served different borrower needs, from point-of-care installment arrangements to longer-duration medical loans, with each approach addressing a distinct affordability situation. Patient payments, payment facilitation, and consumer-directed account administration represent other important parts of the function mix and connect patients with providers' financial operations. Health savings account administration has continued to expand as employers and account holders use these accounts to manage eligible medical expenses and set aside funds before care occurs. HealthEquity reported 10.7 million health savings accounts in July 2026, up 8% year over year, with USD 38 billion in assets.
Healthcare B2B payments and provider AP are forecast to grow at a 14.4% CAGR through 2031, the highest rate among function categories. The healthcare fintech market size for this function is supported by the need to align claims information, remittance details, payment posting, and internal accounting records more quickly. Separate payment and remittance rails have left provider accounting teams with routine reconciliation work that can be automated, particularly when batches contain many claims or payment records. Straight-through processing, real-time payment methods, and AI-supported remittance matching address this workload by helping staff identify relevant information sooner. MediStreams reported a record 2025 after expanding application programming interface connectivity for direct ingestion and intelligent categorization of payer data feeds. Claims, eligibility, and remittance rails remain foundational because they support denial prevention and prior authorization workflows that affect payment accuracy and speed. Larger platforms and newer suppliers are building these capabilities into broader revenue-cycle offerings, supporting the expansion of the healthcare fintech market.

By Economic Buyer:
Providers Dominate, Patients Drive GrowthHealthcare providers held 42.3% of the healthcare fintech market share in 2025, reflecting their large and complex payment flows across several financial relationships. Providers buy revenue-cycle, patient-engagement, payment-facilitation, and accounts-payable tools to manage reimbursement, collections, and operational follow-up. Their spending decisions are shaped by payer payments, inter-facility transfers, patient billing, vendor obligations, and the need to keep each process visible to responsible staff. Waystar processed 7.5 billion healthcare payment transactions annually across 30,000 clients, representing more than 1 million providers. Its AI solutions prevented USD 15.5 billion in denials in 2025, showing the financial scale of provider revenue-cycle operations. Payers, employers, and plan sponsors also purchase eligibility, payment routing, and benefits administration services that aggregate high transaction volumes from their covered members.
Patients and individual consumers are forecast to grow at a 12.6% CAGR through 2031, faster than other economic-buyer categories. This growth reflects insurance designs that require many patients to act as direct payers for routine care and weigh payment choices alongside clinical decisions. Fifty-eight percent of privately insured Americans were enrolled in high-deductible health plans in 2024, and average individual deductibles were USD 2,418. Each care encounter can therefore create a patient financial decision involving payment timing, financing, assistance, billing clarity, or the use of available benefit-account funds. Cedar launched its Kora platform in August 2026 to manage billing notifications through voice and two-way text. The company said the platform drew on 1.5 billion patient interactions and USD 13.6 billion in processed payments. These tools are intended to make billing communication more responsive while helping providers pursue collections, supporting growth in this increasingly patient-centered segment of the healthcare fintech market.
By Channel:
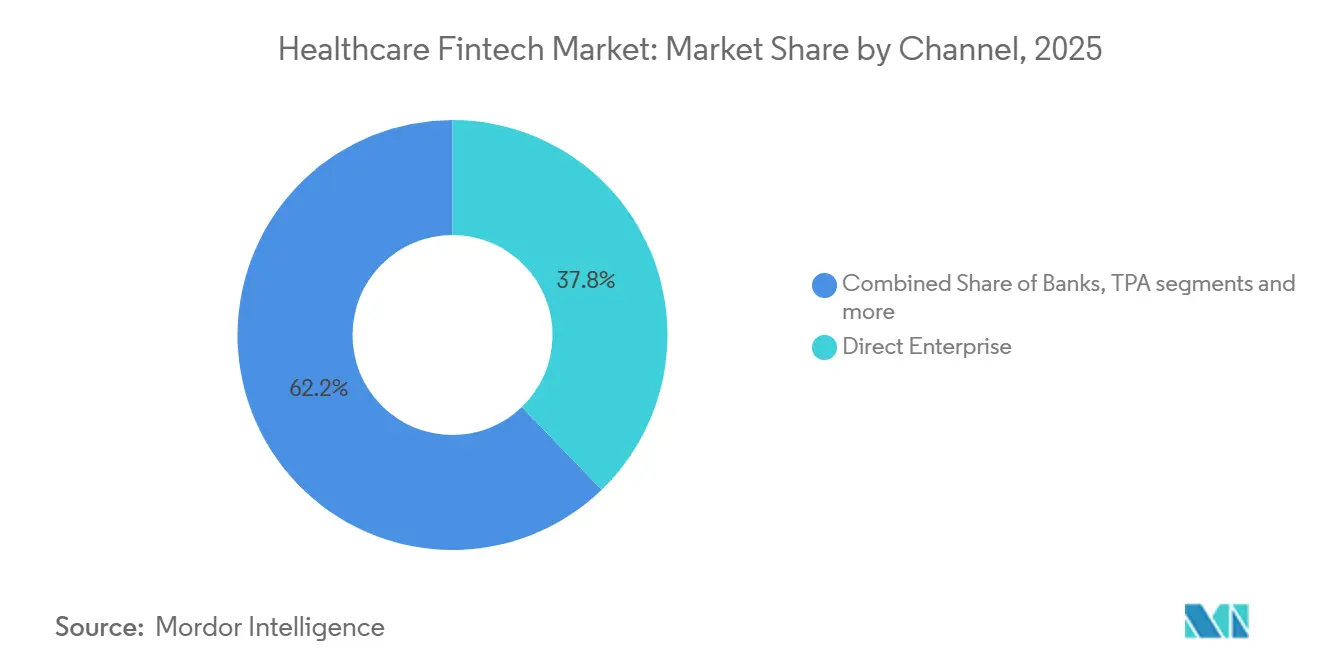
Embedded Integration Leads Market RedefinitionDirect enterprise held 37.8% of channel revenue and the leading healthcare fintech market share in 2025. Health systems and large practice groups commonly procure through direct sales engagements and structured enterprise contracts that involve financial, technology, security, and operational review. These contracts can provide stable revenue and high switching costs for suppliers once a platform becomes part of billing or payment workflows. Bank or issuer partners and third-party administrators remain important intermediaries for health savings accounts, health reimbursement arrangements, and flexible spending accounts. Their established relationships can slow channel changes, though they can also limit the pace of feature updates and reduce the visibility of newer specialist products. Direct selling remains relevant where providers need detailed implementation support, security reviews, enterprise contracting, and clear responsibility for ongoing service performance.
Embedded/API/OEM integration is forecast to grow at a 16.2% CAGR through 2031. Growth in the healthcare fintech market size for this channel is supported when a software platform includes payment acceptance or financing within its existing workflow and presents these services through familiar screens. The primary customer relationship may then sit with the electronic health record or practice-management provider rather than the financial technology supplier, changing how vendors reach users. This structure can retain transaction economics while reducing the need for a separate enterprise sales relationship or a standalone product experience. Flywire reported USD 8.2 billion in total payment volume in the second quarter of 2026, up 38.2% year over year[4]. Its patient financial experience platform has payment-processing deployments across multiple clients and gives users another way to manage payment activity within provider workflows. The channel's opportunity depends on higher payment adoption within platforms that already manage provider and patient workflows, supporting expansion of the healthcare fintech market.
Geography Analysis
North America Healthcare Fintech Market
North America held 78.9% of the healthcare fintech market share in 2025, supported by the United States' multi-payer insurance structure, high patient cost sharing, and extensive use of electronic health records. The region's administrative burden creates demand for revenue-cycle management, payment facilitation, benefit accounts, and patient financing. Canada's single-payer structure limits the addressable need for patient financing but still supports provider payment automation and employer benefit accounts. Mexico adds regional demand through its varied payer and provider environment. United States platforms such as Optum and Waystar operate at system scale, while PayZen and PatientFi focus more directly on patient financial needs. The USD 1,886 average employer-plan deductible in 2025 illustrates the patient exposure that supports these services.
Europe and South America Healthcare Fintech Market
Europe has a smaller but distinct role in the healthcare fintech market, as payment needs vary across national healthcare funding systems. The United Kingdom's NHS-centered model emphasizes administrative efficiency and workforce-related payment tools more than consumer financing. Germany's mixed statutory and private insurance framework creates more varied demand across financial workflows. The European Health Data Space supports interoperability and value-based reimbursement models for digital health. South America remains at an earlier stage, but fragmented private insurance arrangements create demand for claims validation and payment intermediation. Osigu has focused on Latin America, connecting more than 130 hospitals and processing 12 million transactions annually.
APAC and the Middle East Healthcare Fintech Market
Asia-Pacific is forecast to grow at a 14.7% CAGR through 2031, the fastest regional rate in the healthcare fintech market. Growth in the healthcare fintech market size across the region is supported by expanding digital health infrastructure and established digital payment ecosystems. India's Ayushman Bharat Digital Mission crossed 900 million unique health IDs in July 2026, creating a large digital foundation for authenticated healthcare interactions. India's payment infrastructure can support patient collections and provider disbursements through established real-time rails. China has mature Alipay and WeChat Pay payment networks that can support healthcare payment services. Saudi Arabia and the United Arab Emirates are developing digital healthcare capabilities, although their near-term addressable scale remains below that of North America and Asia-Pacific. Privacy, payment, and financial regulations raise entry requirements across the region and support suppliers that can demonstrate compliance.
Competitive Landscape
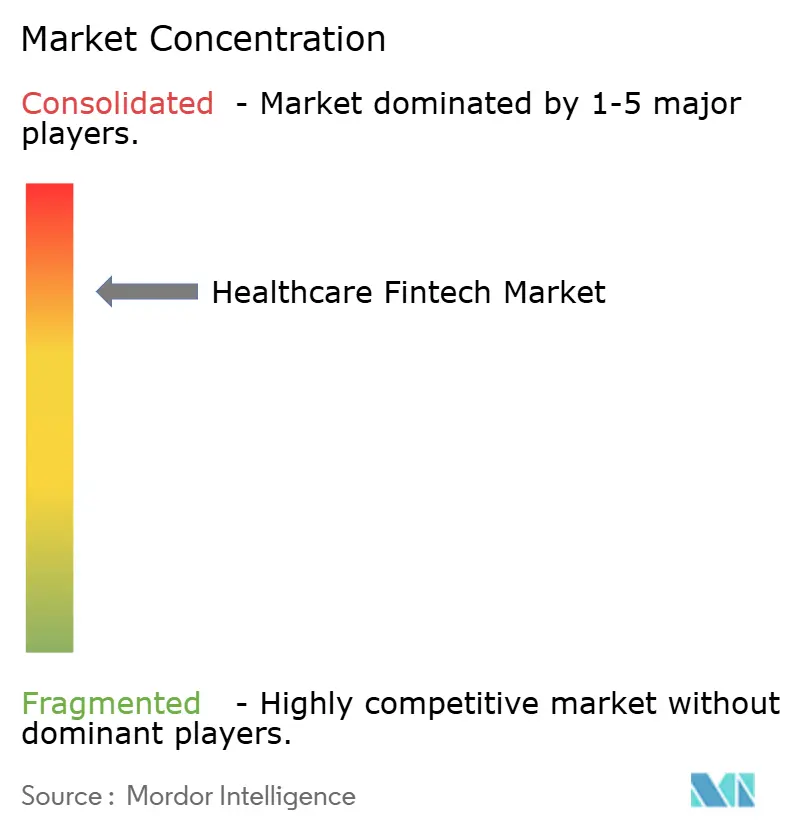
The healthcare fintech market has a high concentration in revenue-cycle and payer-connectivity functions, while patient financing and embedded payments remain more fragmented. Optum, Waystar, and Zelis hold strong positions through transaction scale, payer relationships, and accumulated data assets. These advantages make it harder for smaller suppliers to compete for broad enterprise mandates and capture healthcare fintech market share. Waystar launched AltitudeAI-powered agentic capabilities in August 2026, including an autonomous claim-resubmission function that interprets payer responses and resubmits eligible claims. The launch showed how established platforms are using automation to deepen their role in daily revenue-cycle work. Security and compliance expectations reinforce this position because customers need vendors that can support sensitive and high-volume financial processes.
Zelis acquired Rivet in January 2026 to add revenue-cycle analytics to its payment infrastructure. The company then launched ZAPP Edge, combining payment-network activity with claim-payment visibility and denial-trend information. Waystar's USD 1.25 billion acquisition of Iodine Software expanded its clinical documentation AI and utilization-management capabilities[4]. These moves show that leading suppliers are adding data, analytics, and automation capabilities around their transaction systems. This strategy supports broader platform roles instead of narrow per-transaction offerings and can contribute to growth in the healthcare fintech market size. It also increases pressure on specialist vendors to differentiate through easier deployment or a focused workflow advantage.
Opportunities remain in embedded financing within electronic health record billing workflows and in international business-to-business payment infrastructure. Providers often cannot access financing choices directly within the clinical encounter interface, leaving a gap between care delivery and financial decision-making. Outside North America, some markets lack the clearinghouse and remittance infrastructure found in the United States. Cedar, Phreesia, and Flywire compete through patient-experience and payment-facilitation tools designed around newer software models. Phreesia reported USD 1.626 billion in managed payments during the second quarter of 2026, illustrating the transaction opportunity available as the healthcare fintech market expands.
Healthcare Fintech Industry Leaders
-
Optum
-
Zelis
-
Availity
-
Flywire
-
InstaMed
- *Disclaimer: Major Players sorted in no particular order
Healthcare Fintech Market Companies Covered in this Report
- Optum
- Zelis
- Availity
- Flywire
- InstaMed
- Rectangle Health
- Waystar
- Experian Health
- R1 RCM
- athenahealth
- FinThrive
- Cedar
- Phreesia
- RevSpring
- HealthEquity
- CareCredit
- PayZen
- AccessOne
- CarePayment
- PatientFi
Recent Industry Developments in Healthcare Fintech Market
- August 2026: Waystar launched AltitudeAI-powered agentic capabilities, including the industry’s first autonomous claim resubmission system that interprets payer responses, applies payer-specific rules, and resubmits eligible claims without human intervention, targeting acceleration of provider accounts receivable performance.
- August 2026: Cedar launched the Kora Platform, an agentic AI suite replacing its single billing agent with a multi-agent system for patient revenue recovery, cost-to-collect reduction, and financial assistance, drawing on 1.5 billion patient interactions and USD 13.6 billion in historically processed payments.
- April 2026: Waystar launched an AI-powered recoupment solution designed to identify and recover lost provider revenue from payer post-payment adjustments, addressing a previously under-automated segment of the revenue cycle.
- January 2026: Zelis acquired Rivet, a revenue-cycle analytics platform, to integrate AI-enabled claim-payment and denial-trend analytics into its payer payment infrastructure.
Global Healthcare Fintech Market Report Scope
The global healthcare fintech market comprises technology-enabled financial products and services that support the flow, management, and financing of money across the healthcare ecosystem, including digital patient payments, medical billing and claims processing, revenue-cycle management, payment integrity, healthcare lending and patient financing, healthcare savings accounts, insurance-related financial transactions, and automated payment and reimbursement solutions. These technologies connect patients, healthcare providers, insurers, employers, and financial institutions to make healthcare transactions faster, more transparent, secure, and efficient while reducing administrative costs and improving access to healthcare financing.
The Healthcare FinTech Market is Segmented by Function (Consumer-Directed Health Account Administration, Healthcare Consumer Financing, and More), Economic Buyer (Healthcare Providers, and More), Channel (Direct Enterprise, Bank/Issuer Partner, TPA/Broker, Embedded/API/OEM), and Geography (North America, South America, Europe, Asia-Pacific, Middle East and Africa). The Market Forecasts are Provided in Terms of Value (USD).
Segmentation Overview
| Consumer-Directed Health Account Administration |
| Healthcare Consumer Financing |
| Patient Payments and Healthcare Payment Facilitation |
| Claims, Eligibility and Remittance Rails |
| Healthcare B2B Payments and Provider AP |
| Healthcare Providers |
| Healthcare Payers |
| Employers and Plan Sponsors |
| Patients and Individual Consumers |
| Direct Enterprise |
| Bank/Issuer Partner |
| TPA/Broker/Benefits Consultant |
| Embedded/API/OEM |
| North America | United States |
| Canada | |
| Mexico | |
| South America | Brazil |
| Argentina | |
| Rest of South America | |
| Europe | United Kingdom |
| Germany | |
| France | |
| Italy | |
| Spain | |
| Rest of Europe | |
| Asia-Pacific | China |
| Japan | |
| India | |
| South Korea | |
| Australia | |
| Indonesia | |
| Thailand | |
| Malaysia | |
| Singapore | |
| Vietnam | |
| Rest of Asia-Pacific | |
| Middle East and Africa | Saudi Arabia |
| United Arab Emirates | |
| Turkey | |
| South Africa | |
| Egypt | |
| Rest of Middle East and Africa |
| By Function | Consumer-Directed Health Account Administration | |
| Healthcare Consumer Financing | ||
| Patient Payments and Healthcare Payment Facilitation | ||
| Claims, Eligibility and Remittance Rails | ||
| Healthcare B2B Payments and Provider AP | ||
| By Economic Buyer | Healthcare Providers | |
| Healthcare Payers | ||
| Employers and Plan Sponsors | ||
| Patients and Individual Consumers | ||
| By Channel | Direct Enterprise | |
| Bank/Issuer Partner | ||
| TPA/Broker/Benefits Consultant | ||
| Embedded/API/OEM | ||
| By Geography | North America | United States |
| Canada | ||
| Mexico | ||
| South America | Brazil | |
| Argentina | ||
| Rest of South America | ||
| Europe | United Kingdom | |
| Germany | ||
| France | ||
| Italy | ||
| Spain | ||
| Rest of Europe | ||
| Asia-Pacific | China | |
| Japan | ||
| India | ||
| South Korea | ||
| Australia | ||
| Indonesia | ||
| Thailand | ||
| Malaysia | ||
| Singapore | ||
| Vietnam | ||
| Rest of Asia-Pacific | ||
| Middle East and Africa | Saudi Arabia | |
| United Arab Emirates | ||
| Turkey | ||
| South Africa | ||
| Egypt | ||
| Rest of Middle East and Africa | ||
Key Questions Answered in the Report
What is the forecast growth rate for healthcare fintech through 2031?
The sector is forecast to grow at a 10.2% CAGR from 2026 to 2031, reaching USD 40.3 billion by 2031 as healthcare financial workflows become more digital.
What is driving adoption of healthcare financial technology?
Higher patient deductibles, complex reimbursement processes, and wider use of digital payment tools are supporting adoption across provider, payer, and patient interactions.
Which healthcare fintech function is growing fastest?
Healthcare B2B Payments and Provider AP is projected to grow at a 14.4% CAGR through 2031, supported by the need to automate payment reconciliation.
Who is the largest buyer of these solutions?
Healthcare Providers held 42.3% of the economic-buyer mix in 2025 because they manage complex reimbursement, billing, collections, vendor payments, and other financial flows.
Why are embedded payment tools gaining importance in healthcare?
Embedded/API/OEM integration is projected to grow at a 16.2% CAGR because it places payments and financing within software workflows already used by providers and patients.
Which region is growing fastest for healthcare financial technology?
Asia-Pacific is forecast to grow at a 14.7% CAGR through 2031, supported by expanding digital health infrastructure and real-time payment capabilities in key markets.