Domestic Tourism Market Size and Share
Market Overview
| Study Period | 2022 - 2031 |
|---|---|
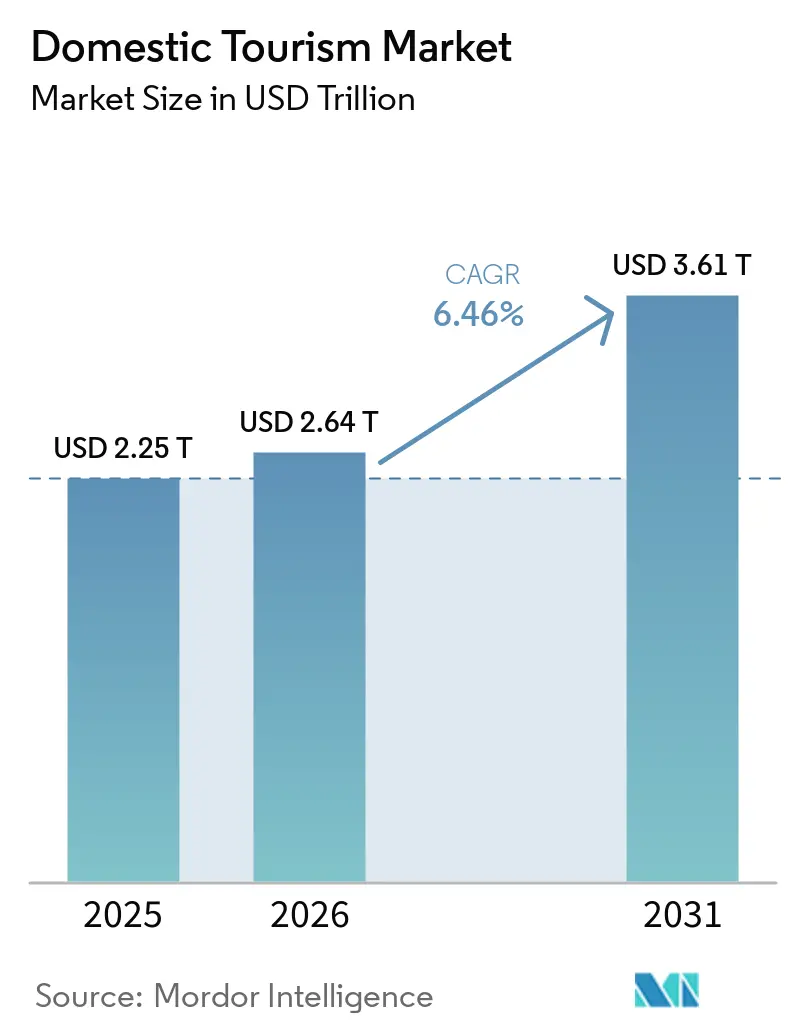
| Market Size (2026) | USD 2.64 Trillion |
| Market Size (2031) | USD 3.61 Trillion |
| Growth Rate (2026 - 2031) | 6.46% CAGR |
| Fastest Growing Market | Asia-Pacific |
| Largest Market | North America |
| Market Concentration | Low |
Major Players *Disclaimer: Major Players sorted in no particular order Image © Mordor Intelligence. Reuse requires attribution under CC BY 4.0. | |
Domestic Tourism Market Analysis by Mordor Intelligence
The Domestic Tourism Market size was valued at USD 2.25 trillion in 2025 and is estimated to grow from USD 2.64 trillion in 2026 to reach USD 3.61 trillion by 2031, at a CAGR of 6.46% during the forecast period (2026-2031).
The domestic tourism market remains the base layer of travel demand, as global domestic tourist trips reached 14.41 billion in 2025, indicating that local and national travel still account for the largest share of tourism activity across most economies[1]WTCF.ORG.CN https://en.wtcf.org.cn/20260323/4f2fbc27-8bbe-702f-4124-895fb89effe4.html. This level of demand is evident across major travel systems, including China, with 6.52 billion domestic trips in 2025, and the European Union, with 850 million domestic trips in 2024[2]EUROPA.EU https://ec.europa.eu/eurostat/web/products-eurostat-news/w/ddn-20251010-3. The domestic tourism market is also being supported by steady public promotion of local travel, stronger domestic connectivity, and a wider spread of leisure spending beyond the largest gateway cities. At the same time, the domestic tourism market is seeing faster digital adoption in trip discovery and booking flows, while regulation around accommodation supply and ongoing cost pressure are shaping how demand converts into completed trips. Competitive conditions remain highly fragmented, leaving room for large platforms, hotel groups, and local operators to continue expanding through product depth, loyalty, and greater control over the traveler journey in the domestic tourism market.
Key Report Takeaways
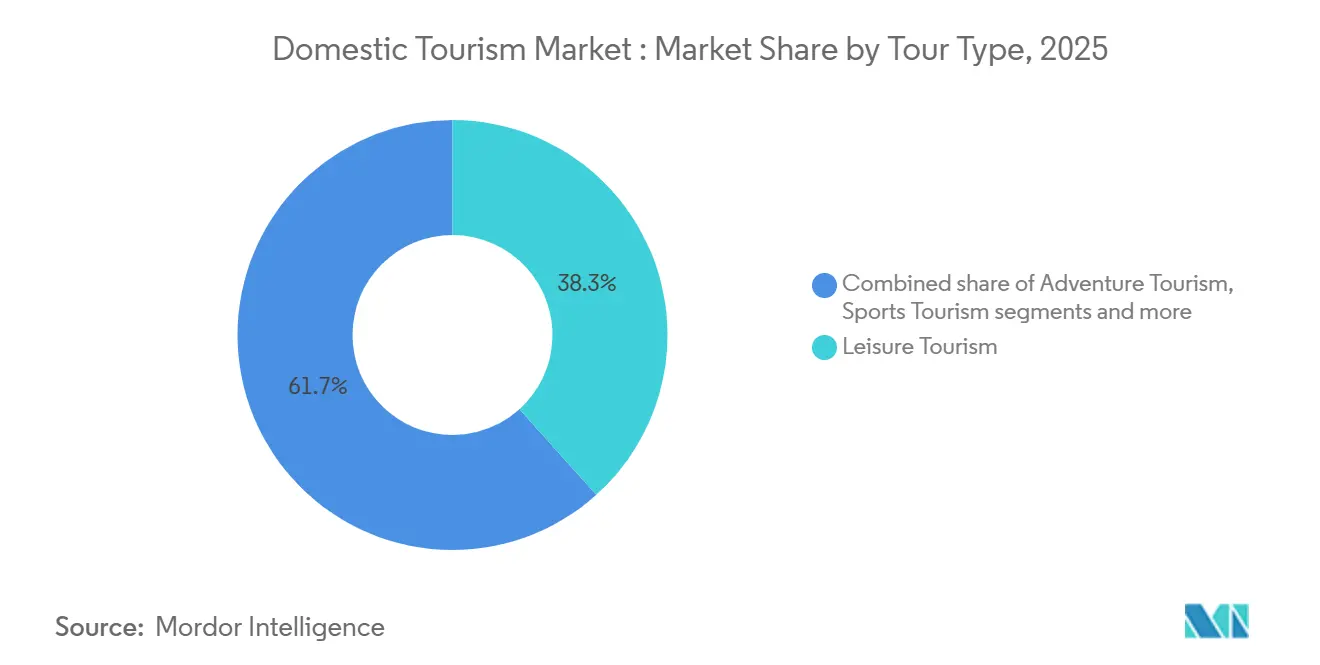
- By tour type, leisure tourism held 38.3% of the domestic tourism market share in 2025, while sports tourism is forecast to expand at a 10.5% to 12% CAGR through 2031.
- By tourism type, local travel held 55.9% of the domestic tourism market share in 2025, while interstate travel is projected to record the highest CAGR of 9.5% to 11% through 2031.
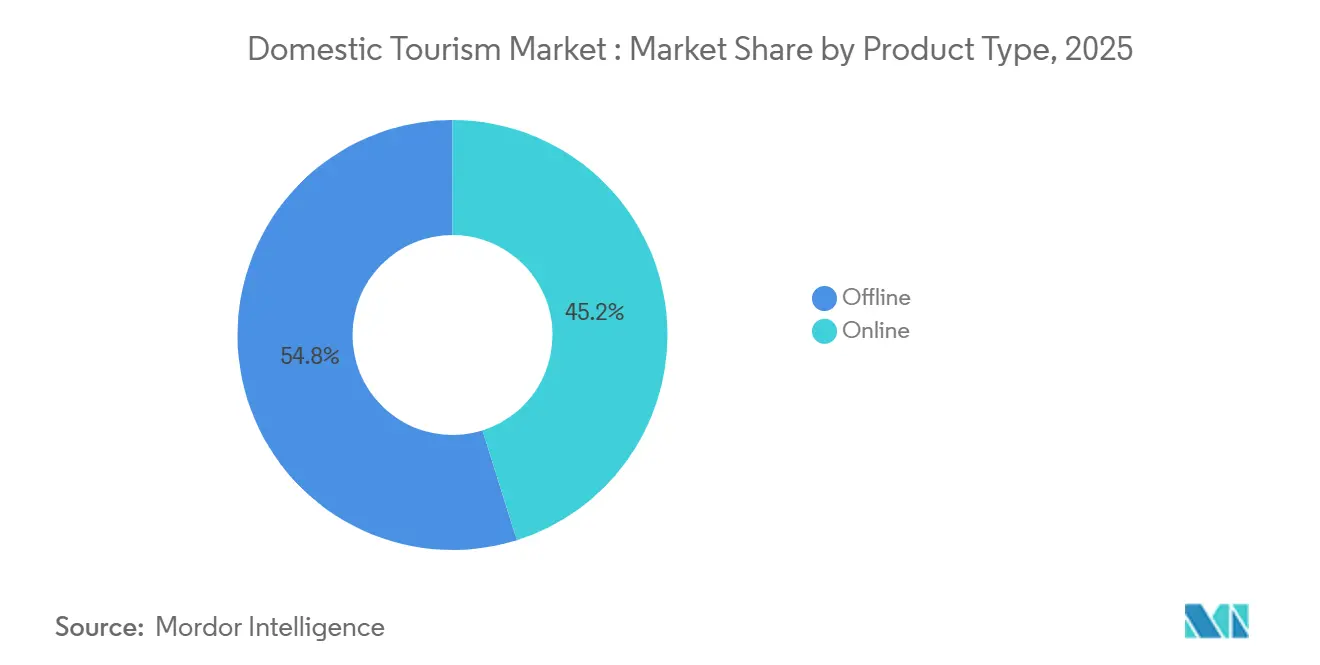
- By mode of booking, offline bookings held 54.8% of the domestic tourism market share in 2025, while online bookings are forecast to grow at a 11% to 13% CAGR through 2031.
- By demographics, group travelers held 58.1% of the domestic tourism market share in 2025, while solo travelers are projected to expand at a 10% to 11.5% CAGR through 2031.
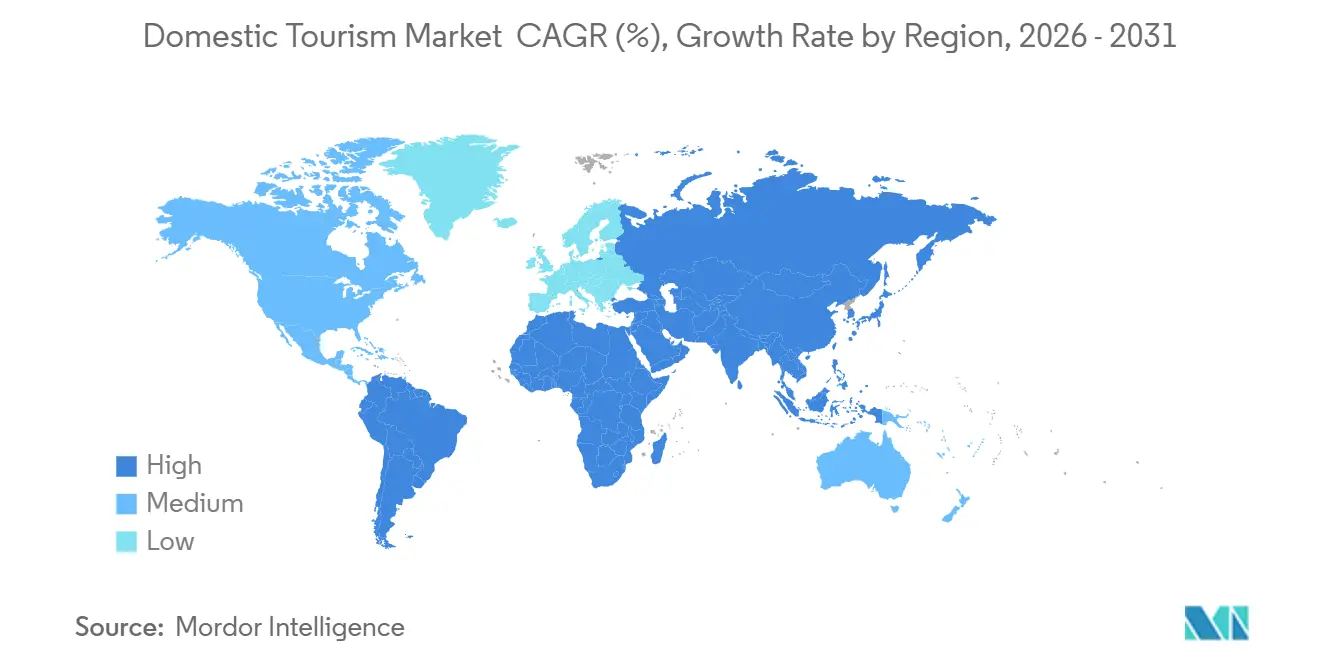
- By geography, North America held 30.8% of the domestic tourism market share in 2025, while the Asia-Pacific is forecast to record the fastest regional CAGR of 10.5% to 12.5% through 2031.
- By company, Booking Holdings led the competitive field with an estimated 1.3% share in 2025, while the top 5 players together accounted for an estimated 4.3%.
Note: Market size and forecast figures in this report are generated using Mordor Intelligence’s proprietary estimation framework, updated with the latest available data and insights as of January 2026.
Global Domestic Tourism Market Trends and Insights
Drivers Impact Analysis*
| Driver | (~) % Impact on CAGR Forecast | Geographic Relevance | Impact Timeline |
|---|---|---|---|
| Local Tourism Stimulus and Destination Marketing | +1.0% | Global, with concentrated gains in Asia-Pacific, the Middle East, and South America | Medium term (2-4 years) |
| Digital Booking and AI Trip Planning Adoption | +1.2% | North America, Europe, and Asia-Pacific, with spillover into the Middle East and Africa, and South America | Short term (≤ 2 years) |
| Rise Of Experiential and Regional Travel | +0.8% | Global, with strong gains in Asia-Pacific secondary cities and North America lifestyle markets | Medium term (2-4 years) |
| Middle Class Expansion and Affordable Transport Access | +1.1% | Asia-Pacific, the Middle East, and South America | Long term (≥ 4 years) |
| Night Time Economy Monetizing City Breaks | +0.5% | North America, Europe, and the Asia-Pacific urban centers | Medium term (2-4 years) |
| Wallet-Based Digital Identity Reducing Booking Friction | +0.4% | Europe, North America, and digital-first Asia-Pacific markets | Short term (≤ 2 years) |
| Source: Mordor Intelligence | |||
Middle-Class Expansion and Affordable Transport Access
Middle-income expansion and easier transport access continue to widen the base of first-time leisure travelers across the domestic tourism market. China recorded 6.52 billion domestic trips in 2025, up 16.2%, and domestic tourism spending reached CNY 6.30 trillion, indicating that income growth is translating into broad-based travel activity rather than just premium urban demand. The same pattern is evident in the rise in rural travel participation, with rural tourism expenditure in China increasing by 21.4% and rural domestic trip volumes rising by 22.6% in 2025. Affordable seat supply is also extending the range of travel within national borders, and ALTA reported 477.3 million air passengers across Latin America and the Caribbean in 2025, with 84% of net growth coming from intra-regional movements[3]ALA.AERO https://ala.aero/es/2026/02/trafico-aereo-en-america-latina-y-el-caribe-crecio-38-interanual-en-2025. That transport expansion matters for the domestic tourism market because it supports longer local journeys, brings more secondary cities into the formal travel economy, and improves access for travelers who were previously limited to short-distance trips. As a result, the domestic tourism market is deepening not only from higher incomes but also from improved practical mobility across road and air networks.
Digital Booking and AI Trip Planning Adoption
Digital adoption is reshaping how travelers search, compare, and complete purchases in the domestic tourism market. Company platforms are moving beyond simple online reservation tools and are building broader trip systems that combine discovery, inventory, loyalty, and post-booking support. Expedia Group’s 2026 product rollout clearly shows this shift, with new AI experiences, a Model Context Protocol server for partners, and ecosystem partnerships intended to connect inspiration, booking, and mobility in a single flow[4]EXPEDIA.COM https://www.expedia.com/newsroom/expedia-group-unveils-new-ai-experiences-expands-travel-ecosystem-and-launches-philanthropy-program-at-explore-2026/. The booking process is also becoming less manual, and the Amadeus and Lufthansa test of the EU Digital Identity Wallet points to faster identity verification and simpler check-in and travel workflows. These changes matter to the domestic tourism market because they reduce friction, improve repeat booking behavior, and make digital channels more attractive across age groups and trip types. The domestic tourism market is therefore shifting toward a structure in which online channels capture a larger share of the traveler journey, even as offline booking still holds the current larger share.
Rise of Experiential and Regional Travel
Experiential and regional travel is changing how spending flows across the domestic tourism market. WTCF identified deep local exploration and IP-led experiential consumption as major urban tourism themes shaping 2026, supporting the shift from standard city breaks toward more specific, place-based travel choices. That shift is also visible in Europe, where 92% of EU residents’ trips in 2024 stayed within the EU, and domestic trips alone reached 850 million. Sports travel has become one of the clearest high-value examples, and Sports ETA reported that sports tourism in the United States generated USD 111.2 billion in direct spending and 124.3 million hotel room nights in 2025. The same report showed that participatory sports generated a larger economic impact than spectator travel, which suggests that local event infrastructure and family travel around amateur competition now play a larger role in the domestic tourism market than many premium event models do. Wellness-linked trips are moving in a similar direction, as the Global Wellness Institute reported 13.8% growth in wellness tourism spending from 2023 to 2024, indicating that health-oriented domestic travel is becoming more mainstream in trip planning.
Local-Tourism Stimulus and Destination Marketing
Public sector destination promotion remains an important demand lever for the domestic tourism market. Brazil’s Ministry of Tourism reported that domestic aviation carried 101.2 million passengers in 2025, up 8.4% from 2024, indicating that local demand can respond strongly when connectivity and promotional support move in tandem. WTCF also ranked Western Asia among the fastest-growing tourism regions, aligning with the policy push toward domestic leisure infrastructure in Gulf markets. What matters in the domestic tourism market is not only the headline rise in trips, but also the spread of demand into secondary cities and regional destinations that were historically less visible in formal tourism promotion. This pattern gives suppliers more room to widen inventory, diversify packages, and reduce pressure on already crowded gateway cities. The domestic tourism market, therefore, benefits when public campaigns are paired with practical improvements in domestic access and local destination readiness.
Restraints Impact Analysis*
| Restraint | (~) % Impact on CAGR Forecast | Geographic Relevance | Impact Timeline |
|---|---|---|---|
| Inflation and Value for Money Pressure | -1.2% | Global, with the sharpest pressure in Europe and North America | Medium term (2-4 years) |
| Connectivity Gaps and Seasonality in Secondary Destinations | -0.6% | South America, Africa, and parts of South and Southeast Asia | Long term (≥ 4 years) |
| Short-Term Rental Restrictions Tightening Peak Stay Supply | -0.4% | Europe, select North American cities, and parts of the Asia-Pacific | Medium term (2-4 years) |
| Tariff-Driven Cost Inflation Across Tourism Supply Chains | -0.8% | North America, Europe, and the Asia-Pacific have wider global supply exposure | Short term (≤ 2 years) |
| Source: Mordor Intelligence | |||
Inflation and Value-for-Money Pressure
Inflation remains one of the clearest limits on demand conversion in the domestic tourism market. Ireland’s Central Statistics Office reported that domestic overnight trips fell 8% in 2025 from 2024, while outbound travel by Irish residents rose 11%, suggesting a clear shift in value perception when domestic trips feel more expensive than nearby alternatives. Germany also showed a more subdued pattern, with domestic guest overnights rising only 0.7% to 413.7 million in 2025, even though total guest overnights reached a record level. In the United States, domestic visitor spending still reached USD 1.54 trillion in 2025. Still, growth slowed to 0.3%, suggesting that even a large and resilient market can face spending fatigue when costs remain elevated. This pressure tends to weigh most heavily on the middle of the market, where travelers are more price sensitive, and operators have less room to raise rates without affecting volume. The domestic tourism market can still grow under these conditions, but it becomes harder for providers to maintain margins and for destinations to preserve a strong value-for-money image.
Short-Term Rental Restrictions Tightening Peak-Stay Supply
Tighter accommodation regulations are creating a supply issue for parts of the domestic tourism market, especially in peak-season destinations. The direct effect is fewer flexible lodging options in high-demand city centers and leisure zones, which can raise booking friction for families, groups, and short-stay travelers. This matters most where traditional hotel supply is not expanding fast enough to absorb displaced demand. The result is a more visible mismatch between strong travel intent and practical room availability at popular domestic destinations. That mismatch can reduce conversion at the point of booking and push travelers toward lower-frequency or shorter-stay options in the domestic tourism market. The domestic tourism market is therefore facing a structural issue in which accommodation policy and capacity are moving out of step in some mature urban destinations.
*Our forecasts treat driver/restraint impacts as directional, not additive. The impact forecasts reflect baseline growth, mix effects, and variable interactions.
Segment Analysis
By Tour Type: Leisure Holds the Largest Base While Sports Leads Growth
Leisure tourism accounted for 38.3% of the domestic tourism market in 2025, making it the largest tour type by both value and trip volume. Leisure spending remains broad, encompassing holidays, weekend trips, family breaks, and a wide range of mainstream domestic travel occasions that recover quickly when household confidence improves. This large base provides the domestic tourism market with a stable core, especially in countries where short- and mid-length leisure trips are deeply embedded in annual spending patterns. The same large base also means leisure travel continues to shape occupancy, transport demand, and seasonal peaks across the domestic tourism market.
Sports tourism is growing faster, with a projected CAGR of 10.5% to 12% in the domestic tourism market through 2031. Sports ETA reported that 339 million sports travelers generated USD 111.2 billion in direct spending and 124.3 million hotel room nights in the United States in 2025, which shows how large this segment has become in a mature travel system. Participatory sports travel plays a central role because family movement around youth and amateur events creates repeat demand across accommodation, food service, local transport, and attractions. Wellness tourism is also rising within the domestic tourism industry, supported by stronger health and self-care spending and by the Global Wellness Institute’s report of 13.8% growth in wellness tourism spending from 2023 to 2024. Adventure tourism, spiritual and cultural tourism, and the other group of eco- and nature-based travel and visiting friends and relatives continue to serve different needs, while business and MICE travel is still adjusting more slowly because hybrid formats and tighter travel controls continue to limit a full return to earlier domestic corporate travel patterns.


By Tourism Type: Local Travel Leads While Interstate Travel Expands Faster
Local travel accounted for 55.9% of the domestic tourism market share in 2025, reflecting the central role of short-distance trips, day outings, and nearby overnight breaks in total domestic travel. This base remains important because local travel is less exposed to transport cost shocks and is easier to fit into household budgets and time constraints. The domestic tourism market, therefore, continues to rely heavily on nearby travel demand for resilience during periods of economic uncertainty. Local trips also support a wide network of smaller businesses, including regional hotels, restaurants, attractions, and transport operators.
Interstate travel is the faster-growing side of the domestic tourism market, with a projected CAGR of 9.5% to 11% through 2031. China offers the clearest evidence of this widening travel radius, with 6.52 billion domestic trips in 2025, up 16.2%, and rural trip volumes rising 22.6%, indicating that more first-time and budget-conscious travelers are moving farther within the country. Latin America is showing a similar transport-led shift, and ALTA reported that Argentina’s domestic air passenger volumes rose 9.1% to 17.4 million in 2025, while Brazil’s domestic aviation carried 101.2 million passengers. As connectivity improves, the domestic tourism market sees more multi-city and longer-stay trips, which lift spending per traveler and increase the relevance of air and road corridors linking secondary destinations. The domestic tourism industry is therefore seeing interstate travel evolve from a narrower premium pattern into a broader middle-income behavior.
By Mode of Booking: Offline Leadership is Intact, but Online Migration is Stronger
Offline booking accounted for 54.8% of the domestic tourism market in 2025, indicating that the market still depends heavily on traditional agencies, direct hotel calls, counters, and relationship-led booking behavior. This is especially true in lower-income markets, in older traveler groups, and in trip types where trust, customization, or cash-based payment still matter. Offline channels also remain relevant in parts of the domestic tourism market where supply is fragmented, and many small providers are not fully digitized. As a result, the shift away from offline booking is real, but it is not happening at the same speed in every country or customer group.
Online booking is the fastest-growing side of the domestic tourism market, with a forecast CAGR of 11% to 13% through 2031. Platform investment is reinforcing that direction, and Expedia Group’s 2026 updates show a clear effort to connect AI trip planning, partner access, and post-booking services in a more unified digital flow. The Amadeus and Lufthansa work on the EU Digital Identity Wallet also supports smoother digital transactions, because identity credentials can simplify steps that often slow down completion. Even so, the domestic tourism market is not moving toward a single-channel outcome, because supplier-direct digital investment is rising even as large intermediaries are expanding. This means the online share of the domestic tourism market will continue to grow. Still, the balance within that online share will remain competitive as brands, hotels, and platforms all try to own a larger share of the customer relationship.
By Demographics: Group Travel Dominates While Solo Travel Moves into the Mainstream
Group travelers accounted for 58.1% of the domestic tourism market in 2025, which reflects the ongoing strength of family trips, multi-generational travel, and friend-group vacations. This pattern is important because domestic travel often follows school calendars, holiday windows, and event schedules that naturally favor group movement. Group demand also supports packaged travel, larger room formats, and bundled spending across food, mobility, and attractions. For the domestic tourism market, group travel is the most stable demographic base in terms of revenue.
Solo travelers are projected to grow at 10% to 11.5% CAGR through 2031, making them the fastest-rising demographic segment in the domestic tourism market. This rise is tied to delayed household formation, stronger financial independence among younger adults and women, and wider acceptance of independent travel planning. The commercial gap is that many domestic products are still designed around shared rooms and group-based packages, which can make solo travel less convenient and less price-competitive. Operators that simplify single-person pricing, offer shorter itineraries, and provide flexible activity design are likely to gain from this shift in the domestic tourism market. The domestic tourism industry is therefore moving toward a more diverse demographic structure, with group travel remaining larger. Still, solo travel becomes more visible in high-frequency and experience-led categories.
Geography Analysis
North America held 30.8% of the domestic tourism market share in 2025, making it the largest regional contributor by value. The United States remained the center of that position, with domestic visitor spending reaching USD 1.54 trillion in 2025, which was 14.3% above pre-pandemic levels. Growth in the United States slowed to 0.3%, suggesting a more mature phase of demand, even though overall spending remains very large. Sports travel strengthens the regional base of the domestic tourism market, as Sports ETA reported a total economic impact of USD 274.5 billion for U.S. sports tourism in 2025.
Asia-Pacific is the fastest-growing regional segment of the domestic tourism market, with a forecast CAGR of 10.5% to 12.5% through 2031. China is the main engine, and official 2025 data showed 6.52 billion domestic trips and CNY 6.30 trillion in domestic tourism spending. WTTC also projected China’s domestic spending to reach CNY 7 trillion in 2026, reinforcing the scale of that national market within the broader domestic tourism market. Indonesia adds to the region’s momentum, with WTTC reporting domestic tourism spending of IDR 381.4 trillion in 2025. The domestic tourism market in Asia-Pacific is also benefiting from rising middle-income demand, broadening air and road connectivity, and a larger pipeline of regional destinations that can absorb incremental leisure spending.
Europe remains a major part of the domestic tourism market due to its large resident travel base and dense transport networks. Eurostat reported 850 million domestic trips by EU residents in 2024, with total spending of USD 302.54 billion (EUR 257.2 billion) on accommodation and transport. Germany set a new record with 497.5 million guest overnights in 2025, including 413.7 million domestic guest overnights, but domestic growth was only 0.7%, which shows a slower expansion profile than Asia-Pacific. South America is showing firmer momentum, led by Brazil, where tourism activity rose 4.6% in 2025, and domestic aviation reached 101.2 million passengers. The Middle East and Africa remain important long-term opportunity areas for the domestic tourism market, especially where state-backed leisure investment and better transport connections can convert large local populations into more frequent formal travel demand.

Competitive Landscape
The domestic tourism market remains highly fragmented because spending is spread across OTAs, hotel groups, short-stay platforms, transport providers, attractions, and a very large base of local operators. That structure limits the share any single company can hold across the full domestic tourism market, even when individual brands are very large in their own channels. Based on the supplied company share estimates, the top 5 players together held only 4.3% of the domestic tourism market in 2025, with Booking Holdings at 1.3%, Marriott International at 1.3%, and Airbnb at 0.6%. Booking Holdings’ FY2025 disclosures still show significant scale, with USD 186.1 billion in gross bookings, confirming its importance in digital travel distribution even in a fragmented market. Marriott International’s FY2025 annual report also points to a large accommodation footprint and strong revenue scale, which helps explain why large hotel brands retain influence within the domestic tourism market even without dominating it outright.
Competitive strategy in the domestic tourism market is increasingly centered on owning more parts of the traveler journey. Expedia Group gave a clear example in 2026 when it introduced new AI experiences, a Model Context Protocol server for partners, and a wider ecosystem approach tied to discovery and mobility. Amadeus and Lufthansa offered another example through their EU Digital Identity Wallet test, which points to a booking and check-in process that is more integrated and less manual. Airbnb’s FY2025 filing also showed the scale of its gross booking value at USD 91.3 billion, underscoring its continued importance in the alternative accommodation and short-stay segments of the domestic tourism market.
The main white space in the domestic tourism market lies in formalizing secondary-city travel, improving digital packaging, and strengthening repeat use through loyalty and simpler planning tools. Many unaffiliated domestic travelers still book parts of their trips separately, which means platforms and hotel groups can gain share by reducing search time and combining transport, stay, and activity options more effectively. The domestic tourism market also leaves room for regional players that understand local inventory better than global brands do, especially in countries where informal supply remains high. At the same time, compliance is becoming increasingly relevant as digital identity, platform accountability, and local accommodation rules shape how suppliers operate and how travelers complete bookings. The competitive picture in the domestic tourism market is therefore unlikely to consolidate quickly. However, the strongest brands can still improve their position by building broader service ecosystems and making travel flows easier to complete.
Domestic Tourism Industry Leaders
Booking Holdings Inc.
Marriott International, Inc.
Expedia Group, Inc.
Airbnb, Inc.
Hilton Worldwide Holdings Inc.
- *Disclaimer: Major Players sorted in no particular order

Recent Industry Developments
- May 2026: Expedia Group unveiled an AI toolkit and Model Context Protocol (MCP) server for B2B partners at its Explore 26 conference in Las Vegas, enabling AI agents to connect directly to Expedia's travel inventory. This follows partnerships announced with Meta and Uber, which bring in-feed trip planning and in-app ride booking to Expedia's traveler ecosystem.
- April 2026: Sports ETA released the 2026 State of the Industry Report, defining U.S. sports tourism as a USD 274.5 billion total economic impact activity and confirming USD 111.2 billion in direct spending and 124.3 million hotel room nights in 2025.
- February 2026: Destatis reported a new record for guest overnights in Germany in 2025, with domestic guests accounting for 413.7 million overnights and total overnights reaching 497.5 million.


Global Domestic Tourism Market Report Scope
| Leisure Tourism |
| Adventure Tourism |
| Sports Tourism |
| Wellness Tourism |
| Business / MICE Tourism |
| Spiritual and Cultural Tourism |
| Other (Eco & Nature Tourism,Visiting Friends & Relatives (VFR)) |
| Local Travel |
| Interstate Travel |
| Online |
| Offline |
| Solo Travelers |
| Group Travelers |
| North America | United States |
| Canada | |
| Mexico | |
| South America | Brazil |
| Peru | |
| Chile | |
| Argentina | |
| Rest of South America | |
| Europe | United Kingdom |
| Germany | |
| France | |
| Spain | |
| Italy | |
| BENELUX (Belgium, Netherlands, and Luxembourg) | |
| NORDICS (Denmark, Finland, Iceland, Norway, and Sweden) | |
| Rest of Europe | |
| Asia-Pacific | India |
| China | |
| Japan | |
| Australia | |
| South Korea | |
| South East Asia (Singapore, Malaysia, Thailand, Indonesia, Vietnam, and Philippines) | |
| Rest of Asia-Pacific | |
| Middle East and Africa | United Arab Emirates |
| Saudi Arabia | |
| South Africa | |
| Nigeria | |
| Rest of Middle East And Africa |
| By Tour Type | Leisure Tourism | |
| Adventure Tourism | ||
| Sports Tourism | ||
| Wellness Tourism | ||
| Business / MICE Tourism | ||
| Spiritual and Cultural Tourism | ||
| Other (Eco & Nature Tourism,Visiting Friends & Relatives (VFR)) | ||
| By Tourism Type | Local Travel | |
| Interstate Travel | ||
| By Mode of Booking | Online | |
| Offline | ||
| By Demographics | Solo Travelers | |
| Group Travelers | ||
| By Geography | North America | United States |
| Canada | ||
| Mexico | ||
| South America | Brazil | |
| Peru | ||
| Chile | ||
| Argentina | ||
| Rest of South America | ||
| Europe | United Kingdom | |
| Germany | ||
| France | ||
| Spain | ||
| Italy | ||
| BENELUX (Belgium, Netherlands, and Luxembourg) | ||
| NORDICS (Denmark, Finland, Iceland, Norway, and Sweden) | ||
| Rest of Europe | ||
| Asia-Pacific | India | |
| China | ||
| Japan | ||
| Australia | ||
| South Korea | ||
| South East Asia (Singapore, Malaysia, Thailand, Indonesia, Vietnam, and Philippines) | ||
| Rest of Asia-Pacific | ||
| Middle East and Africa | United Arab Emirates | |
| Saudi Arabia | ||
| South Africa | ||
| Nigeria | ||
| Rest of Middle East And Africa | ||


Key Questions Answered in the Report
What is the 2026 value of the domestic tourism sector?
The domestic tourism market is valued at USD 2.64 trillion in 2026 and is forecast to reach USD 3.61 trillion by 2031 at a 6.5% CAGR.
Which region leads global domestic travel spending?
North America leads with a 30.8% share in 2025, supported mainly by the United States, where domestic visitor spending reached USD 1.54 trillion.
Which region is expanding the fastest through 2031?
Asia-Pacific is the fastest-growing region, with a projected CAGR of 10.5% to 12.5%, driven by China’s scale and rising domestic demand across the region.
Which travel type is growing fastest within the sector?
Sports tourism is the fastest-growing tour type, with a projected CAGR of 10.5% to 12% through 2031, while leisure remains the largest segment.
How are booking habits changing for domestic travelers?
Offline booking still leads with a 54.8% share in 2025, but online booking is growing faster, with a 11% to 13% CAGR as digital planning and booking tools improve.
Is the competitive landscape concentrated or fragmented?
It is highly fragmented, with the top 5 players accounting for only 4.3% of the market in 2025, leaving substantial room for both global brands and local specialists.
Page last updated on:


