
Child Enrichment Services Market Size and Share
Market Overview
| Study Period | 2022 - 2032 |
|---|---|
| Market Size (2027) | USD 37.51 Billion |
| Market Size (2032) | USD 57.01 Billion |
| Growth Rate (2027 - 2032) | 8.73 % |
| Fastest Growing Market | Asia-Pacific |
| Largest Market | North America |
| Market Concentration | Low |
Major Players *Disclaimer: Major Players sorted in no particular order Image © Mordor Intelligence. Reuse requires attribution under CC BY 4.0. | |
Child Enrichment Services Market Analysis by Mordor Intelligence
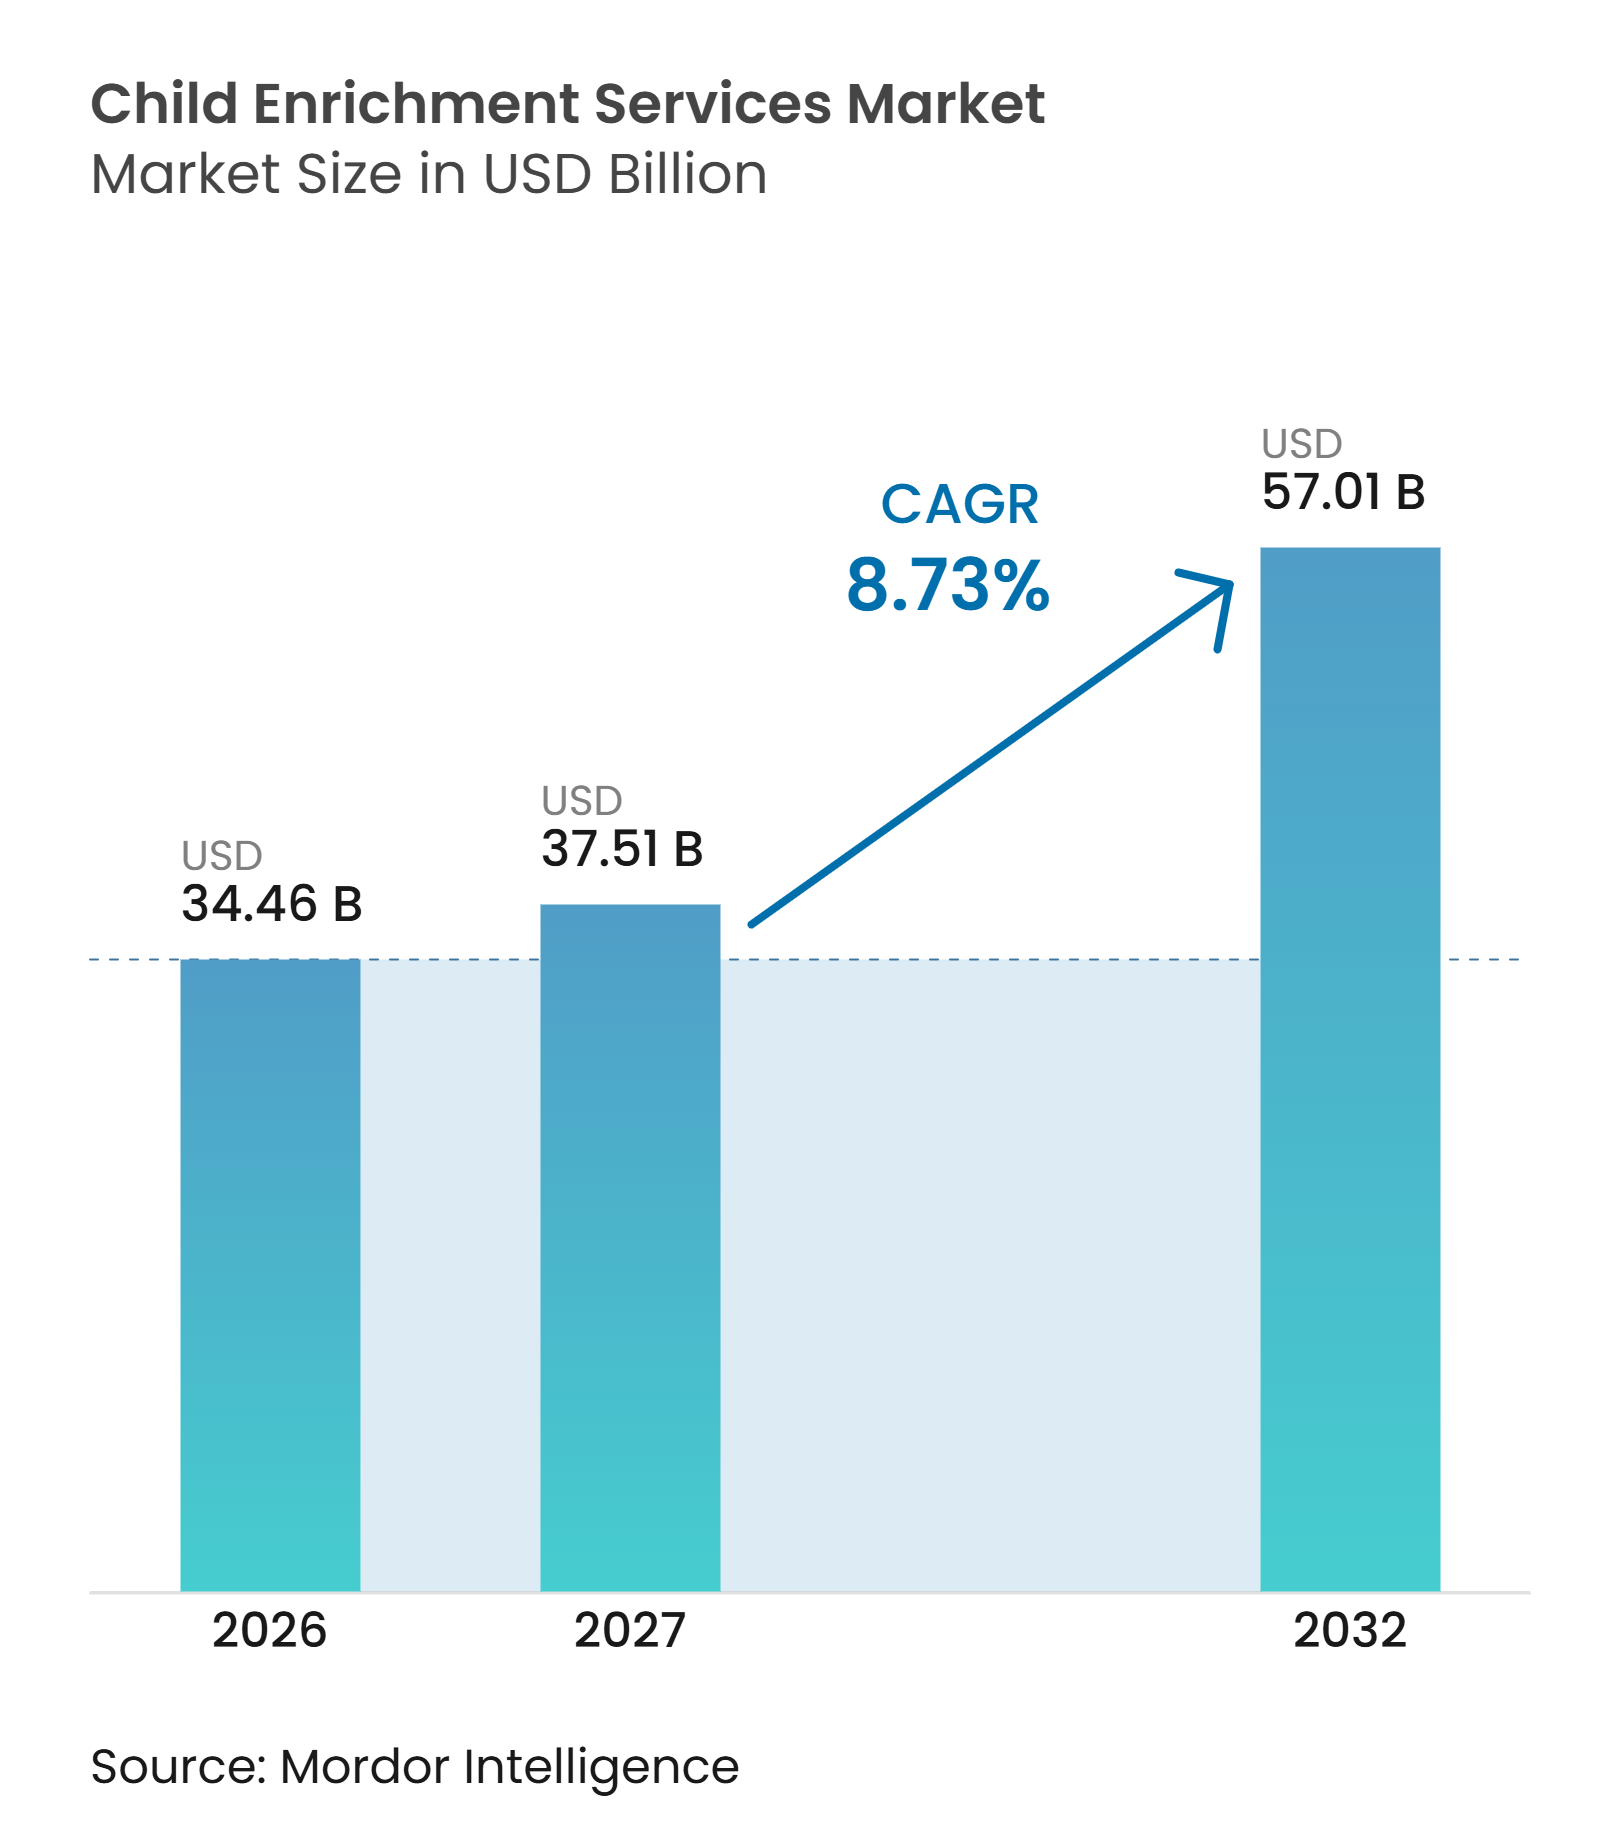
The global child enrichment services market size was valued at USD 34.46 billion in 2026 and is estimated to grow from USD 37.51 billion in 2027 to reach USD 57.01 billion by 2032, at a CAGR of 8.73% during the forecast period (2027-2032). The global child enrichment services market is supported by families that are increasingly seeking structured support outside formal schooling. Academic preparation, language learning, arts, and physical activities remain central to this demand. Digital access and hybrid formats are widening the reach of providers beyond established center networks. Employers are also treating childcare and related family benefits as part of workforce retention plans, which creates another access route for services. Providers that can show clear developmental progress, protect children’s data, and offer accessible pricing are better placed as purchasing decisions become more selective.
Key Report Takeaways
- By service type, academic tutoring and test preparation accounted for 36.40% of the global child enrichment services market in 2026, while languages and communication Skills are projected to grow at a 10.20% CAGR through 2032.
- By delivery mode, center-based services accounted for 38.90% of the global child enrichment services market in 2026, while online and app-based services are projected to grow at an 11.80% CAGR through 2032.
- By age group, primary school children aged 6-10 years accounted for 31.60% of the global child enrichment services market in 2026, while early childhood services for children aged 0-5 years are projected to grow at a 9.90% CAGR through 2032.
- By geography, North America accounted for 36.10% of the global child enrichment services market in 2026, while Asia-Pacific is projected to grow at a 10.50% CAGR through 2032.
Note: Market numbers in this report are based on Mordor Intelligence's proprietary estimation framework, which combines nine months of actuals with Q4 projections for base year 2026.
Market Trends and Insights
Drivers Impact Analysis of Child Enrichment Services Market*
| Driver | (~) % Impact on CAGR Forecast | Geographic Relevance | Impact Timeline |
|---|---|---|---|
| Parental Demand for Measurable Academic and Developmental Outcomes | +1.8% | Global, with peaks in North America, East Asia, and South Asia | Long term (≥ 4 years) |
| Expansion of Structured After-School Care and Enrichment Demand | +1.6% | North America, Europe, Australia, with spillover to Southeast Asia and the Middle East and Africa | Medium term (2-4 years) |
| Growth of Digital and Hybrid Enrichment Delivery | +1.4% | Global, strongest in North America, Asia-Pacific, and urban Middle East and North Africa | Medium term (2-4 years) |
| AI-Enabled Personalization of Child Learning Pathways | +1.2% | North America and Asia-Pacific, with early traction in Europe | Medium term (2-4 years) |
| Employer-Sponsored Childcare and Enrichment Benefits | +0.8% | North America and Western Europe | Short term (≤ 2 years) |
| Stackable Skills, Competitions, and Portfolio-Building Culture | +0.6% | East Asia, South Asia, and high-income North American suburbs | Medium term (2-4 years) |
| Source: Mordor Intelligence | |||
Parental Demand for Measurable Academic and Developmental Outcomes
Parents increasingly expect enrichment providers to demonstrate measurable progress rather than simply offer supervised activities. This expectation has shifted provider offerings toward reporting on confidence, study habits, social development, and academic outcomes. EdChoice reported that 19% of United States parents had a child receiving tutoring, while an additional 24% were seeking tutoring, indicating demand beyond current participation[1]. Manpower Demonstration Research Corporation (MDRC) found that high-dosage tutoring can add one to two months of learning, although outcomes depend on program design and delivery intensity. The global child enrichment services market therefore favors providers that can explain their program models and document children’s progress. Smaller providers may face higher assessment and reporting costs when competing with scaled networks that can standardize these capabilities.
Expansion of Structured After-School Care and Enrichment Demand
Dual-income households and longer workdays have increased the need for organized after-school care. In the United States, the Afterschool Alliance reported in 2025 that 53% of after-school programs maintained waitlists, indicating that available services did not meet all declared demand[2]. This shortage creates opportunities for providers to open centers, recruit staff, or integrate services with schools. Germany’s expansion of full-day schools also creates opportunities for arts, language, and sports services that complement public provision. The global child enrichment services market benefits when private operators align their offerings with school schedules rather than compete directly with them. Programs that provide reliable transportation, safe facilities, and clear operating hours can address practical barriers to family participation.
Growth of Digital and Hybrid Enrichment Delivery
Digital delivery enables providers to serve households beyond areas that can support a physical center. Online formats can reduce initial trial costs and offer families greater scheduling flexibility. LG Uplus reported that KidsTopia surpassed 2 million cumulative subscribers in 2025, while overseas users accounted for 67% of access[3]. These figures indicate the cross-border reach of the child-focused digital learning platform. However, the global child enrichment services market continues to depend on in-person interaction, as supervised social activities and parental trust are difficult to replicate online. Hybrid delivery models enable providers to combine live instruction with digital practice and progress tracking. This approach supports families seeking flexibility while retaining social interaction and safeguarding features of center-based programs.
AI-Enabled Personalization of Child Learning Pathways
Adaptive technology enables providers to tailor learning activities to children’s individual pace and performance. Singapore’s Ministry of Education confirmed in 2025 that its Student Learning Space uses Artificial Intelligence (AI)-enabled features to support upper-primary mathematics and language learning. In September 2025, Lingokids announced funding to expand generative AI content production while retaining educator-led curriculum development. These developments create opportunities for child enrichment providers to offer more responsive, varied digital learning experiences. However, human oversight, age-appropriate design, and transparent communication with parents remain essential to maintaining educational quality and trust.
Restraints Impact Analysis of Child Enrichment Services Market*
| Restraint | (~) % Impact on CAGR Forecast | Geographic Relevance | Impact Timeline |
|---|---|---|---|
| Household Affordability Sensitivity and Uneven Willingness to Pay | -1.5% | Global, most acute in South America, South Asia, and Sub-Saharan Africa | Long term (≥ 4 years) |
| Fragmented Quality Standards Across Providers and Jurisdictions | -0.8% | Global, particularly in markets without national enrichment licensing frameworks | Medium term (2-4 years) |
| Child Safeguarding, Data Privacy, and Consent Compliance Burden | -0.6% | North America and Europe, with emerging relevance in Asia-Pacific | Medium term (2-4 years) |
| Instructor Supply, Retention, and Utilization Mismatch | -0.5% | North America, Western Europe, and Australia | Short term (≤ 2 years) |
| Source: Mordor Intelligence | |||
Household Affordability Sensitivity and Uneven Willingness to Pay
Affordability remains a persistent constraint, as interest in enrichment services does not always result in paid enrollment. Lower-income households may prioritize essential expenses, even when parents value academic or developmental support. In South Korea, private education spending declined by 5.7% in 2025, while primary-school spending fell by 7.9%, after reaching KRW 29.2 trillion (USD 0.020 trillion) in 2024[4]. This trend shows how demographic changes and household budget pressures can occur simultaneously. Subscription, bundled, and freemium models may reduce entry barriers, but providers must still convert interest into sustained paid usage. The global child enrichment services market faces greater exposure in regions with limited disposable income and uneven access to public alternatives.
Fragmented Quality Standards Across Providers and Jurisdictions
Quality varies across independent providers, franchises, school partners, and digital platforms. This variation makes it difficult for parents to compare programs based on learning approaches, instructor qualifications, child safety practices, and intended outcomes. Fragmentation is particularly significant in regions without a national framework for private enrichment services, which can reduce trust in smaller providers despite strong local reputations. The global child enrichment services market has an incentive to adopt transparent curricula, outcome reporting, and recognized professional standards. Providers that clearly communicate staff screening processes, safeguarding policies, and learning methods are better positioned to retain families. Standardized practices can also help franchise operators maintain consistency as they expand into new locations.
*Our forecasts treat driver/restraint impacts as directional, not additive. The impact forecasts reflect baseline growth, mix effects, and variable interactions.
Consumer Preferences and Spending Patterns
Parents increasingly seek enrichment services that support academic progress, creativity, sports, and social development. The United States Census Bureau’s 2023 Survey of Income and Program Participation found that 38.4% of children aged 6-17 participated in sports, 26.8% took lessons, and 21.9% participated in clubs. Sports participation reached 44.8% among children in families earning at least 200% of the poverty threshold, compared with 22.7% among those below the threshold, highlighting affordability as a barrier to adoption. Providers can improve access through group classes, tiered pricing, school partnerships, and bundled academic and extracurricular programs. India’s Ministry of Statistics and Programme Implementation reported in its 2025 education survey that average household expenditure per student was INR 2,863 (USD 31.86) in government schools and INR 25,002 (USD 278.27) in non-government schools, while course fees averaged INR 7,111 (USD 79.14) across school types. In the United States, 26.8% of children aged 6-17 took lessons in 2023, indicating demand for structured extracurricular instruction. Providers can encourage repeat enrollment through term-based packages, sibling discounts, flexible schedules, and multi-activity bundles.
Service Market Performance Intelligence
Pricing in the global child enrichment services market varies by delivery format, instructor expertise, and program intensity. Household spending reflects sustained demand and affordability constraints. Reading Eggs offers digital reading and mathematics programs for up to four children at USD 13.99 per month or USD 99.99 per year. The annual plan costs approximately 40% less than 12 monthly payments. These figures show the difference between broader extracurricular spending and lower-cost digital subscriptions, although the services differ. Providers can address price sensitivity through tiered packages, trial periods, sibling plans, and annual discounts while protecting margins through group delivery and reusable digital content. Customer acquisition relies on digital discovery, recommendations, and institutional partnerships. A 2024 Child Trends study found that 46% of surveyed Maryland parents used the internet or an app to find childcare, while 41% relied on family, friends, coworkers, or neighbors. Providers should combine local search visibility with referral programs rather than rely solely on paid advertising. Employer partnerships offer another acquisition channel. KinderCare’s 2025 survey found that 86% of surveyed Fortune 500 HR leaders believed childcare benefits helped attract talent, while 85% linked them to lower employee turnover. Providers can pursue corporate benefits partnerships, parent referral incentives, and trial classes to improve conversion while managing acquisition costs.
Child Enrichment Services Market Segment Analysis
By Service Type:
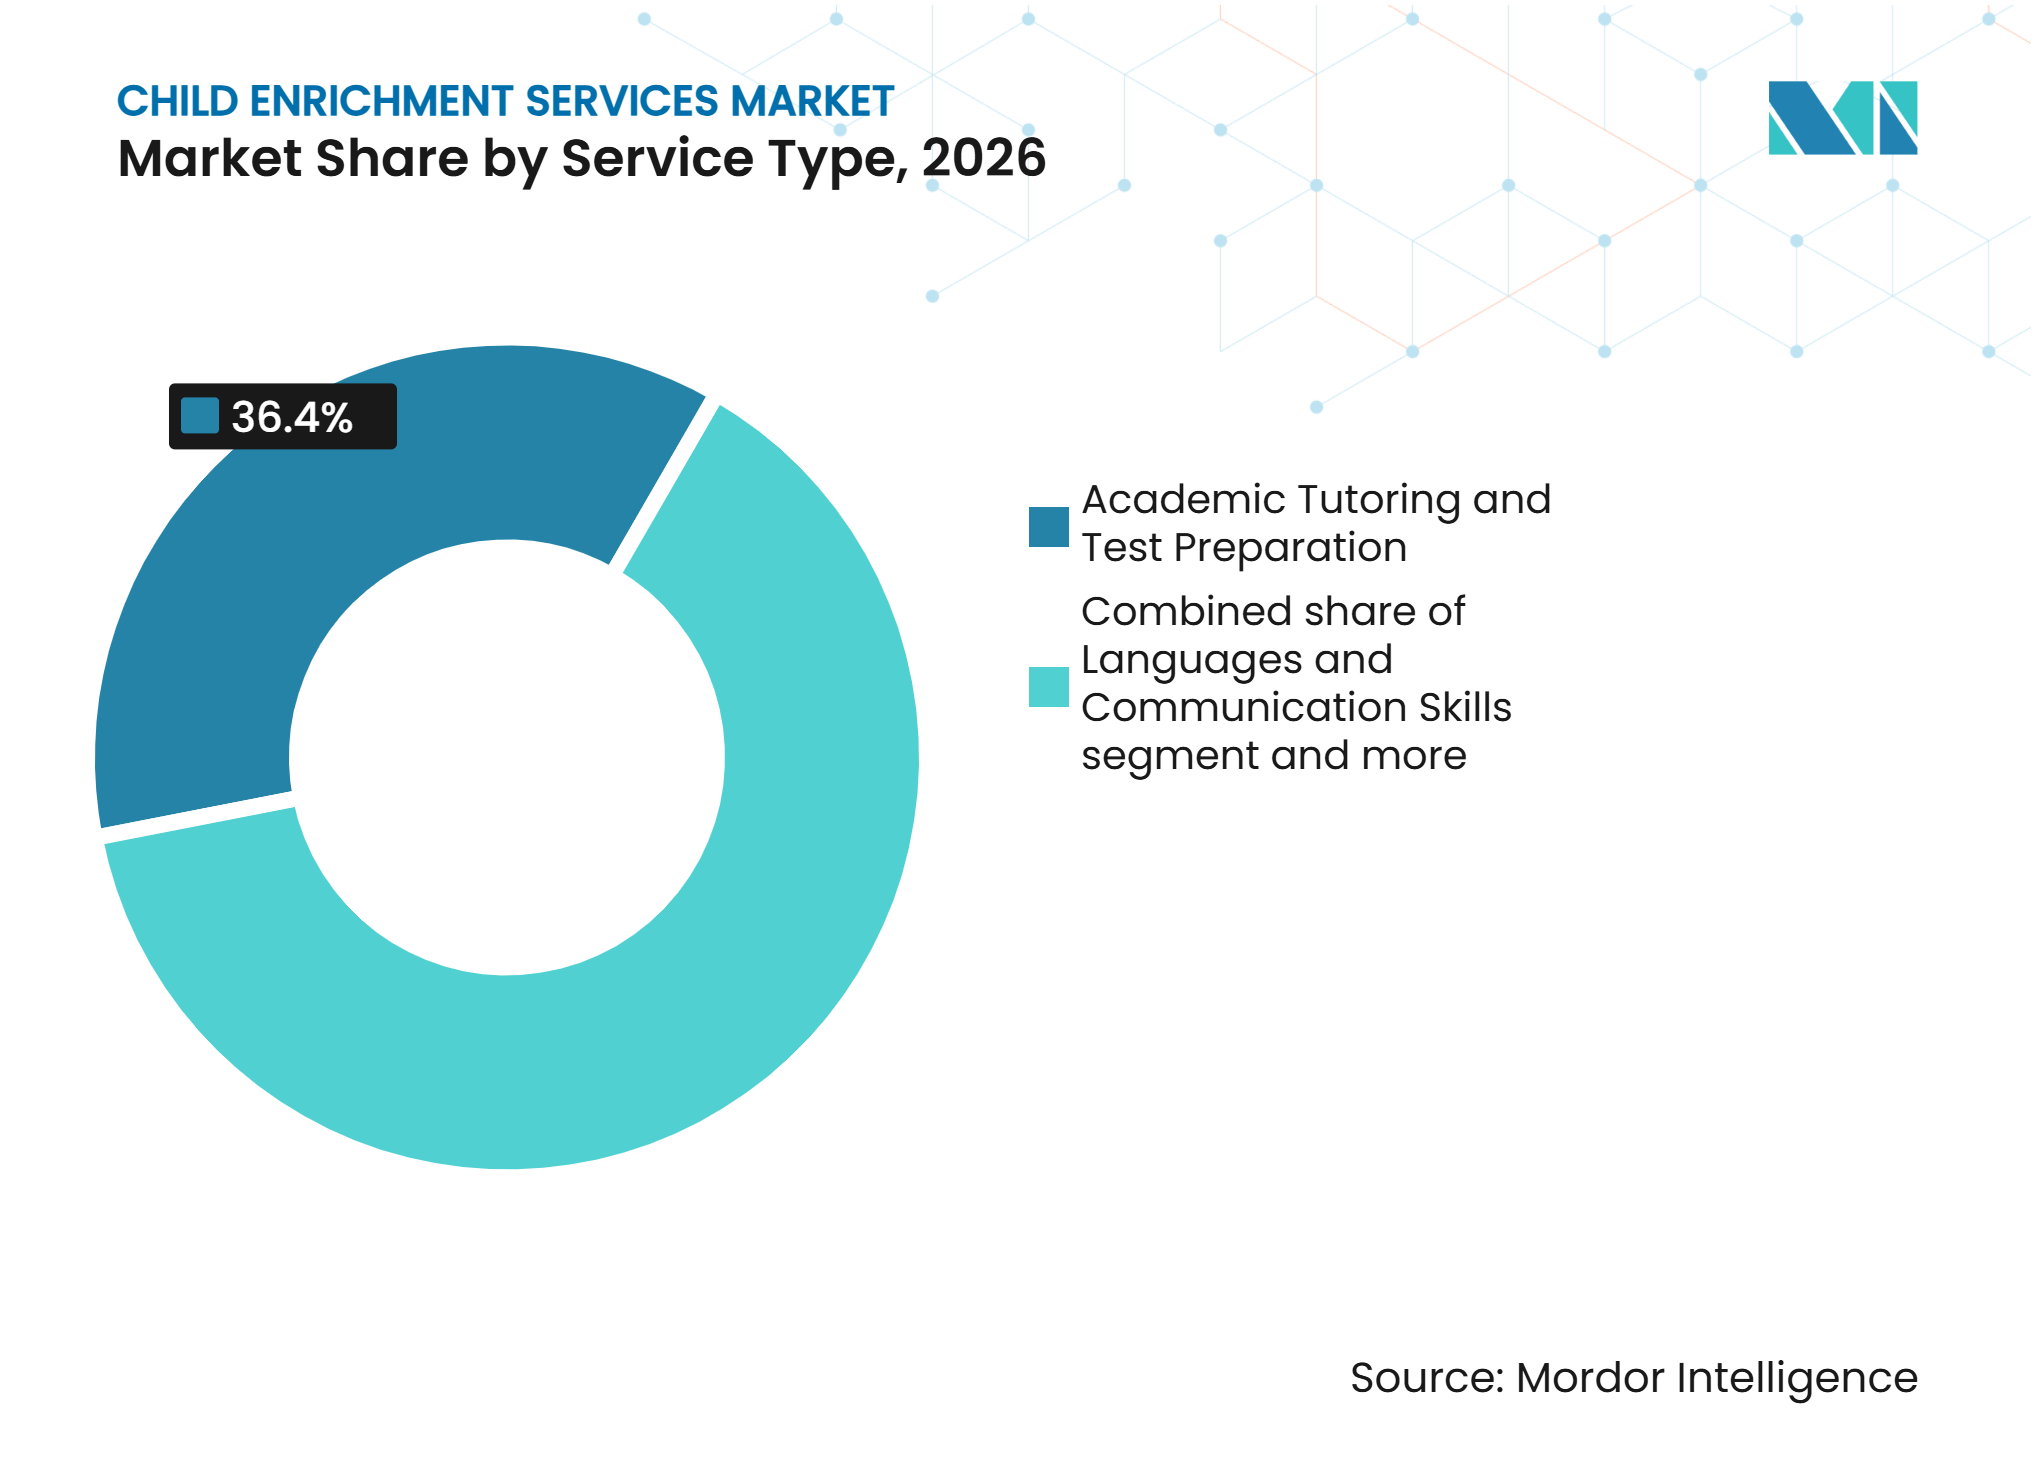
Academic Tutoring Anchors Revenue as Language Services SurgeAcademic Tutoring and Test Preparation accounted for 36.40% of the global child enrichment services market in 2026. The segment benefits from the role of standardized assessments in university admissions across North America, East Asia, and South Asia. Parents use recurring tutoring to strengthen subject mastery and prepare children for key academic transitions. Franchise operators, including Kumon, Mathnasium, and Huntington Learning Center, use repeat enrollment and sequenced programs to build long-term customer relationships. The category benefits from strong parental awareness and a clear connection to academic objectives.
Languages and Communication Skills is forecast to grow at a CAGR of 10.20% through 2032. Demand is driven by multilingual communication, international education, and digital content consumption across language barriers. Early language programs appeal to parents seeking support during foundational learning years. Helen Doron Educational Group and Novakid offer structured language-focused programs for children. Music, performing arts, creative arts, sports, fitness, and physical development remain important complementary services. Demand for these services is more closely influenced by household budgets, local facility availability, and school partnership opportunities.



By Delivery Mode:
Centers Dominate, Online AcceleratesCenter-Based Services accounted for a 38.90% share in 2026. Physical settings provide supervision, peer interaction, and a visible environment that reassures parents. This format is particularly important for early childhood and primary-school participants, for whom social interaction is a key component of service value. Centers also enable instructors to observe participation directly and adjust activities in real time. The global child enrichment services market continues to rely on this format where parents prefer structured, face-to-face support.
Online and App-Based Services are forecast to grow at an 11.80% CAGR through 2032. Broadband access and mobile devices enable providers to reach households far from physical centers. Lingokids reported 20 million monthly active child users in 2025, while LG Uplus stated that KidsTopia doubled its subscriber base to 2 million within six months. Hybrid services combine periodic in-person sessions with digital practice, balancing flexibility and personal interaction. School-embedded programs reduce transportation barriers, while home-based delivery supports families requiring individualized schedules.
By Age Group:
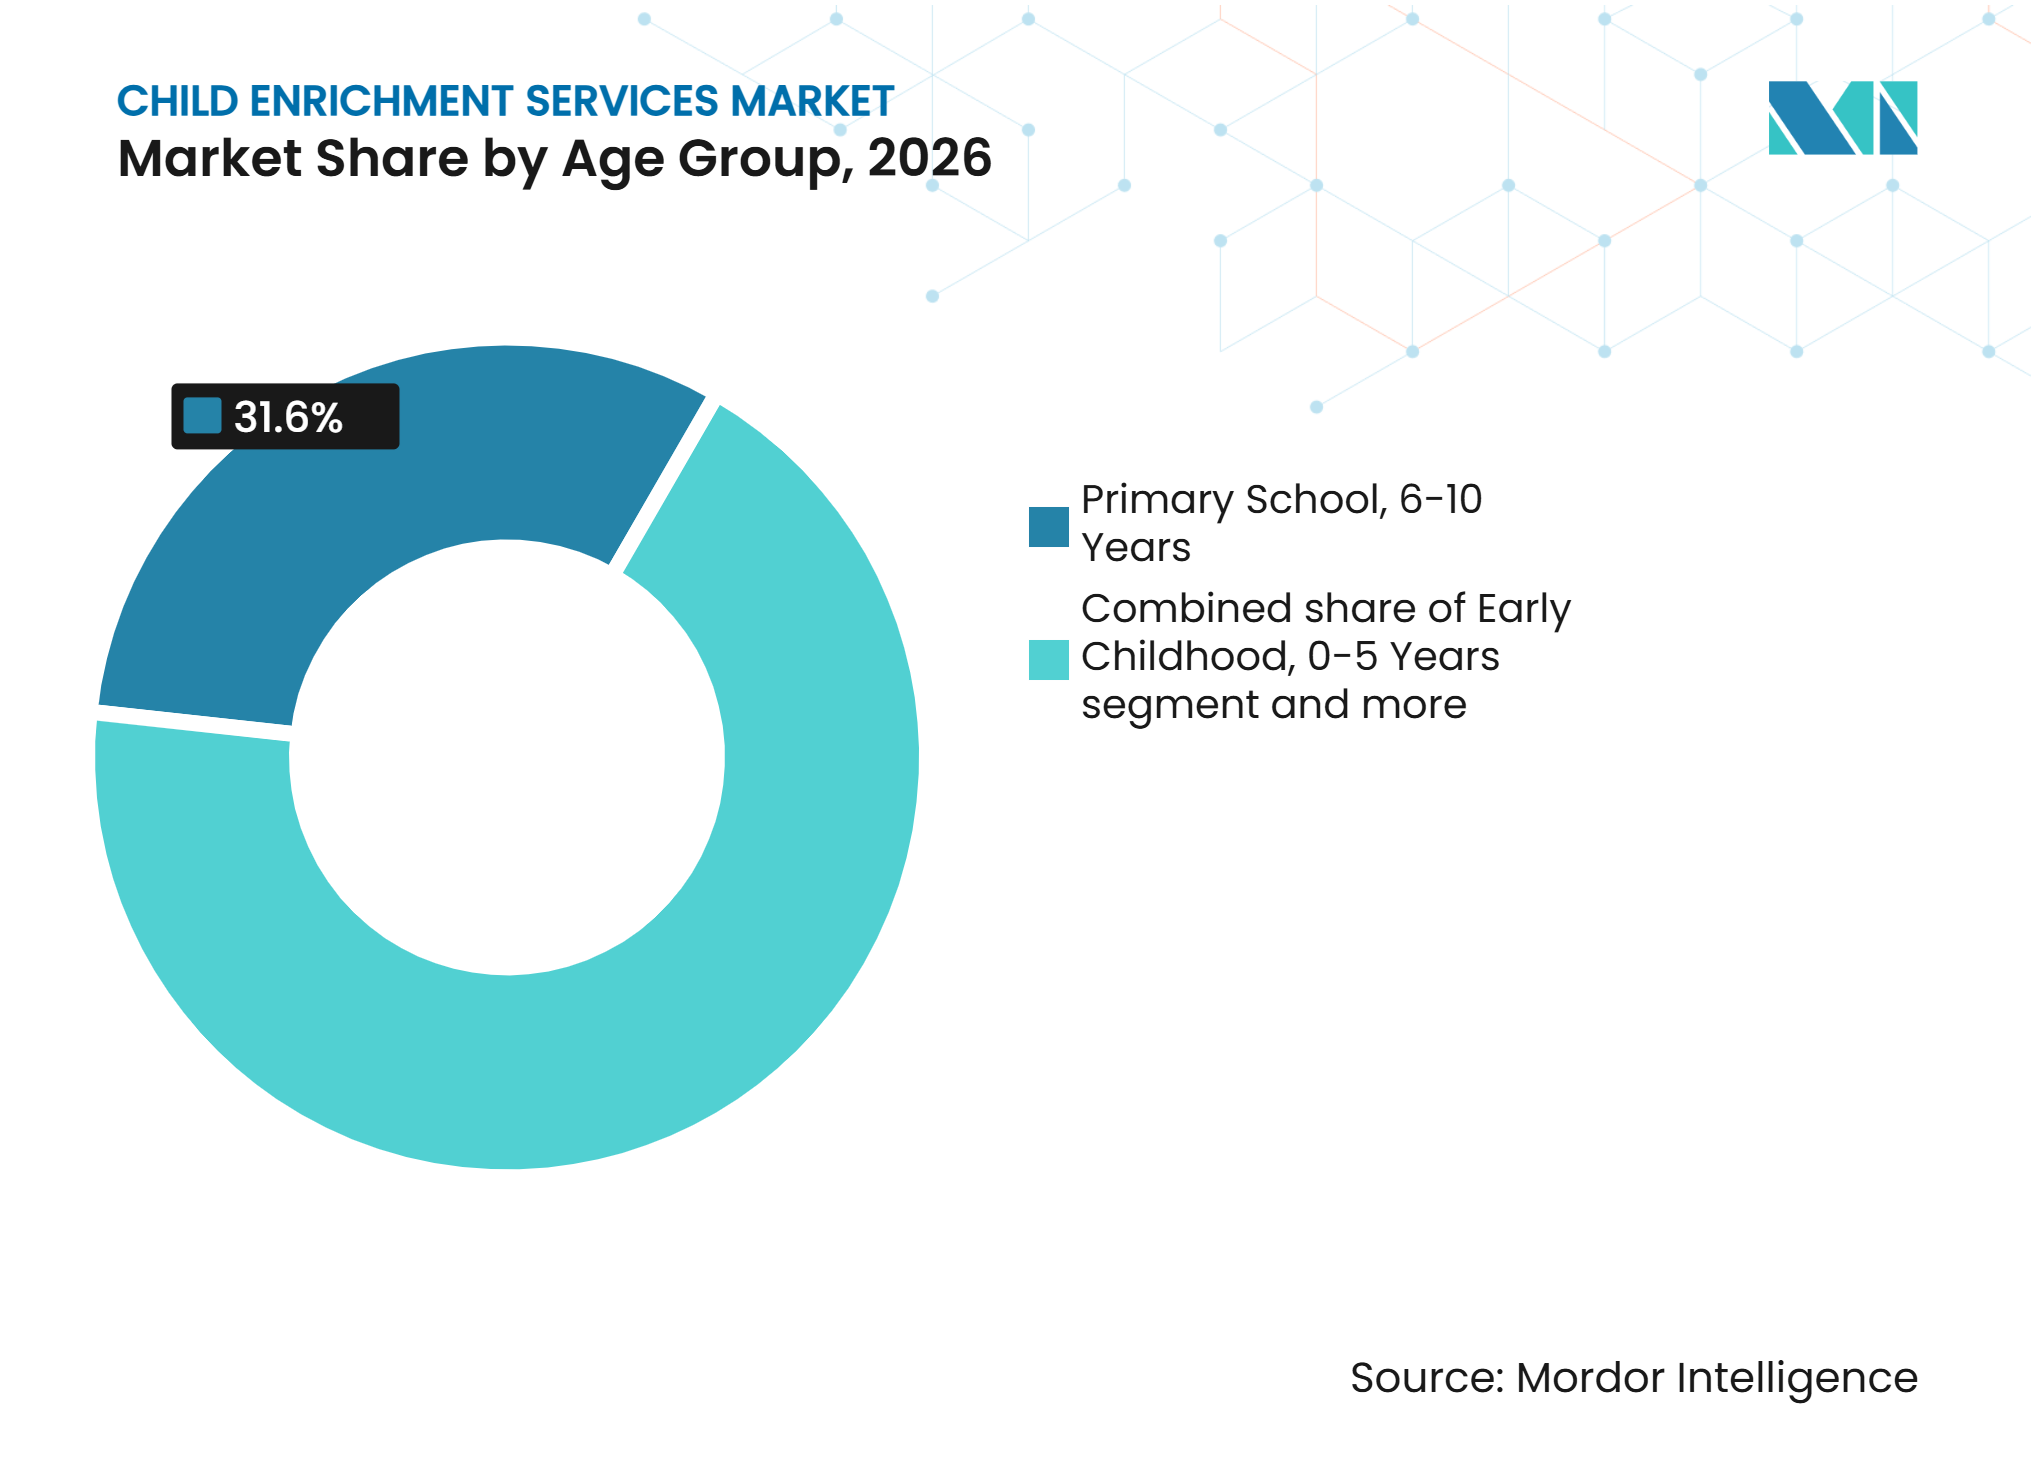
Primary School Leads, Early Childhood Outpaces AllPrimary school children aged 6-10 years accounted for a 31.60% share in 2026. This age group is ready for structured instruction and can access a wide range of activities. Parents are more likely to seek supplemental support after children enter formal schooling. Sequential curricula offered by tutoring franchises can retain students across multiple school years, providing a dependable base for recurring center and program revenue.
Early childhood services for children aged 0-5 years are forecast to grow at a CAGR of 9.90% through 2032. Parents are showing increasing interest in language development, foundational literacy, and play-based learning before formal school entry. Lingokids serves children aged 2-8 years, while Rocket Learning’s Appu targets children aged 3-6 years in India through multilingual conversational learning. Providers must ensure age-appropriate activities and robust child-safeguarding practices in digital products. Lower and upper secondary services continue to experience demand, as examination preparation and university admissions remain family priorities. The child enrichment services industry requires differentiated content, instructor capabilities, and delivery methods for each developmental stage.

Geography Analysis
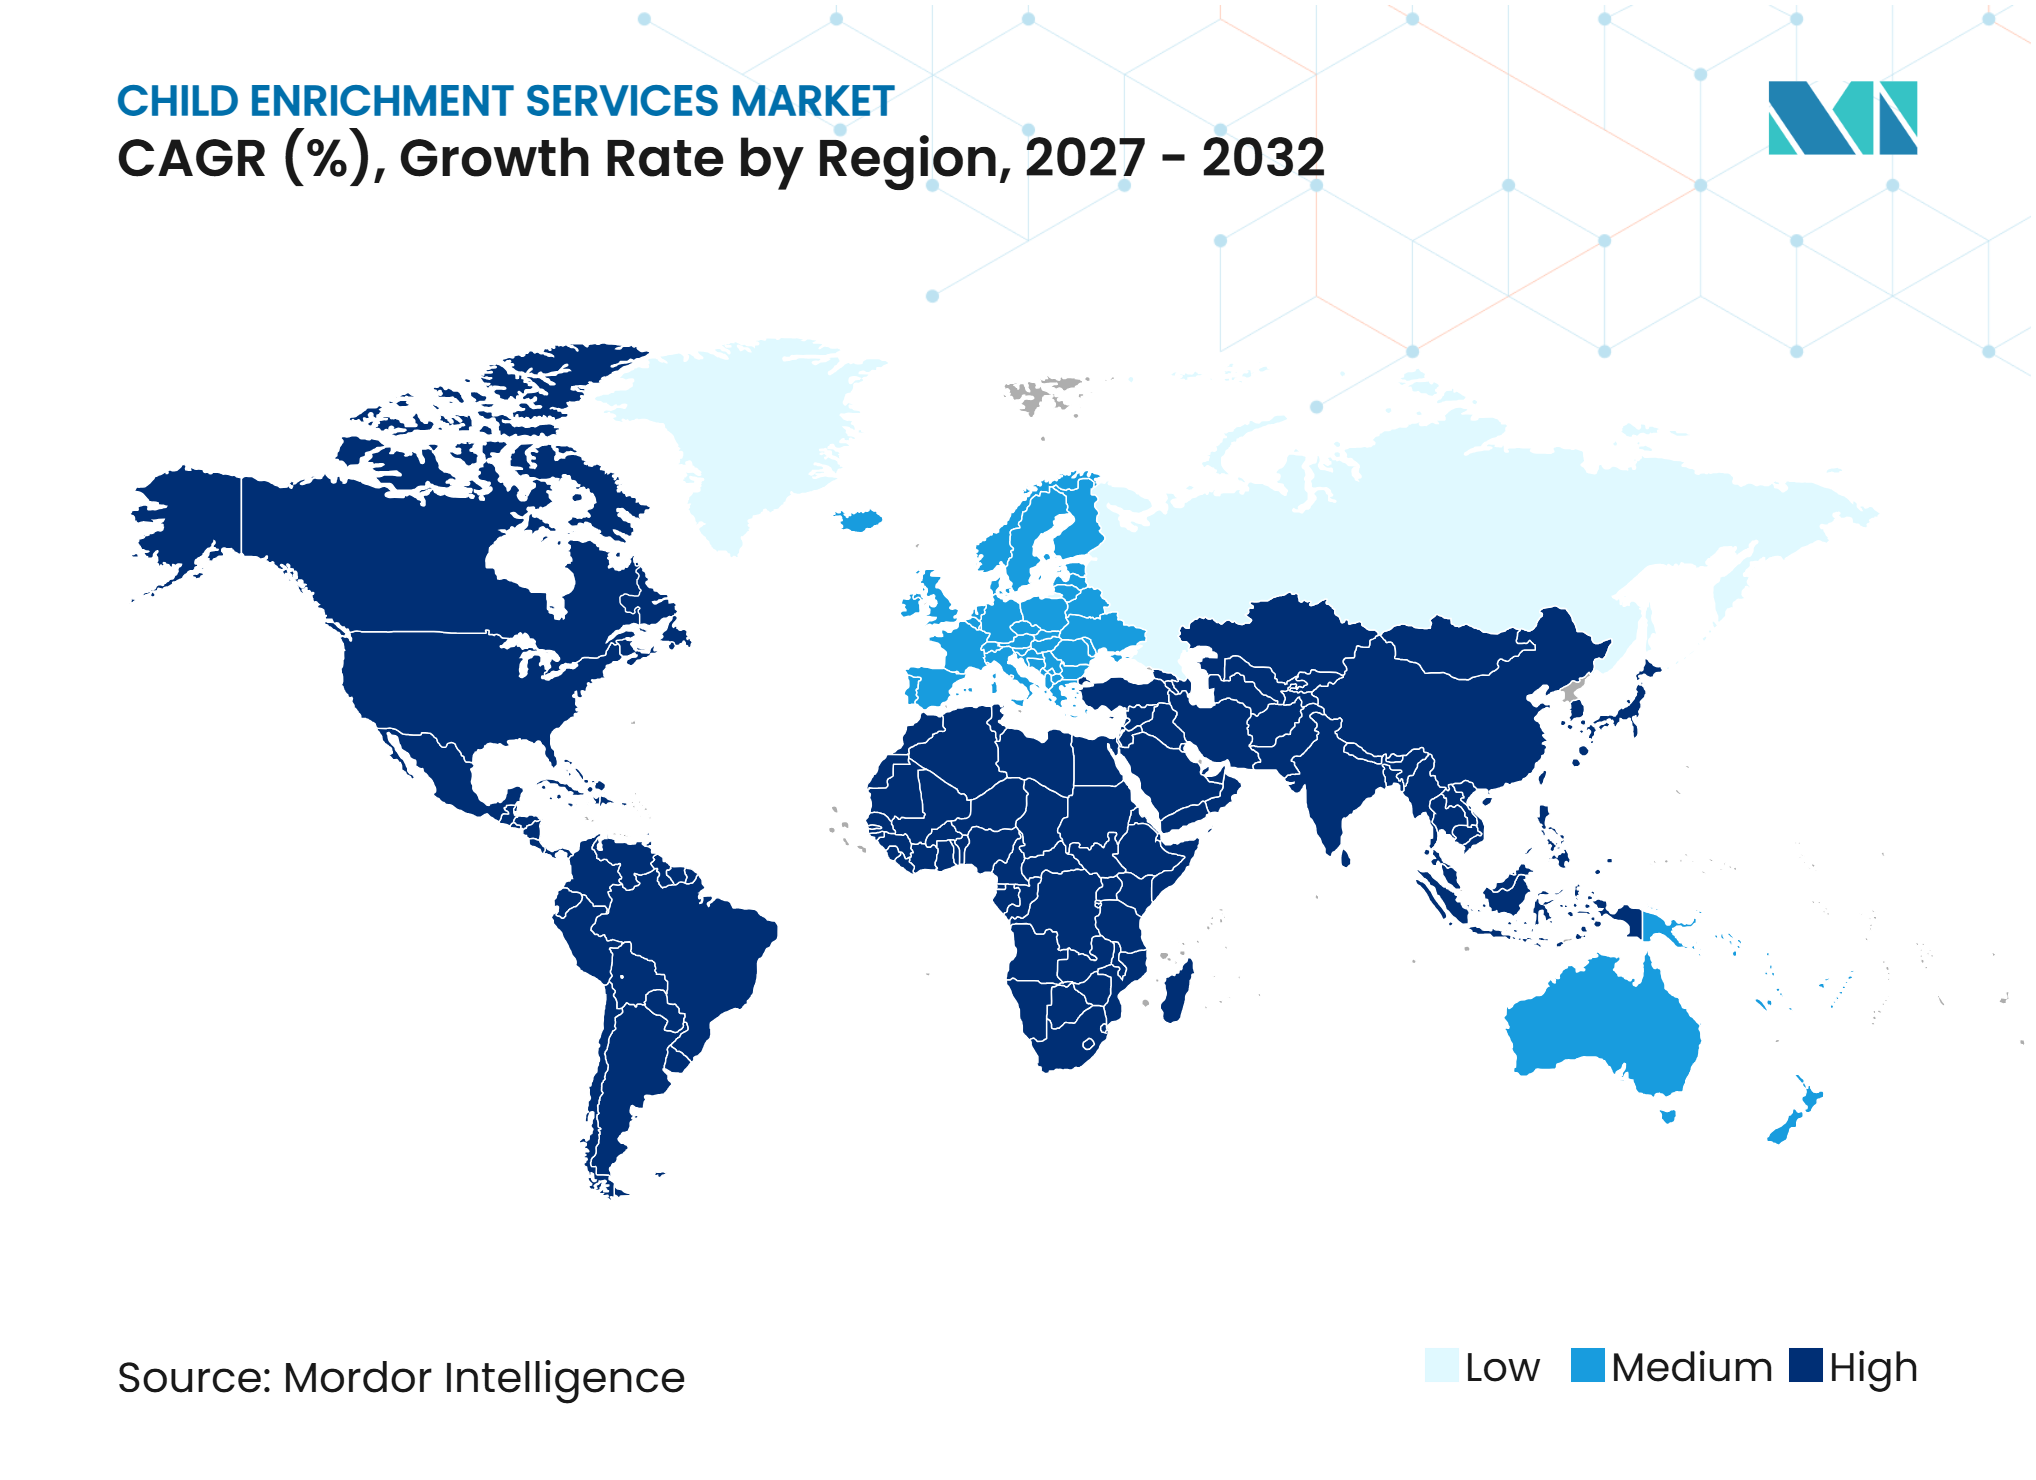
North America accounted for 36.10% of the global child enrichment services market in 2026, valued at USD 12.4 billion. United States tutoring and after-school networks, including Federal 21st Century Community Learning Centers, support infrastructure. In 2025, 53% of United States after-school programs had waitlists, indicating unmet capacity. Employer-supported childcare expands provision, while COPPA amendments strengthen digital data-protection compliance. Safe sites, reliable staffing, and transparent privacy meet parental and employer expectations.
Asia-Pacific is forecast to grow at a CAGR of 10.50% through 2032. India’s school-age population supports online and center-based programs; Rocket Learning’s Appu demonstrates multilingual early-learning tools. Japan’s juku culture supports instructor-led preparation, while adaptive tools expand. Singapore’s public AI-enabled upper-primary learning sets technology benchmarks. South Korea’s 2025 decline in private education expenditure highlights demographic and affordability constraints. The region favors localized, scalable, value-focused delivery.
Europe combines public provision with specialized private services. Germany’s full-day school expansion supports schedule-aligned programs, while United Kingdom operators use trials and flexible formats. Digital providers must address European Commission 2026 guidance on minors’ online privacy, safety, and security. Urbanization and education investment support uneven demand in the Middle East and Africa. South America relies more on nonprofit and government-linked models in lower-income communities; Fundación Ciudad del Niño’s 2025 Espacio TAN! pilot expanded after-school access in Chile.
Service Provider Network & Expansion Intelligence
The global child enrichment services market remains fragmented, with independent tutoring centers, sports academies, music schools, language studios, and coding clubs. The International Franchise Association reported that United States child-related franchise establishments increased from 10,660 in 2021 to more than 11,810 in 2024, representing a CAGR of 3.5%. Franchising supports standardized programs and brand recognition, while independent operators and community-based providers continue to support local service availability.
Partnerships with schools, shared facilities, and franchise models can expand service coverage while reducing infrastructure costs. Providers combine digital distribution with physical and school-based delivery to reach more families. LG Uplus reported that KidsTopia operated in 11 countries in 2025, with overseas users representing 67% of its user base. Lingokids announced USD 120 million in financing for global expansion and intellectual property partnerships. These strategies support localized digital content, affordable subscriptions, and school collaborations, particularly in underserved markets where standalone enrichment centers face cost and accessibility barriers.
Competitive Landscape
Market Concentration
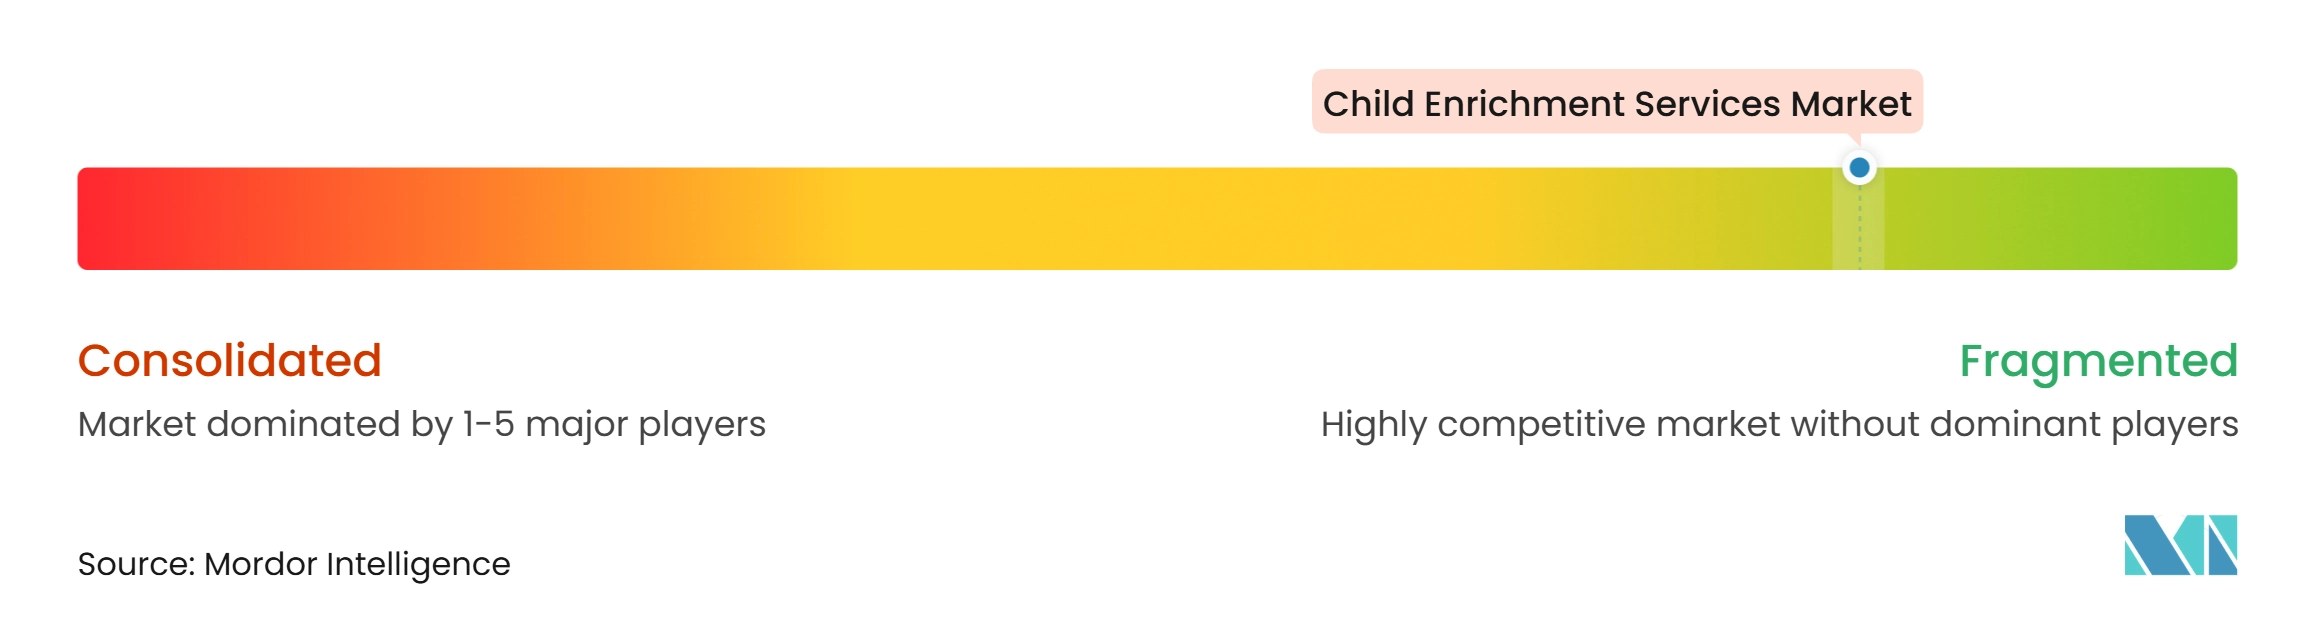
The global child enrichment services market is highly fragmented. Local delivery, instructor quality, and community trust support independent operators. Franchises leverage standardized curricula and established brands, while independent centers compete through local relationships, flexible schedules, and specialized instruction. This structure broadens family choice but complicates quality comparisons. Digital companies compete through content scale, personalization, and international reach. Lingokids stated that its planned “Lingokids’ September 2025 financing supports AI-powered content production, international expansion, and third-party intellectual property partnerships, including Pocoyo and Blippi.
In 2026, the company further expanded its content strategy by featuring partnerships with Disney, Moonbug Entertainment, and other established children’s brands. Children's Online Privacy Protection Act (COPPA) amendments and European Commission guidance on minors’ online safety increase compliance requirements. Larger platforms may be better able to absorb these costs. Opportunities remain in affordable subscriptions, integrated service hubs, and employer-supported programs. Combining academic, creative, and physical activities can reduce scheduling burdens and increase household participation. Nonprofit and school-linked programs remain important where budgets constrain commercial participation. Fundación Ciudad del Niño’s Chilean after-school pilot targeted underserved children. Providers combining affordability with measurable outcomes can reach a wider range of households.
Child Enrichment Services Industry Leaders
-
Kumon Institute of Education Co., Ltd.
-
Sylvan Learning, LLC
-
Varsity Tutors LLC
-
Mathnasium LLC
-
Code Ninjas Franchising LLC
- *Disclaimer: Major Players sorted in no particular order
Child Enrichment Services Market Companies Covered in this Report
- Kumon Institute of Education Co., Ltd.
- Sylvan Learning, LLC
- Huntington Learning Center, Inc.
- Mathnasium LLC
- Code Ninjas Franchising LLC
- Varsity Tutors LLC
- Outschool, Inc.
- Tutor Doctor
- Oxford Learning Centres Inc.
- Eye Level Learning Centers, Inc.
- Best Brains Learning Centers
- JEI Learning Centers
- The Princeton Review, Inc.
- KidZania S.A.P.I. de C.V.
- Lingokids S.L.
- Novakid Inc.
- Berlitz Corporation
- Helen Doron Educational Group
- Camp Australia Pty Ltd
- G8 Education Limited
Recent Industry Developments in Child Enrichment Services Market
- August 2026: Code Ninjas opened more than 20 new locations across North America during the first half of 2026 and became the first children’s STEM franchise to earn the International Society for Technology in Education (ISTE) Seal. The expansion strengthens its coding, robotics, and AI education network for children aged 5-14, highlighting growing investment in technology-focused enrichment and franchise-led geographic expansion.
- February 2026: Lingokids launched its AI-powered Billy’s Lab content studio, enabling children to test interactive learning prototypes. The company reported developing prototypes in about one week, accelerating content experimentation and digital enrichment innovation.
- September 2025: Lingokids secured USD 120 million in financing to accelerate AI-powered content production, global expansion, and multi-IP development, featuring existing partnerships with Pocoyo and Blipp.
- August 2025: Fundación Ciudad del Niño launched Espacio TAN!, an after-school pilot in Chile for children aged 5-10 in underserved urban communities. The program promotes socioemotional and holistic development, illustrating how nonprofit-led initiatives can extend enrichment access beyond fee-paying households through locally tailored services.
Global Child Enrichment Services Market Report Scope
The global child enrichment services market report examines demand for structured educational, creative, physical, and developmental activities that complement children’s formal schooling worldwide. The market is segmented by service type (Academic Tutoring and Test Preparation, Languages and Communication Skills, Music, Performing Arts and Creative Arts, Sports, Fitness and Physical Development, and Other Child Enrichment Services); delivery mode (Center-Based Services, School-Embedded Services, Home-Based Services, Online and App-Based Services, and Hybrid Services); age group (Early Childhood, 0-5 Years; Primary School, 6-10 Years; Lower Secondary School, 11-13 Years; and Upper Secondary School, 14-17 Years); and geography (North America, South America, Europe, Asia-Pacific, and the Middle East and Africa, including key countries and regional groups). The study analyzes market drivers, including parental demand for measurable academic and developmental outcomes, expansion of structured after-school care, digital and hybrid delivery, AI-enabled learning personalization, employer-sponsored childcare and enrichment benefits, and growing emphasis on skill development, competitions, and portfolio building. It also assesses restraints such as household affordability constraints, fragmented quality standards, child safeguarding and data privacy requirements, consent compliance, and instructor recruitment and retention challenges. The report evaluates the regulatory landscape, technological outlook, Porter’s five forces analysis, service-provider networks, new launches, geographic expansion, pricing, customer acquisition trends, marketing costs, consumer preferences, spending patterns, purchase frequency, competitive landscape, market concentration, strategic developments, market shares, and company profiles. It further identifies market opportunities, including integrated academic, creative, and physical enrichment hubs and affordable subscription models for underserved households. The report provides market size and growth forecasts in value terms for 2022–2032 across the global market and its regional segments.
Segmentation Overview
Key Questions Answered in the Report
What is the projected value of child enrichment services by 2032?
The sector is projected to reach USD 57.01 billion by 2032, growing at a 8.73% CAGR from 2027.
Which child enrichment service has the largest share?
Academic Tutoring and Test Preparation leads service types with 36.40% share in 2026.
Which child enrichment service is growing fastest?
Languages and Communication Skills is forecast to grow at a 10.20% CAGR through 2032.
Why are online child enrichment programs growing?
Online and app-based services are forecast to grow at an 11.80% CAGR because they improve access, scheduling flexibility, and geographic reach.
Which region is leading child enrichment services?
North America leads with 36.10% share in 2026, while Asia-Pacific has the fastest forecast growth at 10.50% CAGR.
What is limiting access to child enrichment programs?
Affordability, uneven quality standards, privacy compliance, and instructor shortages can limit enrollment and service expansion.