Global Capability Centers Market Size and Share
Market Overview
| Study Period | 2020 - 2031 |
|---|---|
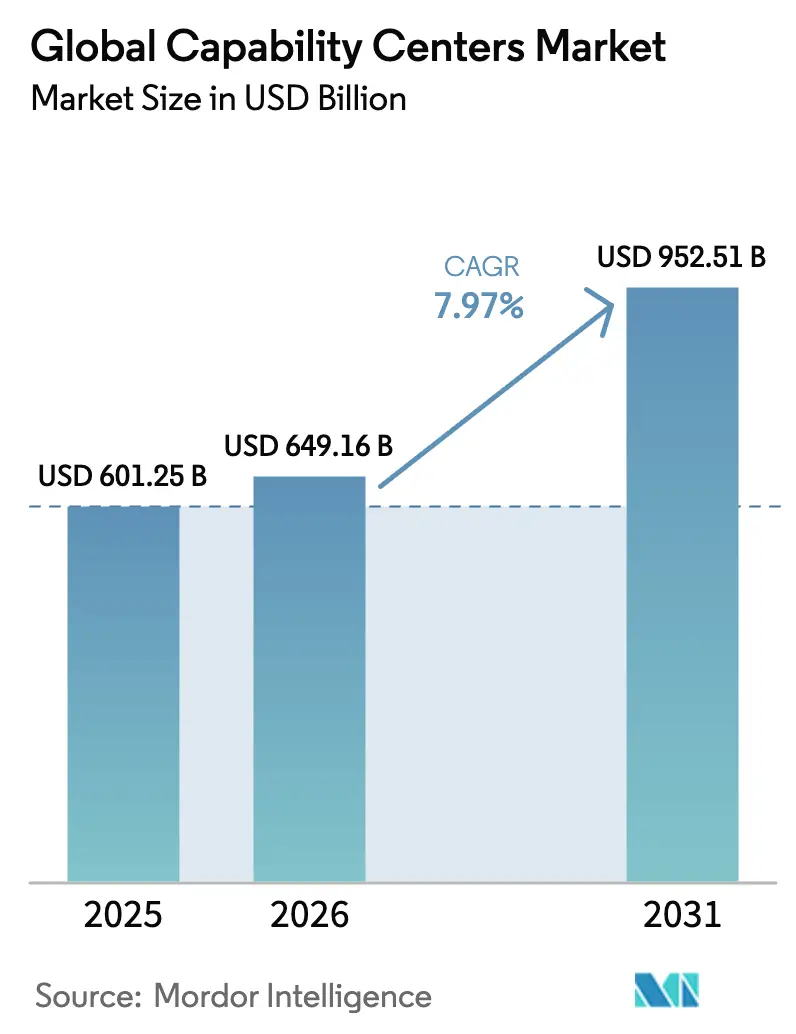
| Market Size (2026) | USD 649.16 Billion |
| Market Size (2031) | USD 952.51 Billion |
| Growth Rate (2026 - 2031) | 7.97% CAGR |
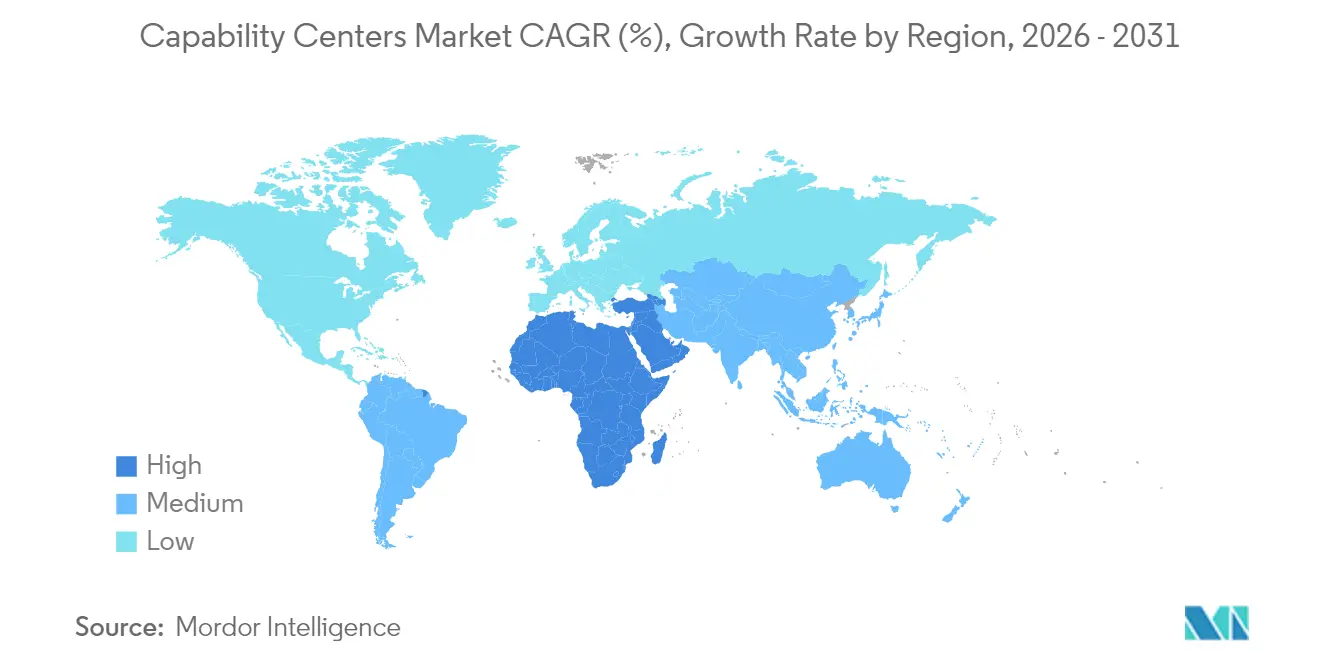
| Fastest Growing Market | Middle East and Africa |
| Largest Market | Asia Pacific |
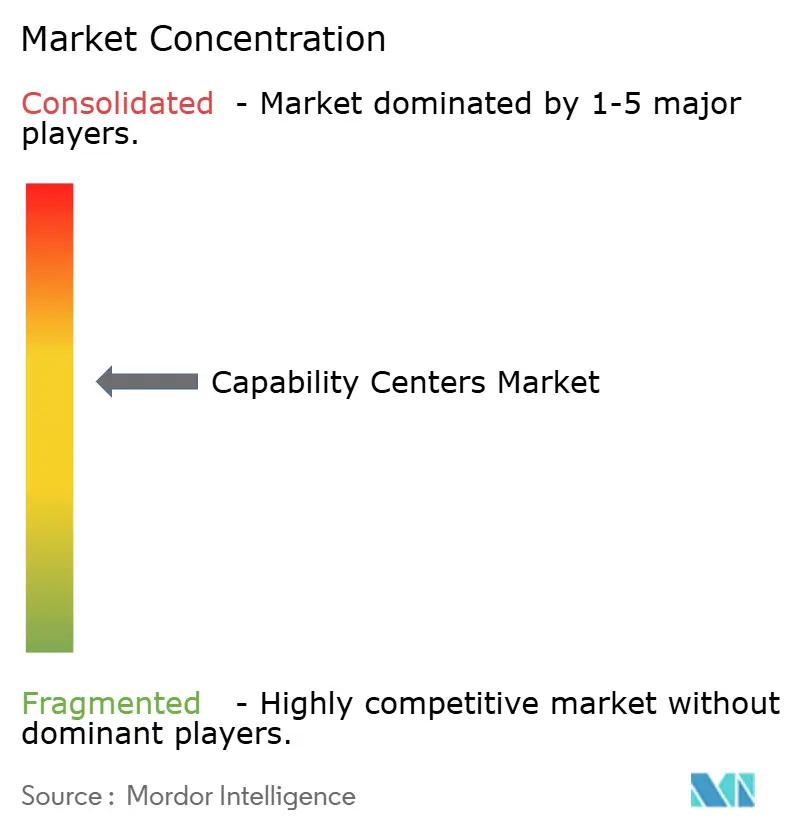
| Market Concentration | Medium |
Major Players *Disclaimer: Major Players sorted in no particular order Image © Mordor Intelligence. Reuse requires attribution under CC BY 4.0. | |
Global Capability Centers Market Analysis by Mordor Intelligence
Global Capability Centers market size in 2026 is estimated at USD 649.16 billion, growing from 2025 value of USD 601.25 billion with 2031 projections showing USD 952.51 billion, growing at 7.97% CAGR over 2026-2031. This steady climb underscores how multinational enterprises now view their global hubs as strategic innovation engines, rather than merely cost-arbitrage locations, utilizing them to accelerate digital product rollouts, deepen artificial intelligence expertise, and enhance enterprise resilience. Geographic diversification is no longer a defensive move; it has become an active tactic for tapping into specialized talent pools, aligning with data sovereignty rules, and building around-the-clock delivery models. Growth also stems from the demand for cloud-native engineering, the rising adoption of Build-Operate-Transfer frameworks, and state-sponsored incentive programs that reduce setup time and costs. The intensification of consolidation among service providers indicates that capability advantages, rather than price alone, now dictate client choice.
Key Report Takeaways
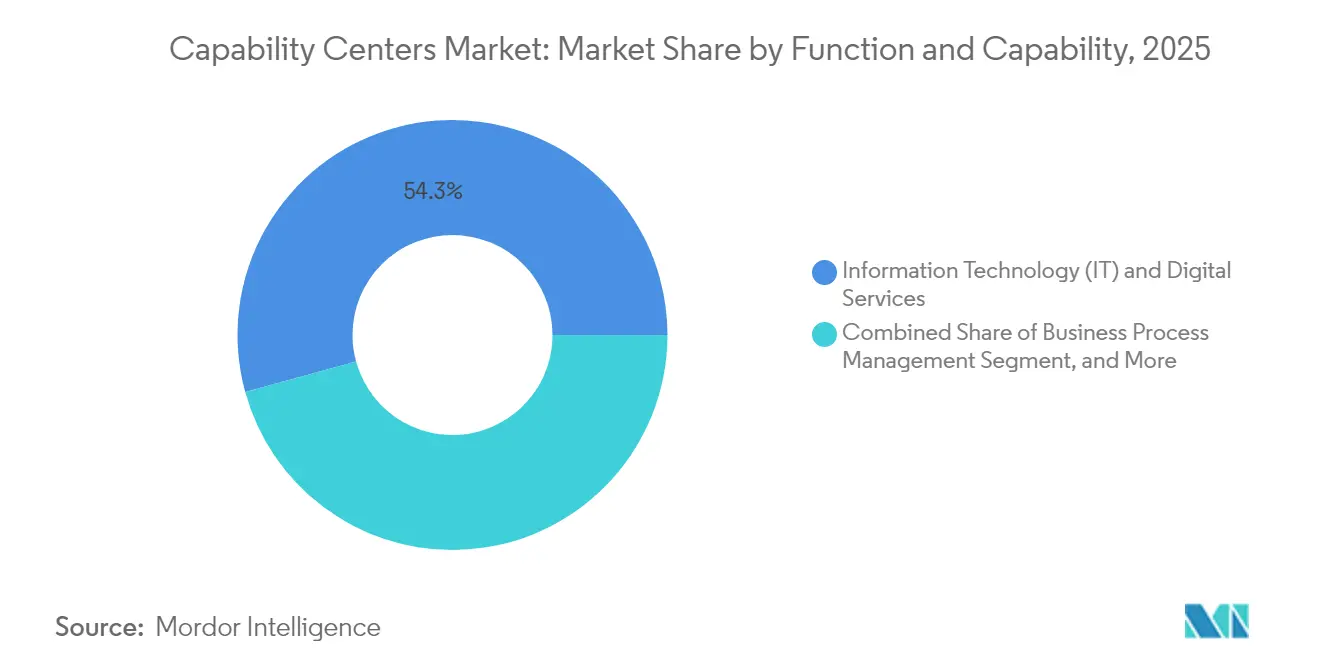
- By function, Information Technology and Digital Services held a 54.28% market share of the Global Capability Centers in 2025, and this function is projected to expand at an 8.38% CAGR through 2031.
- By engagement model, captive centers commanded a 57.74% share of the Global Capability Centers market size in 2025, whereas hybrid Build-Operate-Transfer arrangements are expected to grow at a 9.10% CAGR through 2031.
- By organization size, large enterprises captured 85.63% revenue share in 2025; small and medium enterprises are set to advance at a 9.98% CAGR through 2031.
- By industry vertical, telecom and IT accounted for 35.88% of the Global Capability Centers market size in 2025, while banking, financial services, and insurance are forecast to post a 9.03% CAGR to 2031.
- By geography, the Asia Pacific led with a 62.58% revenue share in 2025; the Middle East and Africa are on track to record the fastest growth, with a 8.97% CAGR through 2031.
Note: Market size and forecast figures in this report are generated using Mordor Intelligence’s proprietary estimation framework, updated with the latest available data and insights as of 2026.
Global Capability Centers Market Trends and Insights
Drivers Impact Analysis*
| Driver | (~) % Impact on CAGR Forecast | Geographic Relevance | Impact Timeline |
|---|---|---|---|
| Accelerated Digital Transformation Initiatives | +1.8% | Global, concentrated in North America and Europe | Medium term (2-4 years) |
| Rising Need for Cost Optimization and Operational Resilience | +1.5% | Global, especially Asia Pacific, and Middle East, and Africa | Short term (≤ 2 years) |
| Availability of Skilled Tech Workforce in Emerging Hubs | +1.2% | Asia Pacific core, spillover to the Middle East and Africa | Long term (≥ 4 years) |
| Government Incentive Programs for Captive Centers | +0.9% | India, UAE, Philippines, Vietnam, Latin America | Medium term (2-4 years) |
| Demand for Round-the-Clock Global Service Delivery | +0.7% | Global | Short term (≤ 2 years) |
| Expansion of Cloud-Native Product Engineering Capabilities | +1.1% | North America and Europe demand, Asia Pacific delivery | Medium term (2-4 years) |
| Source: Mordor Intelligence | |||
Accelerated Digital Transformation Initiatives
Global enterprises are now launching capability centers to co-create digital products and intellectual property, rather than just maintaining legacy systems. Microsoft’s USD 1.5 billion partnership with UAE-based G42, aimed at sovereign AI infrastructure, signals the new focus on high-value R&D. Centers that once housed support work now lead machine-learning model training, cloud-native platform builds, and design-thinking sprints. This shift prompts organizations to establish hubs near deep pools of AI and cybersecurity talent, even if labor is available at a premium. It also lengthens center lifecycles, because value compounds as teams mature in cutting-edge toolchains.
Rising Need for Cost Optimization and Operational Resilience
Persistent supply-chain shocks and currency volatility have compelled firms to strike a balance between cost and continuity. Companies distribute work across multiple centers so that a regional outage, natural disaster, or political event does not shut down critical operations. Follow-the-sun models enable software releases after hours in one region and same-day validation elsewhere, reducing cycle time and overtime costs. Hybrid engagement models flourish because they share the initial setup risk with a partner while allowing for eventual insourcing once operations stabilize.
Availability of Skilled Tech Workforce in Emerging Hubs
India remains the bedrock, yet wage inflation has drawn attention to Vietnam, the Philippines, and select Eastern European cities that graduate thousands of engineers each year. Vietnam’s semiconductor design programs, supported by tax holidays and English-language curricula, have attracted electronics majors to new research facilities.[1]Mai Nguyen, “Vietnam’s Tax-Holiday Strategy Boosts Semiconductor R&D,” Arab News, arabnews.com Companies now map precise skill clusters, say, mixed-signal chip design or DevSecOps, and locate centers where those niches thrive.
Government Incentive Programs for Captive Centers
States compete for high-value jobs with bundled packages that include land allotments, expedited clearances, and training grants. Karnataka’s Global Capability Center policy aims for 500 new sites and USD 50 billion in output by 2029.[2]Government of Karnataka, “Global Capability Center Policy Framework 2024-2029,” karnataka.gov.in Similar plans in Uttar Pradesh, the UAE, and Latin America further compress payback periods for investors. Besides lower tax outlays, firms gain smoother fiber-optic rollouts, purpose-built campuses, and workforce-housing support, all of which accelerate project kick-off.
Restraints Impact Analysis*
| Restraint | (~) % Impact on CAGR Forecast | Geographic Relevance | Impact Timeline |
|---|---|---|---|
| Intensifying Competition for Niche Talent | -1.4% | Global, acute in India and the Philippines | Short term (≤ 2 years) |
| Geopolitical and Regulatory Uncertainties | -1.1% | US-China, US-Russia, EU-UK corridors | Medium term (2-4 years) |
| Rising Wage Inflation in Established Hubs | -0.8% | Asia Pacific mature markets | Short term (≤ 2 years) |
| Cybersecurity and IP Protection Concerns | -0.6% | Regulated industries worldwide | Long term (≥ 4 years) |
| Source: Mordor Intelligence | |||
Intensifying Competition for Niche Talent
Artificial intelligence scientists, cloud architects, and zero-trust security specialists command premium salaries, provoking bidding wars in Bengaluru, Manila, and Warsaw. Start-ups and tech giants alike draw from the same shallow pool, resulting in attrition rates that exceed historical norms. Enterprises respond with university tie-ups, internal bootcamps, and relocation stipends, yet supply still lags near-term demand.
Geopolitical and Regulatory Uncertainties
Data localization laws, digital services taxes, and export control regimes raise compliance overhead. Firms often replicate capabilities across at least two jurisdictions to hedge against sudden policy shifts. The duplication inflates capital expenditure and hinders global standardization, especially when encryption, data sovereignty, or IP transfer rules differ by country.
*Our forecasts treat driver/restraint impacts as directional, not additive. The impact forecasts reflect baseline growth, mix effects, and variable interactions.
Segment Analysis
By Function/Capability: Digital Services Extend Value Chains
The Information Technology and Digital Services segment led the Global Capability Centers market, with a 54.28% share in 2025, and its 8.38% CAGR signals a continued appetite for cloud-native architecture and AI product engineering. This dominance positions the segment as the primary engine of new revenue creation inside hubs, replacing the legacy role of low-cost maintenance. Engineering and R&D centers cluster near chipset, automotive software, and biotech innovation corridors, lending high-margin depth to parent firms’ product roadmaps.
R&D hubs are increasingly co-located with process-automation teams to accelerate concept-to-commercial cycles. As adjacent teams integrate, capability centers turn into one-stop innovation zones for ideation, prototyping, testing, and support. The convergence provides enterprises with a defensible edge in both time-to-market and intellectual property generation. The Global Capability Centers market size for digital services, therefore, expands at a faster rate than the market average, validating the shift from transactional outsourcing toward strategic co-creation.


By Engagement Model: Hybrid Flexibility Outpaces Pure Captives
Captive centers still controlled 57.74% of the revenue in 2025, but market momentum has shifted to hybrid Build-Operate-Transfer structures, which are growing at a 9.10% CAGR. These arrangements combine a partner’s local compliance, payroll, and hiring know-how with the client’s long-term ownership goal. The setup suits enterprises that want a soft landing for unfamiliar talent without compromising intellectual property rights.
Hybrids also offer off-balance-sheet financing options and variable cost profiles during the ramp-up period. Once a site reaches critical mass, clients may exercise transfer rights, bringing the entity in-house and securing strategic control. This flexibility keeps hybrid models attractive in volatile regions and aligns with CFO mandates for capital-light expansion. Over time, hybrid models are likely to raise their share of the Global Capability Centers market size, especially in frontier economies where regulatory complexity is high.
By Organization Size: Cloud Platforms Democratize Access
Large enterprises represented 85.63% of value in 2025, often running portfolios of 10–50 centers that handle everything from prototype testing to regulatory reporting. Their scale advantages include multi-tower governance and global procurement power. Yet, small and medium enterprises, growing at a 9.98% CAGR, represent the most dynamic buyer group. They deploy subscription-based cloud toolchains, turnkey compliance modules, and standardized security stacks to launch hubs in months, not years.
As hyperscalers bundle infrastructure, observability, and zero-trust security into a single contract, SMEs can quickly spin up digital product lines, analytics pods, and support desks with minimal capital outlay. The trend expands the Global Capability Centers market by pulling thousands of mid-tier firms into the addressable universe, compressing traditional service-provider margins but boosting overall demand.

By Industry Vertical: Financial Services Accelerate Digital Banking
Telecom and IT delivered a 35.88% share in 2025, benefiting from perpetual network upgrades and 5G software rollouts. Banking, financial services, and insurance, which are increasing at a 9.03% CAGR, now set the pace, driven by open-banking APIs, reg-tech mandates, and cloud-native core modernization. BFSI centers prioritize real-time fraud analytics, the development of digital wallet features, and the automation of regulatory stress-testing.
Healthcare and life sciences hubs expand with data-rich clinical trial platforms and AI-enabled pharmacovigilance. Automotive and industrial clients pursue autonomous-vehicle code, predictive maintenance analytics, and sustainable manufacturing research and development. Retail and consumer brands leverage these centers for omnichannel inventory management and personalization engines. This cross-industry diffusion deepens the Global Capability Centers industry footprint while leveling growth risks across cycles.
Geography Analysis
The Asia Pacific anchored the Global Capability Centers market with a 62.58% share in 2025, driven by India’s 1,700-plus centers, which generated USD 64.6 billion in revenue. The region offers deep talent reserves, a mature vendor ecosystem, and policy backing, such as accelerated depreciation on technology assets. Rising wages in Tier-1 Indian cities, however, prompt firms to consider secondary locations in Indonesia, Thailand, and Bangladesh, each offering younger workforces and lower attrition rates. Vietnam’s semiconductor push and the Philippines’ English-centric service culture furnish specialized footholds.
The Middle East and Africa remain the fastest-growing cluster, clocking a 8.97% CAGR through 2031. The UAE’s memorandum with India to add 2 gigawatts of data center capacity underpins sovereign cloud strategies [3]S. Subramaniam, “UAE-India Digital Infrastructure MoU Includes 2GW Data Center Capacity,” Gulf News, gulfnews.com . Saudi Arabia’s Vision 2030, coupled with smart-city projects like NEOM, lures automotive, games-engineering, and clean-tech centers. Egypt and South Africa offer time-zone and language advantages for European markets, enabling the combination of service delivery with regulatory compliance.
North America and Europe, though costly, retain premium roles in the Global Capability Centers market. Firms keep R&D, compliance, and customer-experience pods close to headquarters to satisfy data-sovereignty rules and nurture agile collaboration. Near-shore options in Mexico, Poland, Romania, and Ireland let companies blend cost control with cultural alignment. Government grants that support high-skill job creation in these nations mitigate some of the wage differential, ensuring that select functions remain onshore or near-shore despite cheaper distant alternatives.

Competitive Landscape
Global Capability Centers exhibit moderate concentration. Top IT services giants, such as Tata Consultancy Services, Infosys, and Accenture, expand their footprints through continuous acquisition and organic growth, bundling consulting, cloud, and cybersecurity services into end-to-end solutions. Specialty players focus on AI, zero-trust security, or industry clouds, drawing premium deals despite smaller size. The Microsoft-G42 collaboration illustrates how technology majors form region-specific alliances to navigate data-sovereignty constraints while tapping local talent.[4]Madhumita Murgia, “Microsoft’s Strategic Partnership Strategy in Emerging Markets,” Financial Times, ft.com
Competition now centers on the depth of capability rather than the rate-card price. Providers with strong engineering talent, design thinking methodologies, and certifications from regulated industries outbid low-cost rivals. Hybrid Build-Operate-Transfer models invite boutique consultancies that can establish greenfield sites using lean playbooks and then hand them over to the client. As governments enact incentive frameworks, new entrants that master local compliance and recruitment enjoy a first-mover edge.
Mergers, strategic investments, and campus expansions are expected to punctuate 2025. Tata Consultancy Services unveiled a USD 200 million hub in Poland for automotive and fintech software. Infosys committed USD 300 million to three Mexican facilities serving North American customers. E&Enterprise’s USD 60 million buyout of GlassHouse Technologies extends its Middle Eastern reach. Such moves indicate a race to secure high-growth geographies and specialized labor pools before they become oversaturated.
Global Capability Centers Industry Leaders
Accenture plc
IBM Corporation
Tata Consultancy Services Limited
Cognizant Technology Solutions Corporation
Capgemini SE
- *Disclaimer: Major Players sorted in no particular order

Recent Industry Developments
- October 2025: Microsoft expanded its UAE partnership with G42, adding USD 500 million for sovereign AI infrastructure and workforce training.
- September 2025: Tata Consultancy Services inaugurated a USD 200 million, 5,000-employee center in Poland focused on automotive software and fintech digitization.
- August 2025: e and enterprise finalized a USD 60 million acquisition of GlassHouse Technologies in Turkey, establishing a delivery hub for Europe and Central Asia.
- July 2025: Infosys invested USD 300 million in three Mexican centers to bolster near-shore delivery for U.S. clients.


Global Capability Centers Market Report Scope
The scope of the global capability center study for the market segmentation by the Function/Capability for (i) Information Technology (IT) and Digital Services segment is limited to Software Development, Cloud and Infrastructure Management, Cybersecurity, Data Analytics and AI/ML; (ii) Engineering / ER&D segment is limited to Product Design and Testing, Embedded Systems, Digital Twin / Simulation; (iii) Business Process Management (BPM) segment is limited to Finance and Accounting, HR, Payroll and Talent Management, Procurement, Customer Service; and (iv)Knowledge Process Outsourcing (KPO) segment is limited to Market Research and Insights, Risk and Compliance, Legal and Regulatory Support, Strategy and Consulting Support. Similarly, for segmentation by the Engagement Model, scope for (i) Hybrid Build-Operate-Transfer (BOT) is limited to Joint Venture / Strategic Partnership and Virtual Captive Model. The rest of the segment scope is as specified for the listed segment.
| Information Technology (IT) and Digital Services |
| Engineering / ER&D |
| Business Process Management (BPM) |
| Knowledge Process Outsourcing (KPO) |
| Captive (Self-Build)/ In-house |
| Build-Operate-Transfer (BOT) |
| Hybrid Build-Operate-Transfer (BOT) |
| Large Enterprises |
| Small and Medium Enterprises (SMEs) |
| Banking, Financial Services, and Insurance (BFSI) |
| Telecom and IT |
| Healthcare and Life Sciences |
| Manufacturing, Automotive and Industrial |
| Retail and Consumer Goods |
| Other Industry Verticals |
| North America | United States |
| Canada | |
| Mexico | |
| Europe | United Kingdom |
| Germany | |
| France | |
| Poland | |
| Central and Eastern Europe | |
| Rest of Europe | |
| Asia Pacific | China |
| India | |
| Indonesia | |
| Singapore | |
| Philippines | |
| Vietnam | |
| Australia | |
| Rest of Asia Pacific | |
| Middle East and Africa | United Arab Emirates |
| Saudi Arabia | |
| South Africa | |
| Egypt | |
| Rest of Middle East and Africa | |
| South America | Brazil |
| Argentina | |
| Rest of South America |
| By Function / Capability | Information Technology (IT) and Digital Services | |
| Engineering / ER&D | ||
| Business Process Management (BPM) | ||
| Knowledge Process Outsourcing (KPO) | ||
| By Engagement Model | Captive (Self-Build)/ In-house | |
| Build-Operate-Transfer (BOT) | ||
| Hybrid Build-Operate-Transfer (BOT) | ||
| By Organization Size | Large Enterprises | |
| Small and Medium Enterprises (SMEs) | ||
| By Industry Vertical | Banking, Financial Services, and Insurance (BFSI) | |
| Telecom and IT | ||
| Healthcare and Life Sciences | ||
| Manufacturing, Automotive and Industrial | ||
| Retail and Consumer Goods | ||
| Other Industry Verticals | ||
| By Geography | North America | United States |
| Canada | ||
| Mexico | ||
| Europe | United Kingdom | |
| Germany | ||
| France | ||
| Poland | ||
| Central and Eastern Europe | ||
| Rest of Europe | ||
| Asia Pacific | China | |
| India | ||
| Indonesia | ||
| Singapore | ||
| Philippines | ||
| Vietnam | ||
| Australia | ||
| Rest of Asia Pacific | ||
| Middle East and Africa | United Arab Emirates | |
| Saudi Arabia | ||
| South Africa | ||
| Egypt | ||
| Rest of Middle East and Africa | ||
| South America | Brazil | |
| Argentina | ||
| Rest of South America | ||


Key Questions Answered in the Report
How large is the Global Capability Centers market in 2026?
The Global Capability Centers market size is USD 649.16 billion in 2026 and is projected to grow at a 7.97% CAGR through 2031.
Which function holds the largest share of the capability center spending?
Information Technology and Digital Services leads at 54.28% of 2025 revenue, reflecting ongoing demand for cloud-native engineering and AI solutions.
Which region is expanding fastest for new capability centers?
The Middle East and Africa are expected to show the highest growth, advancing at a 8.97% CAGR, driven by government technology investments and incentive programs.
What engagement model is gaining ground over traditional captives?
Hybrid Build-Operate-Transfer arrangements are growing at a 9.10% CAGR, offering enterprises flexibility while ensuring eventual control.
Why are small and medium enterprises entering the capability center arena?
Cloud-based toolchains and turnkey compliance platforms lower barriers, enabling SMEs to launch centers quickly and scale without heavy upfront capital.
Which industry vertical exhibits the fastest growth in capability centers?
Banking, financial services, and insurance are forecasted to grow at a 9.03% CAGR through 2031, driven by the adoption of digital banking, reg-tech, and risk analytics solutions.
Page last updated on:


