GCC Pneumatic Waste Management System Market Size and Share
Market Overview
| Study Period | 2020 - 2031 |
|---|---|
| Forecast Data Period | 2026 - 2031 |
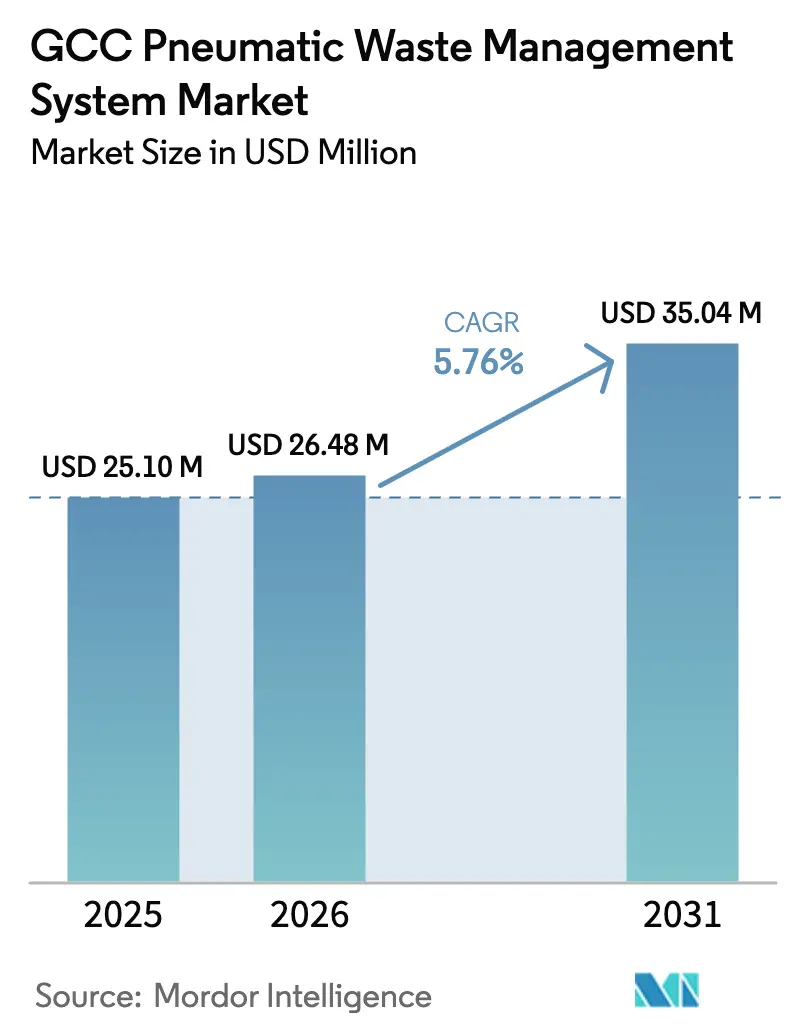
| Base Year Market Size (2025) | USD 25.10 Million |
| Market Size (2026) | USD 26.48 Million |
| Market Size (2031) | USD 35.04 Million |
| Growth Rate (2026 - 2031) | 5.76% CAGR |
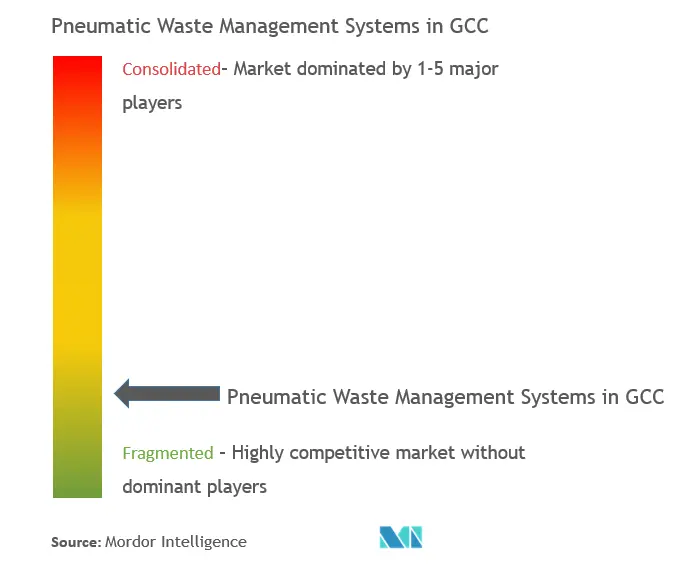
| Market Concentration | Low |
Major Players *Disclaimer: Major Players sorted in no particular order Image © Mordor Intelligence. Reuse requires attribution under CC BY 4.0. | |
GCC Pneumatic Waste Management System Market Analysis by Mordor Intelligence
The GCC Pneumatic Waste Management System Market size was valued at USD 25.10 million in 2025 and is estimated to grow from USD 26.48 million in 2026 to reach USD 35.04 million by 2031, at a CAGR of 5.76% during the forecast period (2026-2031).
Strong adoption in smart-city mega-projects, government landfill-diversion mandates, and growing labor shortages are accelerating the specification of automated waste collection systems at the master-planning stage. European incumbents still win most flagship contracts, yet Middle-Eastern engineering firms now partner with Asian suppliers to cut turnkey prices by 15–20%, eroding margins but widening the addressable base. Software layers that monitor vacuum pressure, inlet fill levels, and predictive maintenance are capturing a rising share of value as municipalities prioritize uptime over pure CapEx savings. Meanwhile, country demand is diverging: Saudi Arabia anchors revenue through Vision 2030 projects, while Oman delivers the fastest growth as secondary cities leapfrog truck fleets to hit 2030 circular-economy targets.[1]https://www.moccae.gov.ae/en/knowledge/wastes-and-chemicals
Key Report Takeaways
- By system configuration, stationary centralized networks led with 68.5% of the pneumatic waste management system in GCC market share in 2025, while hybrid and modular variants are forecast to advance at a 6.2% CAGR through 2031.
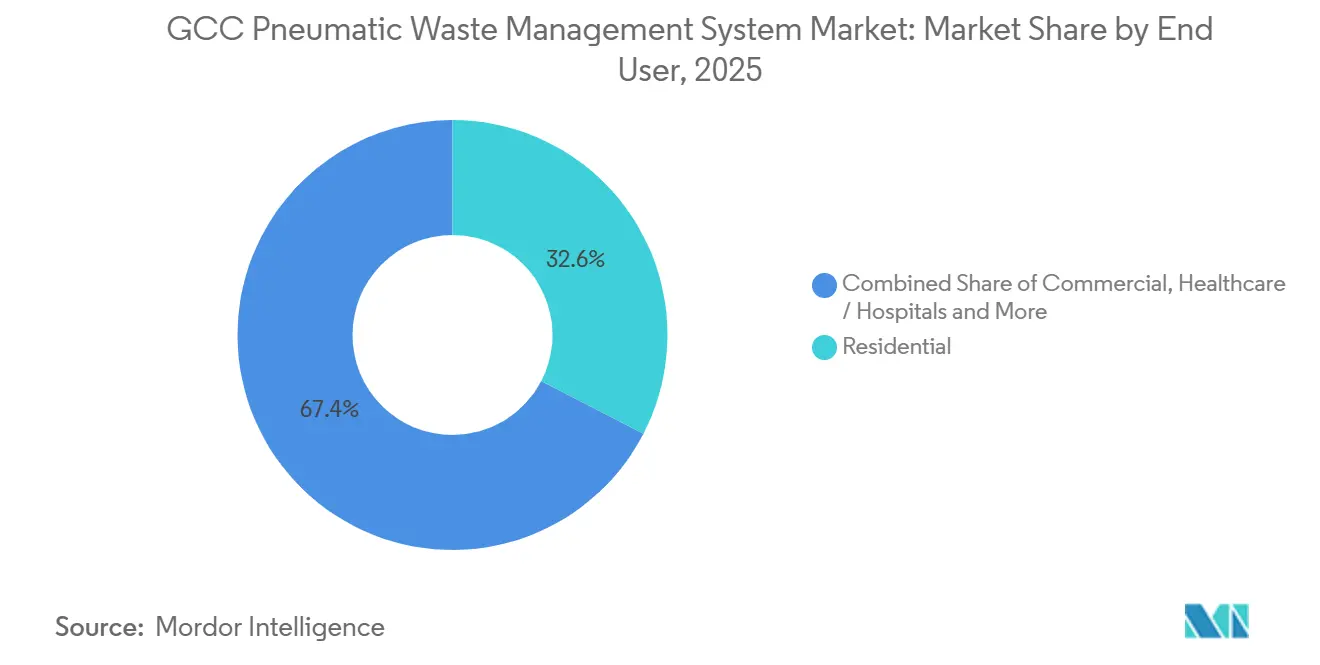
- By end user, residential developments accounted for 32.6% of 2025 demand, whereas commercial facilities are on track to expand at a 7.8% CAGR to 2031.
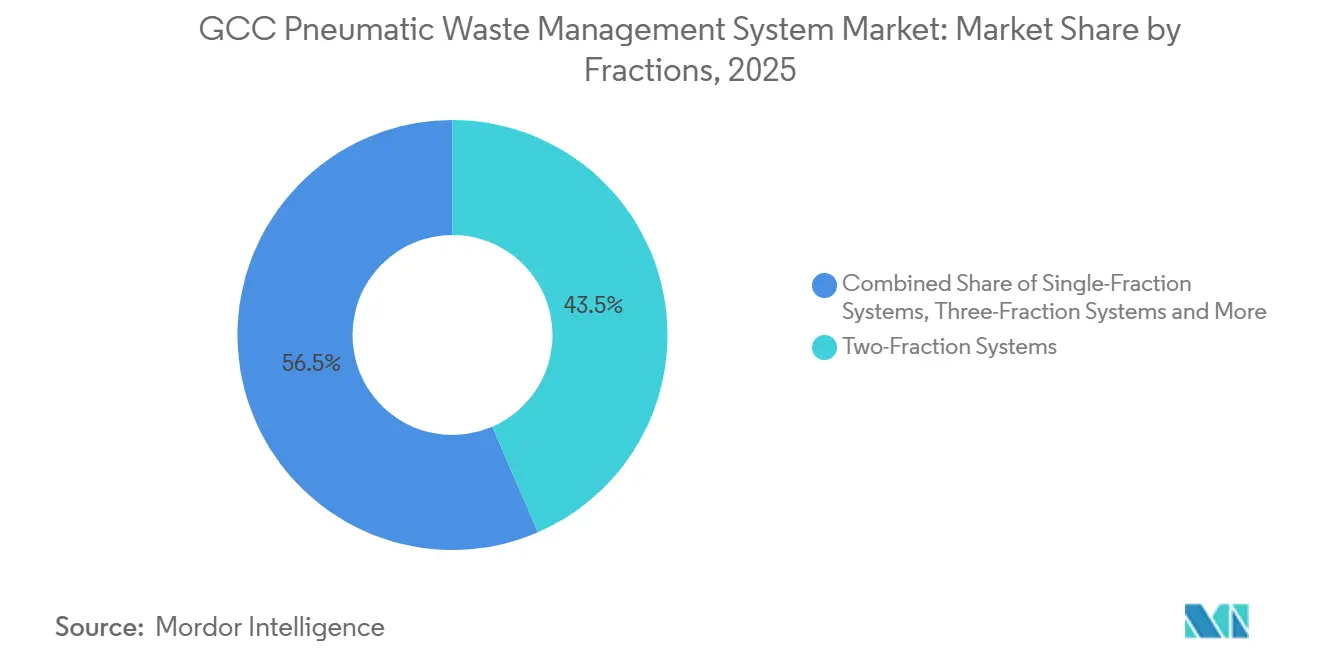
- By waste fraction, two-fraction systems dominated with a 43.5% share in 2025, yet three-fraction configurations are expected to post a 6.8% CAGR during the forecast period.
- By component, pneumatic pipes commanded a 28.9% revenue share in 2025, while control and monitoring software represented the fastest-growing segment at an 8.1% CAGR through 2031.
- By country, Saudi Arabia accounted for 48.75% of 2025 revenue, but Oman is projected to grow the fastest at a 6.4% CAGR between 2026 and 2031.
Note: Market size and forecast figures in this report are generated using Mordor Intelligence’s proprietary estimation framework, updated with the latest available data and insights as of January 2026.
GCC Pneumatic Waste Management System Market Trends and Insights
Drivers Impact Analysis*
| Drivers | (~) % Impact on CAGR Forecast | Geographic Relevance | Impact Timeline |
|---|---|---|---|
| Rapid expansion of mega-project smart cities integrating AWCS as default infrastructure | +1.8% | Saudi Arabia, UAE, Qatar | Medium term (2-4 years) |
| Government targets for ≥80% landfill-diversion by 2030 driving closed-pipe adoption | +1.5% | UAE, Saudi Arabia, Oman, Bahrain | Short term (≤2 years) |
| Scarcity of low-skill labor raising demand for automated collection | +1.2% | GCC-wide, acute in UAE and Qatar | Long term (≥4 years) |
| Integration with district cooling & IoT platforms unlocking ≥25% OPEX savings | +0.9% | UAE, Qatar | Medium term (2-4 years) |
| Post-pandemic hygiene standards in airports & hospitals favoring touch-free systems | +0.7% | Dubai, Doha, Riyadh and healthcare clusters | Short term (≤2 years) |
| PPP & turnkey O&M models lowering CapEx barriers for municipalities | +0.6% | Saudi Arabia, Oman, Bahrain | Medium term (2-4 years) |
| Source: Mordor Intelligence | |||
Rapid Expansion of Mega-Project Smart Cities Integrating AWCS as Default Infrastructure
Master-planned developments across the GCC now embed pneumatic waste networks from day one, removing costly retrofits and compressing deployment timelines. NEOM’s 170 km underground spine, Lusail City’s 13 km network moving waste at 70 km/h, and Masdar City’s renewable-powered system all showcase how AWCS co-locates with district cooling, fiber, and power to eliminate surface bins and trucks. Up-front integration spreads costs across broader utility packages, cutting payback periods compared with retrofit projects that require street excavation. Developers target LEED Platinum and WELL Building credentials, making closed-pipe collection a baseline rather than a premium add-on. This shift is turning the pneumatic waste management system in the GCC market into a default line item for any smart-city tender.[2]https://www.mme.gov.qa/webcenter/portal/MM
Government Targets for ≥80% Landfill-Diversion by 2030 Driving Closed-Pipe Adoption
Federal and emirate-level strategies now tie waste-diversion milestones to infrastructure funding cycles, pushing cities to install multi-fraction pneumatic networks rather than expand truck fleets. Dubai Municipality began enforcing Law No. 18 of 2024, and immediate penalty revenues are being funneled back into automated collection rollouts. Saudi Arabia mirrors the policy through Vision 2030 action plans that earmark closed-pipe systems for every new mega-project district. These mandates create a compliance advantage because inlet-level RFID data proves segregation performance in real time. Vendors that deliver audit-ready software, therefore, gain preferred-bidder status in tender evaluations.[3]https://www.enec.ae/
Scarcity of Low-Skill Labor Raising Demand for Automated Collection
GCC nationalization programs continue to shrink the pool of expatriate sanitation workers, lifting per-ton labor costs well above the threshold at which vacuum networks pay back within seven years. Municipal contractors in Dubai now spend USD 48 per tonne on manual curbside pickup, compared with USD 34 when pneumatic terminals run at design utilization. The swing is widest during summer heat alerts when crews work shorter shifts and overtime premiums spike. Automated systems neutralize these volatility risks by replacing daily headcount with scheduled blower cycles and occasional terminal maintenance. The resulting budget certainty appeals to finance departments that must balance waste-service costs against fluctuating oil royalties.[4]https://www.dm.gov.ae/
Integration with District Cooling and IoT Platforms Unlocking ≥25% OPEX Savings
Developers increasingly trench waste pipes alongside chilled-water mains, lowering excavation outlays and sharing shaft space for sensor cabling. Terminal rooms tap district cooling to pre-condition air, cutting standalone refrigeration loads by near one-fifth. IoT nodes feed vacuum pressure, fill level, and motor current data to cloud dashboards that schedule blower starts only when inlet clusters peak, driving energy savings that compound year over year. Predictive analytics also flags early bearing wear, allowing operators to order parts before a blower trips offline. The combined effect elevates software from a maintenance add-on to a core value driver in contract negotiations.
Restraints Impact Analysis*
| Restraints | (~) % Impact on CAGR Forecast | Geographic Relevance | Impact Timeline |
|---|---|---|---|
| High soil salinity and sand intrusion accelerating pipe and valve wear | −0.8% | UAE, Bahrain, Qatar, Saudi Arabia, Oman | Long term (≥4 years) |
| CapEx 2–4× higher than truck collection amid oil-price volatility | −0.7% | GCC-wide, acute in Oman and Bahrain | Short term (≤2 years) |
| Shortage of local vacuum-system technicians prolonging downtime | −0.5% | GCC-wide, most severe in Oman, Bahrain, Kuwait | Medium term (2-4 years) |
| Fossil-dominated grid dilutes carbon-reduction narrative | −0.3% | Saudi Arabia, Kuwait, and partially UAE | Long term (≥4 years) |
| Source: Mordor Intelligence | |||
High Soil Salinity and Sand Intrusion Accelerating Pipe and Valve Wear
Coastal salt spray and desert dust combine to corrode stainless-steel tubes 40% faster than in temperate regions, shortening component life cycles to under a decade. Each unplanned valve swap forces partial line shutdowns, triggering fallback truck pickups and erasing up to one quarter of forecast OPEX savings. Protective epoxy linings and ceramic valve seats extend longevity but add 15% to materials cost, which price-sensitive municipalities often reject. Vendors that prequalify alternative alloys or self-cleaning valve designs, therefore, gain a defensible edge in coastal tenders. The durability challenge will persist until regional standards mandate corrosion allowances in bid specifications.
CapEx 2–4× Higher Than Truck Collection Amid Oil-Price Volatility
Full-network excavation averages USD 1,000 per linear meter and concentrates spending in the first two budget years, a cash-flow profile that becomes politically contentious when Brent prices fall below the fiscal break-even. Oman and Bahrain have already postponed several city-center projects, channeling limited sovereign funds to debt service instead. Even in wealthier emirates, retrofit districts are split into phases to align with annual appropriations, stretching installation schedules by up to five years. PPP frameworks soften the blow, but still need minimum tonnage guarantees that smaller municipalities hesitate to sign. As a result, demand stalls whenever crude benchmarks remain below USD 70 for more than 2 consecutive quarters.
*Our forecasts treat driver/restraint impacts as directional, not additive. The impact forecasts reflect baseline growth, mix effects, and variable interactions.
Segment Analysis
By End User : Residential Developments Anchor Volume as Commercial Sites Accelerate
Residential complexes captured 32.6% of 2025 demand, giving the segment the largest pneumatic waste management system in the GCC market share that year. Master-developers in Riyadh, Dubai, and Abu Dhabi now bundle network costs into apartment prices, allowing buyers to perceive the infrastructure as a neighborhood amenity rather than a municipal fee. These estates typically specify full-vacuum trunk lines because inlet density exceeds 200 per km², and the resulting uniform pipe diameters simplify maintenance scheduling. Commercial facilities such as malls, offices, and hotels are the fastest-growing users, advancing at a 7.8% CAGR through 2031 as property owners bake hygiene upgrades into lease negotiations.
The commercial upswing relies on clear operating metrics: Dubai Mall reported a 40% drop in pest-control expenditures within one year of its retrofit, while Doha’s newest hospitality cluster cut waste-room labor hours by 35%. Healthcare projects, though smaller in tonnage, command per-inlet prices twice those of residential projects because stainless-steel chutes and negative-pressure terminals meet infection-control audits. Airport concessions follow a similar premium model, adding touch-free hoods and HEPA filtration to secure Civil Aviation clearances. Overall, diversified end-user demand helps smooth revenue cycles when residential launches slow in weaker real-estate years, sustaining the pneumatic waste management system in GCC market momentum.


By System/Operation Mode : Stationary Centralized Networks Dominate, Hybrids Climb
Stationary centralized layouts accounted for 68.5% of 2025 revenue, reflecting their entrenched position in high-rise clusters and making the configuration the leading pneumatic waste management system in the GCC market for installed systems. Full-vacuum models are used for mega-projects such as NEOM’s vertical districts, where waste must travel more than 2 km to remote terminals. Gravity-vacuum hybrids, however, are projected to log a 6.2% CAGR to 2031 because municipalities phase construction across budget cycles and appreciate the 30–40% lower blower horsepower these systems require.
Modular terminals packaged in 40-foot containers now let operators expand one city block at a time, an approach Muscat adopted for its coastal promenade in 2025. Hybrid rollouts also favor brownfield retrofits, where grade changes let gravity manage vertical drops and vacuum only moves horizontal legs, cutting electricity use by one-third. This design flexibility widens procurement participation by allowing medium-sized contractors to bid without investing in continuous-duty blower inventory. Consequently, hybrids are positioned to chip away at the centralized incumbent base while maintaining overall pneumatic waste management system leadership in the GCC market, with full-vacuum networks in core downtown districts.
By Fractions : Two-Fraction Leads, Three-Fraction Gains on EPR Pressure
Two-fraction schemes, which separate recyclables from residual waste, commanded a 43.5% share in 2025, the highest among configurations and therefore the largest slice of the pneumatic waste management system in the GCC market. Cities originally chose the format to minimize inlet counts and the complexity of civil works. Starting in 2024, however, the UAE and Saudi EPR rules began pushing organics into a dedicated pipe, and three-fraction networks are now forecast to grow at a 6.8% CAGR through 2031.
User behavior studies from Dubai’s Al Barsha pilot found segregation accuracy rising to 78% once physical inlet separation replaced color-coded bins, reinforcing policymakers’ confidence in enforcing producer responsibility fees. The incremental civil cost of the third fraction is offset by avoided landfill levies, which will increase from USD 19 to USD 30 per tonne under Dubai’s 2027 tariff schedule. Municipalities weighing upgrades now see a retrofit window before stricter food-waste bans arrive in 2028, which will further tilt volumes toward organics pipes. Four-fraction designs remain niche because separate glass pipes rarely earn back the extra USD 15,000 inlet cost in current commodity markets, keeping two- and three-fraction formats central to the pneumatic waste management system in GCC market trajectory.
By Component : Pipes Top Revenue, Software Delivers Fastest Growth
Pneumatic pipes accounted for 28.9% of component turnover in 2025, making them the largest contributor to the pneumatic waste management system at the hardware level in the GCC market. Underground routing through sand-prone soils drives high per-meter spend, and corrosion-resistant liners add another 10–15% in coastal sites. Despite this heft, pipe revenue will trail overall market growth as modular hybrids shorten average network length. The upside shifts to control and monitoring platforms, which are projected to post an 8.1% CAGR through 2031, driven by subscription analytics and predictive maintenance dashboards.
One Riyadh operator now streams two terabytes of inlet and blower data annually into a cloud service that guarantees 98% uptime under performance-based PPP contracts. Sensors priced below USD 30 each are embedded on every chute door, creating stickiness because software licenses bundle cybersecurity, firmware updates, and remote troubleshooting. Pumps, blowers, and valves still command a 20-22% share, but face margin compression as Asian suppliers enter with 15% lower list prices. Consequently, vendors are repositioning as data partners rather than pure equipment sellers to preserve contribution per installed tonne in the pneumatic waste management system in GCC market.
Geography Analysis
Saudi Arabia retained 48.75% of 2025 revenue, the single-largest national share of the pneumatic waste management system in the GCC market, due to Vision 2030 mega-projects that pre-specify automated collection in every new district. NEOM alone plans more than 200 km of pipes by 2030, creating predictable demand even when crude revenues dip. The United Arab Emirates followed as a mature but still lucrative arena where Dubai and Abu Dhabi now focus on retrofitting pre-2015 neighborhoods; Dubai Municipality aims to convert 25% of those districts before 2035, concentrating near-term activity in design-build retrofits that bundle IoT kits with new chutes. Omani growth is fastest at a 6.4% CAGR through 2031 as secondary cities such as Salalah and Sohar tap PPP structures to leapfrog directly to closed-pipe collection, leveraging sovereign guarantees that insulate operators from oil-price swings.
Qatar’s Lusail and Doha projects sustain a stable pipeline, though expansion outside the capital remains modest until after the 2028 Asian Games, when municipal planners expect tourist traffic to shift to new coastal suburbs. Kuwait and Bahrain trail at sub 3-4% CAGR as public-debt service diverts funds from large-scale civil works; both states instead pilot containerized terminals for event venues, buying time until fiscal balances improve. Across the bloc, procurement timing still tracks Brent crude thresholds below USD 70, yet sovereign wealth buffers in Saudi Arabia, UAE, and Qatar cushion flagship smart-city rollouts. Environmental regulators sharpen enforcement, Dubai’s landfill tariff rise in 2027 and Saudi draft EPR rules in 2025, ensuring a baseline of retrofit work even when fresh housing launches slow. Collectively, these patterns keep the pneumatic waste management system in GCC market on a diversified geographic footing, with high-value software retrofits in wealthier emirates offsetting pipe-heavy greenfields in late-adopter Omani towns.
Competitive Landscape
European specialists, led by Envac, MariMatic, Logiwaste, and Ros Roca, retained a combined 50–55% share of the pneumatic waste management system in the GCC market during 2025, leveraging extensive reference lists and certified hygienic designs. Their recent bids emphasize cloud dashboards, remote diagnostics, and multi-fraction RFID auditing because municipalities now score tenders on data transparency as much as on pipe length. Middle-Eastern engineering houses join forces with Asian component makers to shave 15–20% off turnkey prices, an approach that won contracts in secondary Saudi and Omani cities where budgets are tighter. The pricing gap is narrowing, however, as European vendors localize assembly lines in Jeddah and Abu Dhabi to cut freight and import duty costs. Overall, moderate fragmentation persists, with no single supplier holding more than 20% individually, yet scale advantages accrue to suppliers that bundle hardware, software, and multi-year O&M on a single invoice.
Strategic positioning is shifting toward service revenue. MariMatic’s 20-year O&M concession in Abu Dhabi secures annuity cash flows tied to uptime guarantees, while Envac’s Riyadh contract layers predictive-maintenance subscriptions on top of three-fraction hardware. Chinese entrants trial containerized terminals priced 30% below European benchmarks, but durability concerns in high-salinity coastal zones limit adoption to inland pilot sites. Local contractors, meanwhile, differentiate on response speed by staffing city-based maintenance hubs; Ecosir’s 2025 Muscat depot cut blower repair lead times from seven to three days, winning praise in PPP performance audits. Software continues to tilt the playing field because IoT analytics deliver measurable energy and labor savings that purchasing committees can defend in budget hearings.
Innovation pipelines center on corrosion-proof materials, self-cleaning valve assemblies, and AI-driven waste-flow prediction. Logiwaste’s ceramic-lined elbow joint, launched in 2025, claims 50% longer life in salt-spray tests, while Aerbin’s RFID retrofit kit enabled Dubai pilots to introduce pay-as-you-throw tariffs without changing inlet casings. Vendors also court district-cooling operators; Jets Vacuum’s co-location deal in Abu Dhabi saved 22% in trenching costs and opened cross-selling into chilled-water metering. Competitive intensity is therefore rising on both technology and financing fronts, yet brand trust and proven GCC climate performance remain decisive tie-breakers in flagship smart-city awards.
GCC Pneumatic Waste Management System Industry Leaders
Envac AB
MariMatic Oy
Logiwaste AB
Ros Roca Envirotec
Urban Refuse Development (URD)
- *Disclaimer: Major Players sorted in no particular order

Recent Industry Developments
- January 2026: Smart-waste technology firm Sensoneo confirmed it will exhibit its fill-level sensors, bin-access management, and route-optimisation suite at IFAT Saudi Arabia 2026 in Riyadh, signalling plans to layer IoT analytics onto future pneumatic networks in Saudi Arabia.
- November 2025: Envac presented upgraded automated waste-collection systems for high-density residential, hospital and airport projects at Cityscape Global 2025 in Riyadh, underscoring continuing interest from GCC real-estate developers.
- October 2025: Qatar’s Ministry of Municipality launched a pilot programme installing underground waste containers in busy Doha districts; the initiative aims to scale automated, hygienic waste-collection technologies city-wide after evaluation.
- February 2025: Envac announced deployment of its next-generation underground pneumatic waste-collection system at Riyadh’s King Abdullah Financial District, expanding Saudi Arabia’s flagship smart-city infrastructure.


GCC Pneumatic Waste Management System Market Report Scope
A pneumatic waste system transports waste at high speed through underground pneumatic tubes to a collection station, where it is made compact and sealed in containers. It is a mechanical system for conveying solid waste through transport pipes.
The pneumatic waste management system market is segmented by end user (residential, commercial, industrial, and others) and by country (Saudi Arabia, Qatar, United Arab Emirates, and the Rest of GCC). The report offers market sizes and forecasts in value (USD) for all the above segments.
| Residential |
| Commercial (offices, retail, hospitality) |
| Healthcare / Hospitals |
| Transport & Public Infrastructure (airports, metro/rail stations, large hubs) |
| Others (Institutional, Industrial, etc.) |
| Stationary Centralised Systems | Full Vacuum Systems |
| Gravity Vacuum Systems | |
| Hybrid / Modular Systems | |
| Mobile / Temporary Units |
| Single-Fraction Systems |
| Two-Fraction Systems |
| Three-Fraction Systems |
| Four-Fraction Systems |
| Five-Fraction & Higher Systems |
| Pneumatic Pipes |
| Collection Inlets / Chutes |
| Valve & Gate Assemblies |
| Vacuum Pumps & Blowers |
| Control & Monitoring Software |
| Transfer / Collection Terminals |
| Others (Collection station equipment, Sensors, SCADA, etc.) |
| Saudi Arabia |
| United Arab Emirates |
| Qatar |
| Oman |
| Kuwait |
| Bahrain |
| By End User | Residential | |
| Commercial (offices, retail, hospitality) | ||
| Healthcare / Hospitals | ||
| Transport & Public Infrastructure (airports, metro/rail stations, large hubs) | ||
| Others (Institutional, Industrial, etc.) | ||
| By System/ Operation Mode | Stationary Centralised Systems | Full Vacuum Systems |
| Gravity Vacuum Systems | ||
| Hybrid / Modular Systems | ||
| Mobile / Temporary Units | ||
| By Fractions | Single-Fraction Systems | |
| Two-Fraction Systems | ||
| Three-Fraction Systems | ||
| Four-Fraction Systems | ||
| Five-Fraction & Higher Systems | ||
| By Component | Pneumatic Pipes | |
| Collection Inlets / Chutes | ||
| Valve & Gate Assemblies | ||
| Vacuum Pumps & Blowers | ||
| Control & Monitoring Software | ||
| Transfer / Collection Terminals | ||
| Others (Collection station equipment, Sensors, SCADA, etc.) | ||
| By Country | Saudi Arabia | |
| United Arab Emirates | ||
| Qatar | ||
| Oman | ||
| Kuwait | ||
| Bahrain | ||


Key Questions Answered in the Report
What is the current size of the pneumatic waste management system in GCC market?
It stands at USD 26.48 million in 2026 and is projected to reach USD 35.04 million by 2031.
Which country contributes the most revenue today?
Saudi Arabia leads, holding 48.75% of 2025 turnover thanks to Vision 2030 mega-project pipelines.
Which end-user segment is expanding the fastest?
Commercial facilities such as malls, offices, and hotels are forecast to grow at a 7.8% CAGR through 2031.
How are PPP models influencing adoption?
Twenty-year service concessions shift capital risk to private operators, enabling secondary cities to deploy systems despite tight municipal budgets.
Why is software becoming more important than hardware?
IoT monitoring and predictive maintenance cut energy and downtime costs, causing control platforms to outpace pipe and blower sales at an 8.1% CAGR.
What is the biggest technical hurdle in coastal GCC projects?
High soil salinity accelerates pipe corrosion, shortening component life to under 10 years unless epoxy-lined or ceramic parts are specified.
Page last updated on:


