Gaming Console Hardware Market Size and Share
Market Overview
| Study Period | 2020 - 2031 |
|---|---|
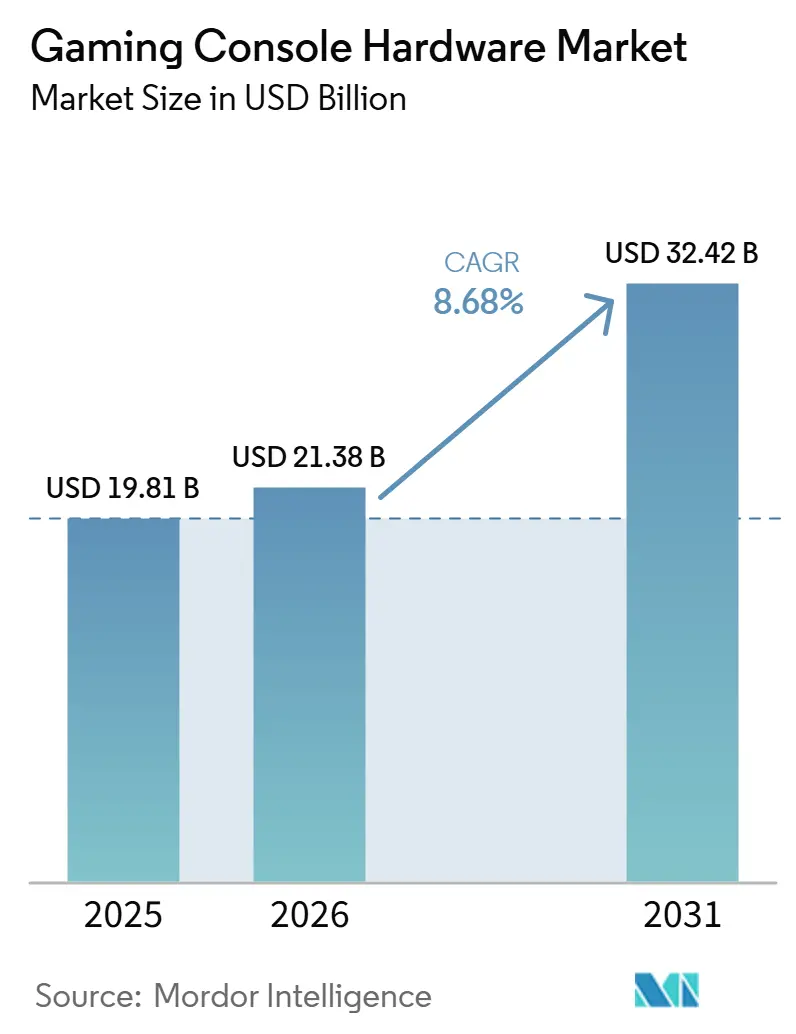
| Market Size (2026) | USD 21.38 Billion |
| Market Size (2031) | USD 32.42 Billion |
| Growth Rate (2026 - 2031) | 8.68% CAGR |
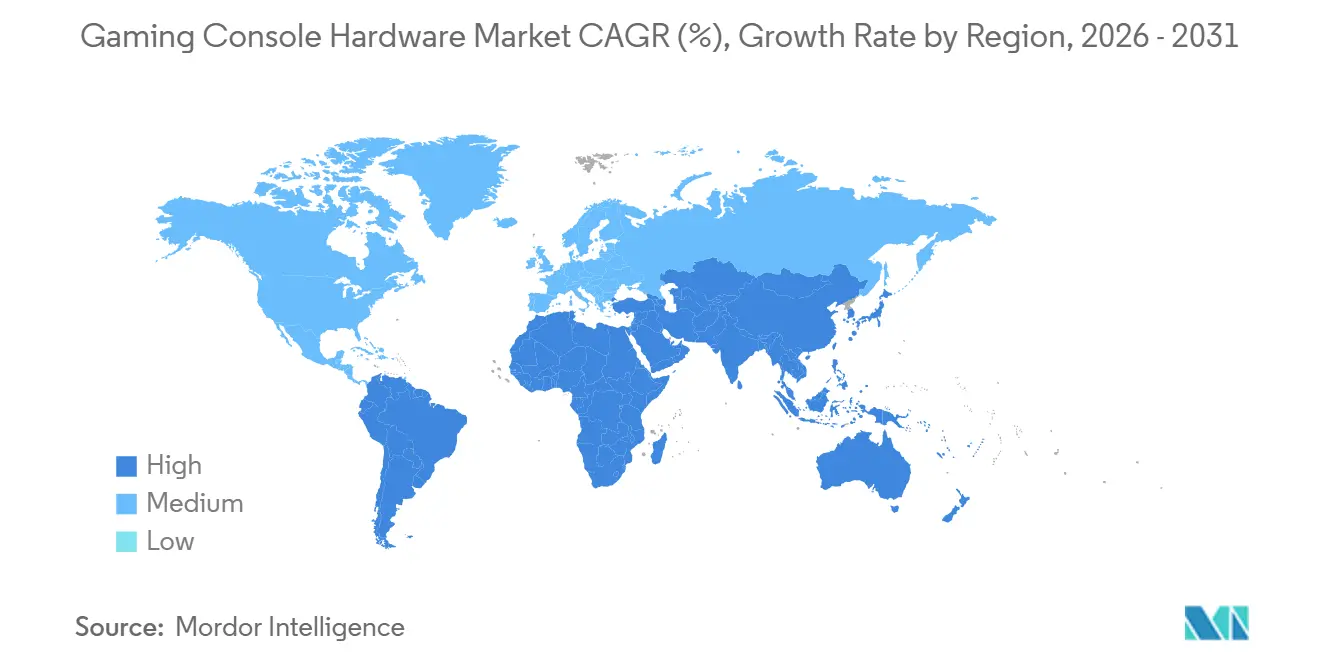
| Fastest Growing Market | Asia-Pacific |
| Largest Market | North America |
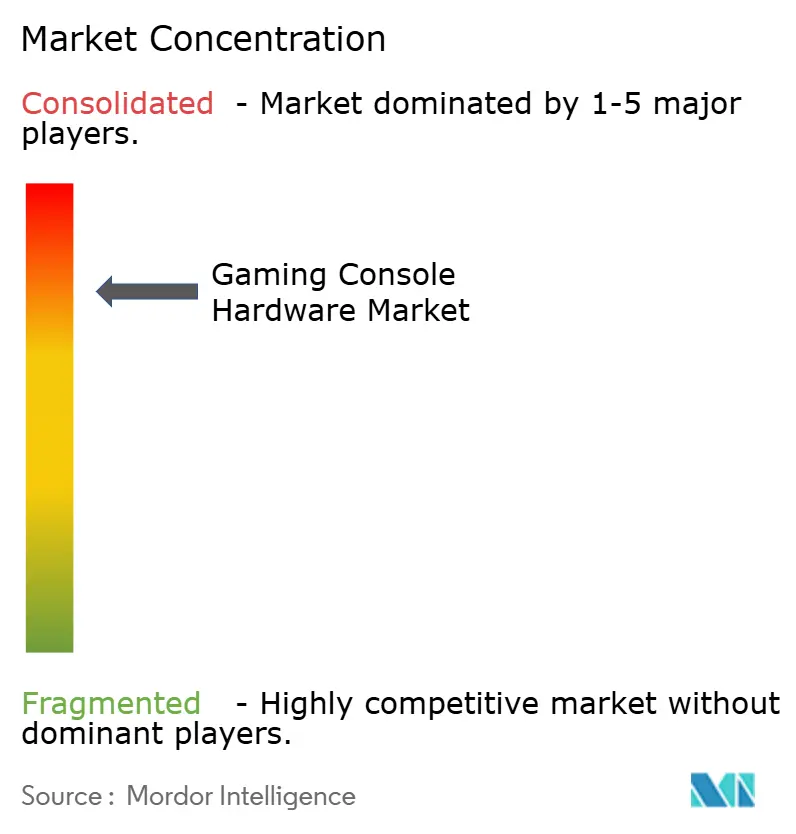
| Market Concentration | High |
Major Players *Disclaimer: Major Players sorted in no particular order Image © Mordor Intelligence. Reuse requires attribution under CC BY 4.0. | |
Gaming Console Hardware Market Analysis by Mordor Intelligence
The Gaming Console Hardware Market size is expected to increase from USD 19.81 billion in 2025 to USD 21.38 billion in 2026 and reach USD 32.42 billion by 2031, growing at a CAGR of 8.68% over 2026-2031. The gaming console hardware market is expanding because consumers continue to spend on premium home gaming systems that sit at the center of the living room entertainment setup. The gaming console hardware market is also benefiting from stronger digital ecosystems, where subscriptions, game libraries, and online services make the hardware more valuable over time. Portable and hybrid play is widening the addressable audience, because many buyers now want one device that works both at home and on the move. North America remained at the largest revenue base in 2025, while Asia-Pacific is set to deliver the fastest pace of expansion through 2031. Growth in the gaming console hardware market still faces pressure from rising component costs and from mobile and cloud gaming options that appeal to price-sensitive users.
Key Report Takeaways
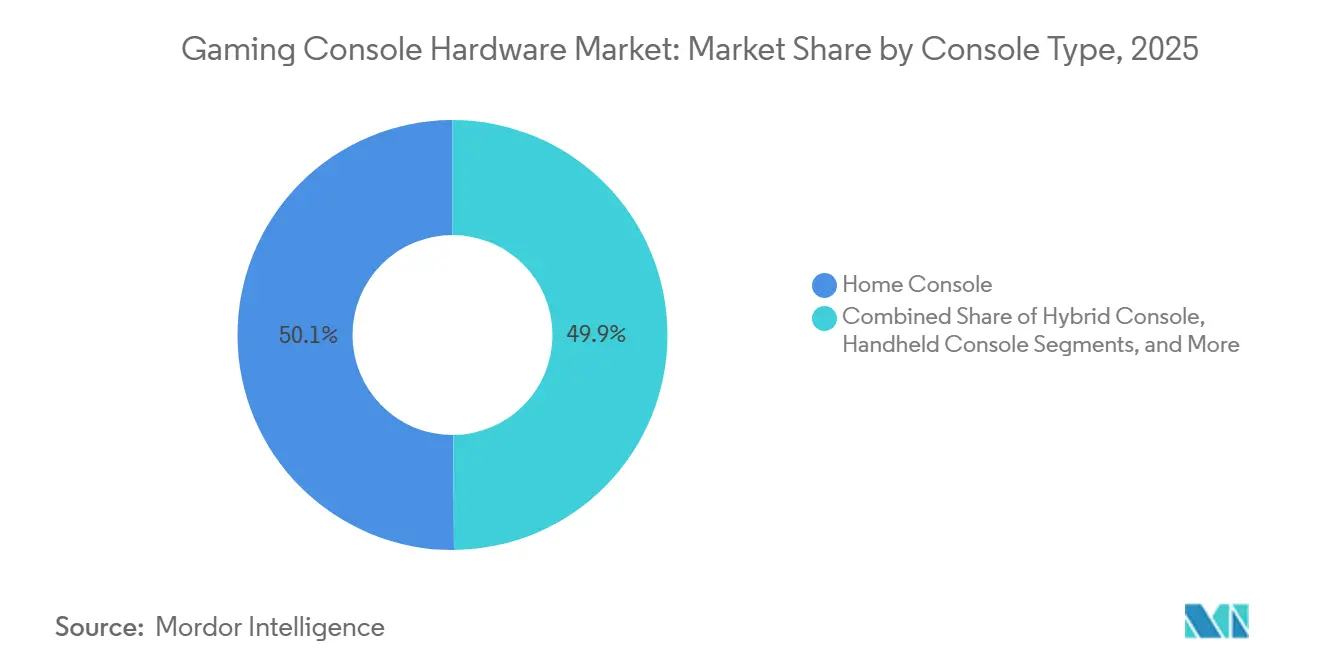
- By console type, home consoles held 50.11% of the gaming console hardware market share in 2025, while hybrid consoles are projected to expand at a 12.42% CAGR through 2031.
- By component, processing components accounted for 34.87% share in 2025, while storage devices are expected to record the fastest growth at 11.65% CAGR through 2031.
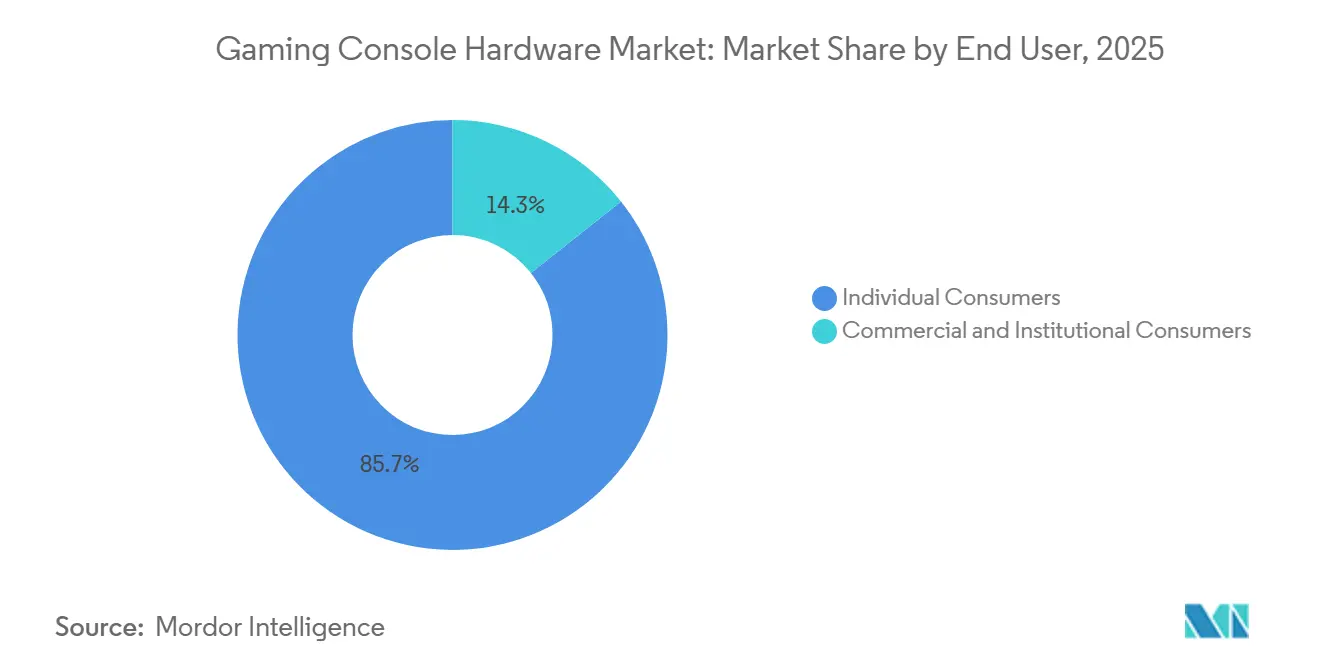
- By end user, individual consumers represented 85.66% of demand in 2025, while commercial and institutional consumers are projected to expand at a 10.92% CAGR through 2031.
- By geography, North America held 44.46% share of the gaming console hardware market size in 2025, while Asia-Pacific is projected to advance at a 9.54% CAGR through 2031.
Note: Market size and forecast figures in this report are generated using Mordor Intelligence’s proprietary estimation framework, updated with the latest available data and insights as of January 2026.
Global Gaming Console Hardware Market Trends and Insights
Drivers Impact Analysis*
| Driver | (~) % Impact on CAGR Forecast | Geographic Relevance | Impact Timeline |
|---|---|---|---|
| Rising Demand for Premium Living Room Gaming Experiences | +2.3% | North America and Western Europe, with strong presence in Japan and Australia | Short term (≤ 2 years) |
| Expansion of Cross-Platform Game Libraries and Digital Ecosystems | +1.6% | Global, North America and Europe lead platform adoption | Medium term (2-4 years) |
| Growth in Portable and Hybrid Gaming Use Cases | +1.8% | Global, APAC-led demand, North America contributing strongest revenue per unit | Short term (≤ 2 years) |
| Console Attached Services Monetization Strengthening Hardware Pull | +1.1% | North America and EU core, emerging-market spillover via digital storefronts | Medium term (2-4 years) |
| Edge AI Enabled System Personalization and On-Device Upscaling Features | +0.7% | Global, concentrated in markets with high-end 4K and 8K display penetration | Long term (≥ 4 years) |
| Source: Mordor Intelligence | |||
Rising Demand For Premium Living Room Gaming Experiences
The gaming console hardware market is moving further toward premium home entertainment systems rather than low-cost commodity boxes. Platform owners are aligning their devices with high-end televisions, better graphics output, and stronger in-home digital experiences, which supports higher average selling prices. Sony stated that PSSR 2.0 became available on PS5 Pro in March 2026, showing that image reconstruction and AI-assisted visual performance are now part of how premium console hardware is being positioned to buyers.[1]Sony Interactive Entertainment, “PlayStation Blog: PSSR 2.0 Now Available on PS5 Pro,” PlayStation Blog, blog.playstation.com This changes the purchase logic in the gaming console hardware market, because many users now judge value through the overall experience, not only through base specifications. Buyers in this tier usually replace devices less often, but they are still willing to pay more for improved performance, storage expansion, and smoother access to premium content ecosystems. That combination supports revenue growth even when annual hardware volumes do not rise at the same pace.
Expansion Of Cross-Platform Game Libraries and Digital Ecosystems
The gaming console hardware market is also being shaped by a broader shift toward cross-platform continuity and service-led engagement. Microsoft introduced Foundation Mode for PlayFab at GDC 2026, giving developers unified player identity, cross-platform progression, live-service tools, and game economy support across Xbox, PlayStation, Nintendo Switch, Steam, Epic Games Store, and mobile.[2]Microsoft Developer Blog, “GDC 2026: Introducing Foundation Mode for PlayFab,” Microsoft Developer Blog, developer.microsoft.com That move shows that the hardware sale now sits inside a larger relationship built around digital accounts, persistent libraries, and service access. The gaming console hardware market therefore gains support when users know their purchases, progress, and social connections can extend across devices and sessions. At the same time, platform owners still protect parts of their hardware identity through exclusive content and differentiated service bundles, so the market is not moving toward full hardware sameness. This balance between openness and controlled differentiation keeps users engaged without removing the reason to choose one console family over another.
Growth In Portable And Hybrid Gaming Use Cases
Portable and hybrid demand is a major force behind the gaming console hardware market during the current cycle. Nintendo reported that Switch 2 launched globally on June 5, 2025, sold 3.5 million units in its first 4 days, and reached 19.86 million cumulative units by March 31, 2026, with software sales of 48.71 million units during the same period.[3]Nintendo Co., Ltd., “Full-Year Financial Results for Fiscal Year Ended March 31, 2026 (FY2026),” Nintendo Investor Relations, nintendo.co.jp Those results confirm that a flexible form factor can bring together dedicated players, family users, and portable-first buyers inside one product line. The gaming console hardware market benefits from this model because it removes the need for separate purchases across home and handheld categories for many households. Hybrid hardware also raises software and accessory spending potential, since users stay connected to the same content library in both use cases. This demand pattern is likely to remain durable because it reflects a clear preference for convenience without giving up premium game access.
Console Attached Services Monetization Strengthening Hardware Pull
The gaming console hardware market is increasingly tied to recurring digital revenue instead of one-time hardware economics alone. Microsoft said in June 2026 that Xbox Game Pass returned to subscriber growth after more than 8 months of decline following catalog and pricing adjustments. Nintendo reported that digital sales for dedicated video game platforms rose 25.0% year on year to JPY 407.6 billion, which was approximately USD 2.79 billion, in FY2026, while overseas sales accounted for 76.9% of total company revenue. These figures show that hardware launches now operate as entry points into long-running digital relationships. The gaming console hardware market gains support from that setup because subscription and digital content revenue can soften the effect of bill-of-materials inflation on hardware strategy. It also means platform owners can justify aggressive hardware investment when they expect stronger downstream returns from services, software, and add-on spending.
Restraints Impact Analysis*
| Restraint | (~) % Impact on CAGR Forecast | Geographic Relevance | Impact Timeline |
|---|---|---|---|
| High Upfront Hardware Cost Relative to Cloud Gaming Alternatives | -1.8% | Global, most acute in South America, Southeast Asia, South Asia, and Middle East and Africa | Short term (≤ 2 years) |
| Semiconductor Supply Dependence and Component Cost Volatility | -1.4% | Global, amplified in regions dependent on TSMC-manufactured SoCs and NAND flash sourcing | Medium term (2-4 years) |
| Content Fragmentation Across Exclusive Titles and Subscription Tiers | -0.7% | North America and Europe, where multi-platform subscription fatigue is most measurable | Medium term (2-4 years) |
| Consumer Migration Toward Mobile and PC Gaming in Price-Sensitive Markets | -0.5% | South America, Southeast Asia, South Asia, Middle East and Africa | Long term (≥ 4 years) |
| Source: Mordor Intelligence | |||
High Upfront Hardware Cost Relative To Cloud Gaming Alternatives
The gaming console hardware market faces a direct adoption limit when upfront device prices rise faster than many households can absorb. Nintendo announced global price increases for Nintendo Switch 2 in May 2026, including Japan from JPY 49,980 to JPY 59,980, which was approximately USD 342 to USD 411 at JPY 146 per USD, the United States from USD 449.99 to USD 499.99, and Europe from EUR 469.99 to EUR 499.99, which was approximately USD 510 to USD 543 at a EUR to USD rate of 1.086. That price movement shows how quickly component and logistics pressure can move into retail pricing. In the gaming console hardware market, premium buyers often stay active, but entry and sub-premium demand becomes more exposed when users compare dedicated hardware with mobile gaming or cloud access that requires less initial spending. This matters most in South America, South Asia, Southeast Asia, and parts of the Middle East and Africa, where income sensitivity remains higher. If that gap widens further, lower-cost alternatives will continue to limit first-time console adoption.
Semiconductor Supply Dependence And Component Cost Volatility
The gaming console hardware market remains tied to a concentrated semiconductor and memory supply chain that platform owners cannot easily replace or diversify during a product cycle. Modern console designs depend on customized silicon, specialized memory, and long procurement commitments, so upstream cost changes can affect retail pricing, shipment plans, and launch timing. AMD said in January 2026 that its semi-custom SoC for the next-generation Xbox was progressing well to support a 2027 launch, which highlights how far ahead major platform programs must secure core chip development and production capacity.[4]AMD, “Q4 2025 Earnings Conference Call,” AMD Investor Relations, amd.com This long planning window makes the gaming console hardware market vulnerable when foundry access tightens or memory pricing rises sharply. It also means that cost inflation is not only a short-term inventory issue, because hardware makers cannot quickly redesign platforms or shift suppliers once architectures are locked. As a result, component volatility can slow unit growth even when underlying player demand remains healthy.
*Our forecasts treat driver/restraint impacts as directional, not additive. The impact forecasts reflect baseline growth, mix effects, and variable interactions.
Segment Analysis
By Console Type: Hybrid Momentum Reshapes A Home Console-Anchored Market
Home consoles held 50.11% of the gaming console hardware market in 2025, confirming that the living room remains the primary setting for premium console play. This segment continued to anchor the gaming console hardware market because Sony and Microsoft stayed focused on high-performance systems supported by accessories, storage upgrades, and online service layers. Home devices also capture larger spending per household, since buyers often add extra controllers, licensed accessories, and subscription plans after the initial hardware purchase. That combination keeps this category central to overall revenue even as play patterns continue to broaden.
Handheld consoles still serve a dedicated audience in the gaming console hardware market, especially in places where portable gaming has long been part of everyday behavior. Their role remains distinct, but they now sit closer to hybrid devices on both price and function. Hybrid consoles are projected to grow at a 12.42% CAGR through 2031, making them the fastest-moving console type during the forecast period. Nintendo reported that Switch 2 reached 19.86 million cumulative units by March 31, 2026, which gives the hybrid format a strong installed-base foundation for further growth. That performance shows why the gaming console hardware market is shifting toward devices that support both docked and portable use without breaking software continuity. Other console types, including micro-consoles and TV boxes, remain niche options that mainly appeal to lower-cost entry demand in selected emerging markets.


By Component: Processing Silicon Anchors Value While Storage Growth Accelerates
Processing components held 34.87% share in the gaming console hardware market in 2025, reflecting the value attached to CPUs, GPUs, and system-on-chip design in modern platforms. This category stayed at the center of product differentiation because performance, graphics capability, and software optimization all begin with the underlying silicon architecture. The gaming console hardware industry also depends on these components more than any other hardware layer when setting generational capability boundaries. Platform owners therefore treat chip design decisions as long-cycle strategic commitments, not routine bill-of-materials choices. That is why processing still captures the largest value share even when other parts of the system evolve more visibly to end users.
Storage devices are projected to grow at an 11.65% CAGR through 2031, making them the fastest-growing component segment in the gaming console hardware market. The main driver is simple, because game installation sizes have expanded and many players now need extra local capacity much earlier in the ownership cycle. Current-generation platforms also normalize user-managed storage expansion through licensed NVMe options, which turns storage from a passive internal part into an active spending category. This creates room for official accessory programs and for premium expansion products that can command very high price points when supply conditions are tight. The others category, which includes display and connectivity components, benefits from greater 4K and 8K screen adoption as users build broader entertainment setups around their consoles.
By End User: Consumer Demand Dominates While Institutional Use Builds Scale
Individual consumers accounted for 85.66% of demand in the gaming console hardware market in 2025, leaving the category firmly rooted in household purchasing behavior. That dominance reflects the fact that the gaming console hardware market still revolves around personal entertainment, family gaming, and enthusiast spending. Within that large base, spending patterns differ clearly across early adopters, value-oriented family buyers, and competitive users who add peripherals and digital services at a higher rate. These differences matter because they shape average revenue per user well beyond the base device sale. They also help explain why subscription attach, accessory spending, and upgrade interest can vary sharply across otherwise similar households.
Commercial and institutional consumers are projected to grow at a 10.92% CAGR through 2031, making them the fastest-growing end-user group in the gaming console hardware market. Universities, esports venues, hospitality operators, and education settings are all widening the use of console hardware in managed environments. This part of the gaming console hardware industry is still small in value terms, but it is becoming more visible because institutions want standardized hardware that is familiar, durable, and content-ready. That creates demand for deployment models that are easier to manage than consumer setups built for a single household. It also leaves open space for vendors that can tailor accessories, compliance settings, and support packages for multi-user environments.
Geography Analysis
North America held 44.46% of the gaming console hardware market size in 2025, which kept it as the largest regional revenue contributor. The region benefits from high household disposable income, wide broadband access, and a deeply established gaming culture that supports steady software and service spending alongside hardware purchases. The gaming console hardware market in the United States is especially important because premium buyers there have shown stronger tolerance for price increases than users in many other regions. Canada adds stable demand through similar purchasing patterns, while Mexico remains meaningful but more sensitive to rising hardware costs. These conditions make North America the most important region for platform owners that want to pair premium devices with recurring digital revenue.
Asia-Pacific is projected to expand at a 9.54% CAGR through 2031, making it the fastest-growing region in the gaming console hardware market. Nintendo reported that Switch 2 sold 3.5 million units in its first 4 days globally and reached 19.86 million units by March 31, 2026, which underlines the strength of hybrid and portable demand patterns that are especially relevant across this region. Japan remains central because local buying behavior supports dedicated console play and responds strongly to major hardware launches. The gaming console hardware market in South Korea is also supported by a strong game development base and growing attention to console-oriented content. India and Australia present different kinds of opportunity, with India tied more to rising urban purchasing power and broadband expansion, and Australia tied more to premium spending patterns closer to North America.
Europe held a stable position in the gaming console hardware market in 2025, with Germany, the United Kingdom, France, Italy, and Spain forming the core national demand base. The region combines mature consumer demand with a regulatory setting that can shape storefront, library, and subscription practices over time. South America remains an opportunity area, but currency volatility, import duties, and price sensitivity still favor lower-cost routes into gaming over premium hardware adoption. The Middle East is gaining attention through gaming infrastructure investment, while Africa remains at an early stage where mobile platforms still dominate entertainment spending across most countries.

Competitive Landscape
The gaming console hardware market operates as a concentrated platform oligopoly led by Sony, Microsoft, and Nintendo, while the surrounding component, accessory, and peripheral layers remain much more fragmented. That split defines competition in the gaming console hardware market, because a few platform owners control the core device ecosystems, but many suppliers compete around them. Sony said PSSR 2.0 became available on PS5 Pro in March 2026, showing how AI-assisted image reconstruction is now part of hardware-level differentiation instead of a software-only enhancement. This kind of upgrade matters because it helps vendors extend product relevance without waiting for a full generation reset. It also shows that technical differentiation in the gaming console hardware market is shifting toward smarter use of existing silicon, not only toward raw power increases.
Competitive positioning in the gaming console hardware market centers on exclusive content, service depth, and ecosystem convenience. Microsoft confirmed at its Xbox Games Showcase on June 7, 2026, that Gears of War: E-Day and Clockwork Revolution would remain Xbox console exclusives, which signaled a firmer return to hardware-led differentiation. Microsoft also introduced Foundation Mode for PlayFab, which extends cross-platform service capability beyond a single console family and gives the company another way to deepen ecosystem relevance. Nintendo, meanwhile, strengthened its position through the scale of Switch 2 hardware and software adoption and through rising digital sales tied to dedicated platforms. These moves show that leading companies are not competing on one dimension alone, because each is blending hardware, software, and services to hold users inside its ecosystem.
The gaming console hardware market still leaves white space in the institutional and commercial layer, where no company has fully defined a purpose-built managed console offer for venues, campuses, or hospitality use. Third-party accessory makers such as Logitech, Razer, Corsair, and HyperX face added pressure as first-party ecosystems expand around official controllers, storage, and other peripherals. Long silicon development cycles also raise the strategic value of upstream partnerships, because core design and production access can shape competitive timing years before any consumer launch. That makes the gaming console hardware market concentrated at the top, but still open in surrounding tiers where specialized suppliers can compete on features, compatibility, and deployment support.
Gaming Console Hardware Industry Leaders
Sony Group Corporation
Microsoft Corporation
Nintendo Co., Ltd.
Valve Corporation
ASUStek Computer Inc.
- *Disclaimer: Major Players sorted in no particular order

Recent Industry Developments
- June 2026: Microsoft held its Xbox Games Showcase 2026 on June 7, announcing the Xbox Series X25 Limited Edition console, a 25th-anniversary model with translucent design elements, and the Xbox Wireless Controller X25 Special Edition, both planned for select markets in November 2026. Gears of War: E-Day and Clockwork Revolution were confirmed as permanent Xbox console exclusives, not available on PlayStation 5 or Nintendo Switch 2, reversing Microsoft's prior multiplatform posture and re-establishing hardware identity as a core competitive differentiator.
- June 2026: Microsoft's "Next 100 Days" strategic disclosure on June 10 confirmed that Xbox Game Pass resumed subscriber growth after more than 8 months of decline, following catalog and pricing adjustments. The document also outlined Project Helix, a next-generation Xbox architecture designed as a "premium standardized gaming PC" supporting both Xbox and PC storefronts via a Unified Game Development Kit, with developer hardware kits planned for 2027 and a consumer release targeted around 2028.
- May 2026: Nintendo announced global price increases for Nintendo Switch 2, effective May 25, 2026, in Japan from JPY 49,980 to JPY 59,980 (USD 342 to USD 411 at JPY 146 per USD), from September 1, 2026, in the United States from USD 449.99 to USD 499.99, and from September 1, 2026, in Europe from EUR 469.99 to EUR 499.99 (USD 510 to USD 543 at a EUR to USD rate of 1.086). Nintendo cited rising component and logistics costs as the primary driver.
- May 2026: Valve Corporation raised the price of the Steam Deck OLED 512GB model from USD 549 to USD 789, and the 1TB model from USD 649 to USD 949, representing increases of 43.7% and 46.2%, respectively, attributing the change to global NAND flash memory cost inflation.
- March 2026: Sony Interactive Entertainment launched PSSR 2.0 on PS5 Pro on March 16, 2026. Developed through Project Amethyst and running on a new neural network architecture distinct from the launch version of PSSR, the upgraded upscaling system materially improves image reconstruction quality and informs the AI upscaling architecture expected in the PlayStation 6.
- March 2026: SanDisk launched the Optimus GX PRO 850P NVMe SSD, an officially licensed PS5 storage expansion product in 1TB to 8TB configurations. The 8TB model was priced at USD 2,959.99, and the 4TB model at USD 1,499.99, highlighting the severity of NAND flash cost inflation.


Global Gaming Console Hardware Market Report Scope
The Gaming Console Hardware Market Report is Segmented by Component (Controllers and Input Devices, Processing Components (CPU, GPU, SoC), Storage Devices, Console Accessories, and Others),Console Type (Home Consoles, Handheld Consoles, Hybrid Consoles, andOther Console Types), End-User (Individual Consumers, Commercial and Institutional Consumers), and Geography (North America, South America, Europe, Asia-Pacific, Middle East, and Africa). The Market Forecasts are Provided in Terms of Value (USD).
| Controllers and Input Devices |
| Processing Components (CPU, GPU, SoC) |
| Storage Devices |
| Console Accessories |
| Other Components (Display and Connectivity Components, etc.) |
| Home Consoles |
| Handheld Consoles |
| Hybrid Consoles |
| Other Console Types (Micro-Consoles / TV Boxes) |
| Individual Consumers |
| Commercial and Institutional Consumers |
| North America | United States |
| Canada | |
| Mexico | |
| South America | Brazil |
| Argentina | |
| Chile | |
| Rest of South America | |
| Europe | Germany |
| United Kingdom | |
| France | |
| Italy | |
| Spain | |
| Rest of Europe | |
| Asia-Pacific | China |
| Japan | |
| India | |
| South Korea | |
| Australia | |
| Rest of Asia-Pacific | |
| Middle East | Saudi Arabia |
| United Arab Emirates | |
| Qatar | |
| Rest of Middle East | |
| Africa | South Africa |
| Egypt | |
| Nigeria | |
| Rest of Africa |
| By Component | Controllers and Input Devices | |
| Processing Components (CPU, GPU, SoC) | ||
| Storage Devices | ||
| Console Accessories | ||
| Other Components (Display and Connectivity Components, etc.) | ||
| By Console Type | Home Consoles | |
| Handheld Consoles | ||
| Hybrid Consoles | ||
| Other Console Types (Micro-Consoles / TV Boxes) | ||
| By End User | Individual Consumers | |
| Commercial and Institutional Consumers | ||
| By Geography | North America | United States |
| Canada | ||
| Mexico | ||
| South America | Brazil | |
| Argentina | ||
| Chile | ||
| Rest of South America | ||
| Europe | Germany | |
| United Kingdom | ||
| France | ||
| Italy | ||
| Spain | ||
| Rest of Europe | ||
| Asia-Pacific | China | |
| Japan | ||
| India | ||
| South Korea | ||
| Australia | ||
| Rest of Asia-Pacific | ||
| Middle East | Saudi Arabia | |
| United Arab Emirates | ||
| Qatar | ||
| Rest of Middle East | ||
| Africa | South Africa | |
| Egypt | ||
| Nigeria | ||
| Rest of Africa | ||


Key Questions Answered in the Report
What is the gaming console hardware market size through 2031?
The gaming console hardware market size stands at USD 21.38 billion in 2026 and is forecast to reach USD 32.42 billion by 2031, at an 8.68% CAGR over 2026-2031.
Which console type leads revenue today?
Home consoles led with 50.11% share in 2025, supported by premium living room gaming, strong accessory spending, and subscription attach.
Which component is growing the fastest?
Storage devices are expected to post the fastest growth at an 11.65% CAGR through 2031, driven by larger game files and more storage expansion upgrades.
Who buys most gaming console hardware?
Individual consumers remain the dominant buyer group, accounting for 85.66% of demand in 2025, while commercial and institutional users are growing faster.
Which region is growing the fastest for consoles?
Asia-Pacific is projected to expand at a 9.54% CAGR through 2031, helped by strong hybrid demand and continued growth in key gaming markets.
What is shaping competition among leading console companies?
Competition is being shaped by exclusive content, AI-enhanced hardware features, and deeper digital ecosystems that combine subscriptions, software, and cross-platform services.
Page last updated on:


