Fixed Broadband Market Size and Share
Market Overview
| Study Period | 2019 - 2030 |
|---|---|
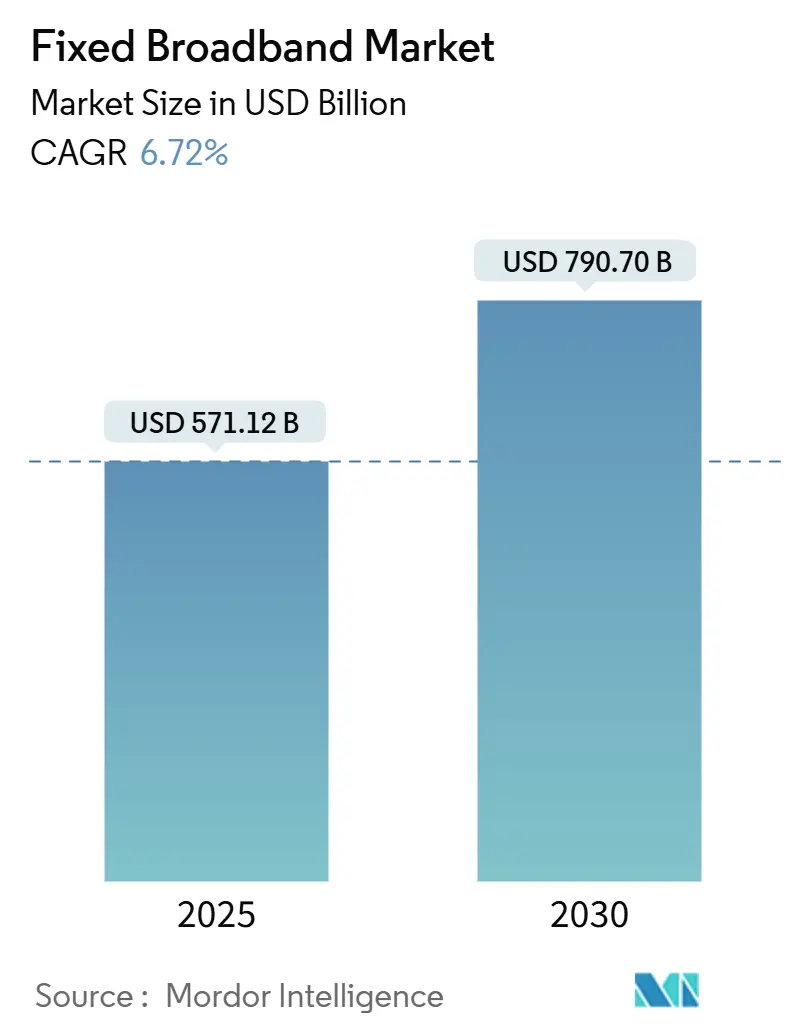
| Market Size (2025) | USD 571.12 Billion |
| Market Size (2030) | USD 790.70 Billion |
| Growth Rate (2025 - 2030) | 6.72% CAGR |
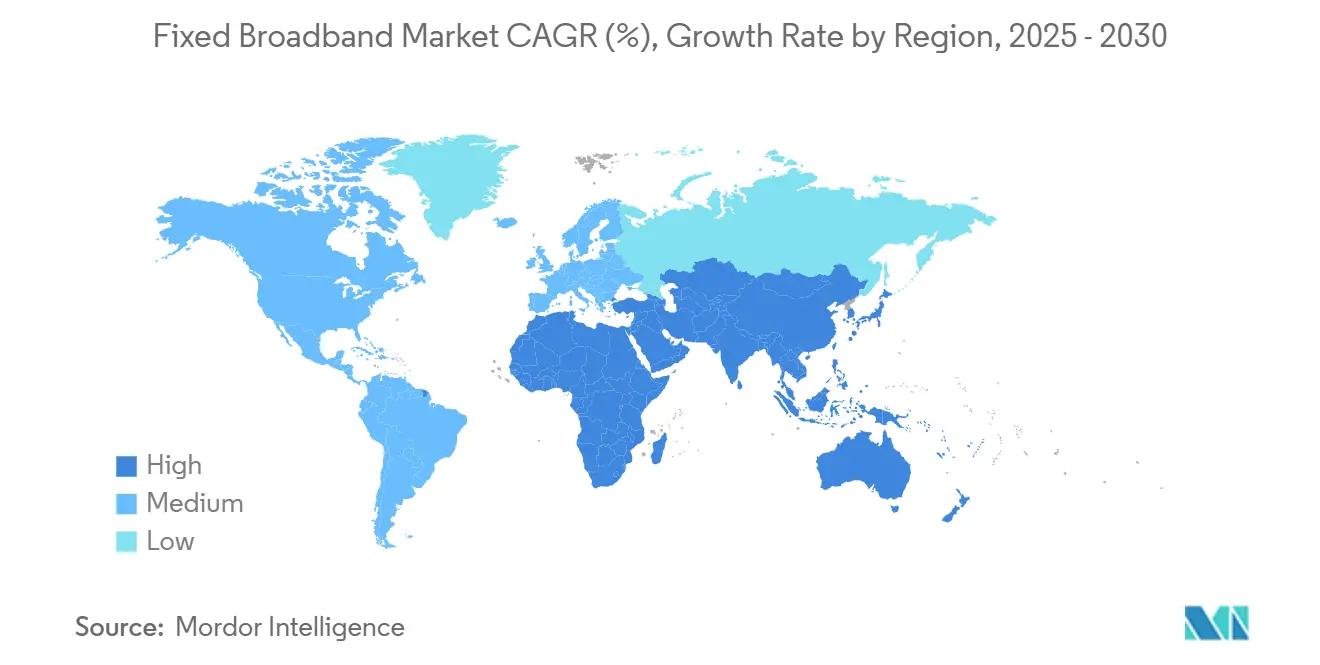
| Fastest Growing Market | Middle East and Africa |
| Largest Market | Asia Pacific |
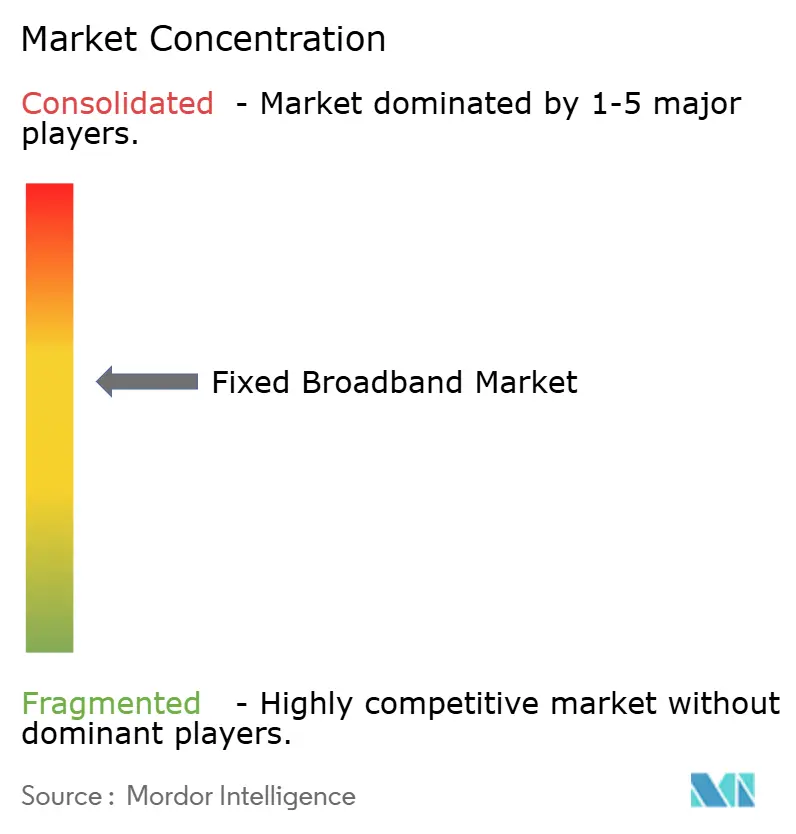
| Market Concentration | Medium |
Major Players *Disclaimer: Major Players sorted in no particular order Image © Mordor Intelligence. Reuse requires attribution under CC BY 4.0. | |
Fixed Broadband Market Analysis by Mordor Intelligence
The Fixed Broadband Market size is estimated at USD 571.12 billion in 2025, and is expected to reach USD 790.70 billion by 2030, at a CAGR of 6.72% during the forecast period (2025-2030). Rising government infrastructure funding, accelerated fiber deployment, and bandwidth-intensive consumer and enterprise applications are the primary drivers of growth. Operators are retiring copper and upgrading cable networks to fiber-to-the-premises, while 5G fixed wireless access (FWA) provides a complementary option for underserved areas. Supply-side innovation in optical components, network automation, and open-access wholesale models supports competitive intensity, even as supply chain constraints and trade controls raise deployment costs. The Asia Pacific region retains its leadership position due to large-scale FTTH rollouts, whereas the Middle East and Africa deliver the fastest growth as governments embed connectivity into their national digital agendas.
Key Report Takeaways
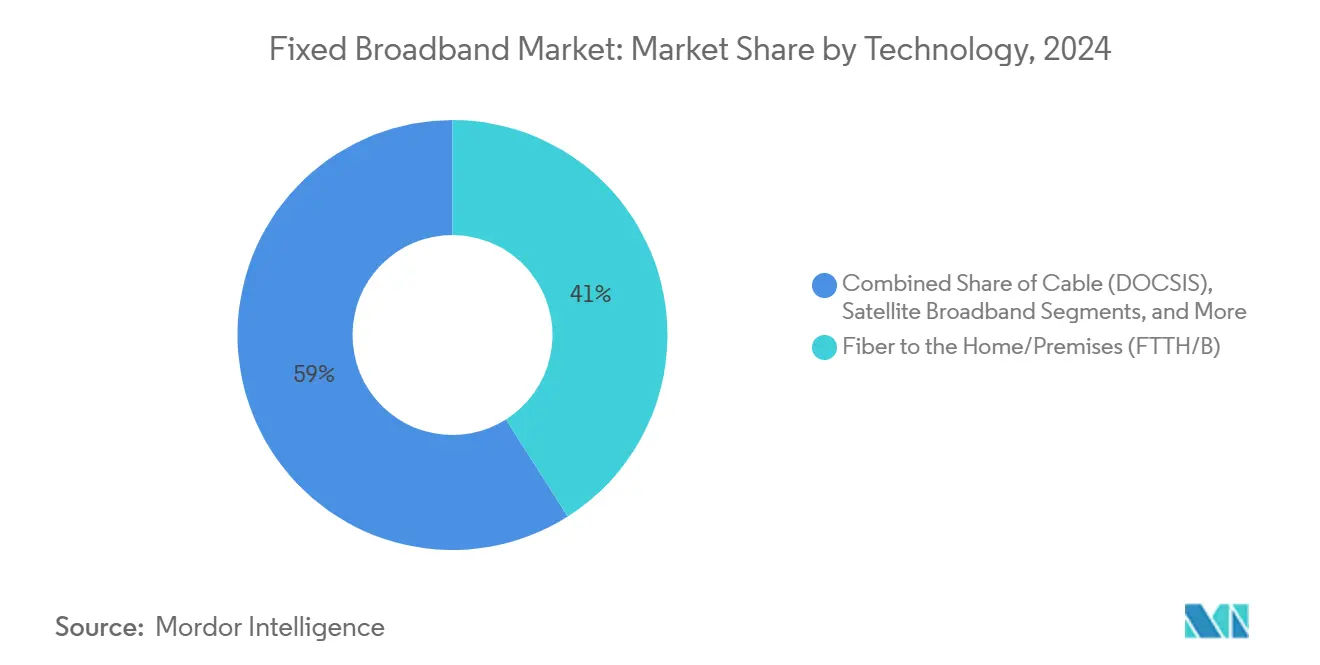
- By technology, fiber-to-the-home/premises (FTTH/B) led with a 41.00% revenue share in 2024; whereas fixed wireless access (5G/LTE) is projected to expand at a 13.1% CAGR through 2030.
- By speed tier, 100 Mbps-1 Gbps connections captured 59.63% of the fixed broadband revenue share in 2024. Services above 1 Gbps (Multi-Gig) are expected to grow at a 13.16% CAGR to 2030.
- By end user, the residential segment accounted for 85.14% of the fixed broadband revenue share in 2024, whereas the commercial segment is expected to advance at an 8.51% CAGR through 2030.
- By application, the video streaming and entertainment segment accounted for 67.97% of the fixed broadband revenue share in 2024, whereas the online gaming and immersive media segment is expected to advance at a 12.56% CAGR through 2030.
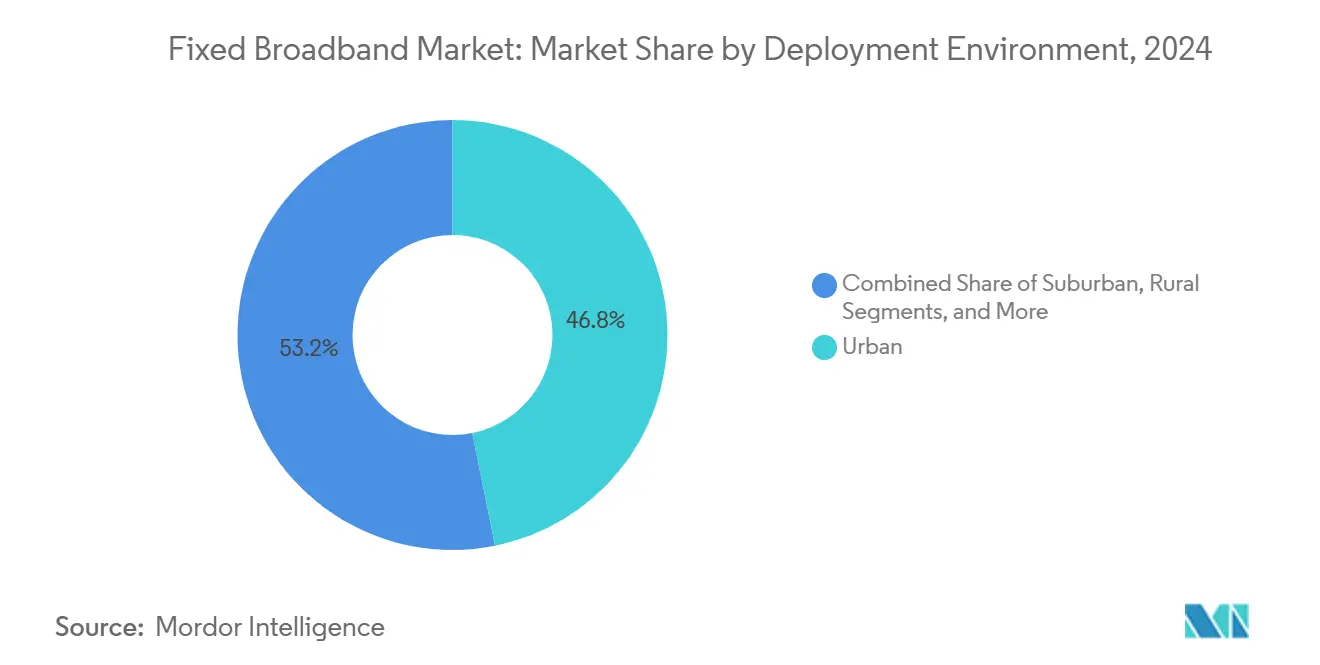
- By deployment environment, the urban segment accounted for 46.84% of the fixed broadband revenue share in 2024, and it is expected to advance at an 8.09% CAGR through 2030.
- By ownership, the incumbent telcos segment accounted for 43.70% of the fixed broadband revenue share in 2024, whereas the fixed wireless ISPs segment is expected to advance at a 9.11% CAGR through 2030.
- By geography, the Asia Pacific held 54.91% revenue share in 2024, while the Middle East and Africa are poised to record 7.91% CAGR through 2030.
Note: Market size and forecast figures in this report are generated using Mordor Intelligence’s proprietary estimation framework, updated with the latest available data and insights as of January 2026.
Global Fixed Broadband Market Trends and Insights
Drivers Impact Analysis*
| Driver | (~) % Impact on CAGR Forecast | Geographic Relevance | Impact Timeline |
|---|---|---|---|
| Accelerated FTTH Rollouts in Developing Economies | +1.8% | APAC core, spill-over to MEA and Latin America | Medium term (2-4 years) |
| Government Broadband Stimulus and BEAD-Style Subsidies | +1.5% | Global, with concentration in North America and EU | Short term (≤ 2 years) |
| Demand Spike from Bandwidth-Intensive Use-Cases (4K/VR, Cloud Gaming) | +1.2% | Global, led by North America and developed APAC | Long term (≥ 4 years) |
| 5G FWA and Satellite Acting as Feeder Demand for Fiber Backhaul | +1.0% | Rural and suburban areas globally | Medium term (2-4 years) |
| AI-Enabled Network Automation Lowering OPEX and Speeding Deployment | +0.8% | Global, early adoption in North America and EU | Long term (≥ 4 years) |
| Sustainable Network Requirements Favoring fiber Over Copper | +0.4% | EU and North America, expanding to APAC | Long term (≥ 4 years) |
| Source: Mordor Intelligence | |||
Accelerated FTTH Roll-outs Drive Infrastructure Transformation
Developing economies are prioritizing fiber to boost digital competitiveness, with China adding 45 million FTTH connections in 2024 and India targeting 250,000 villages by 2025. [1]Ministry of Electronics and Information Technology India, “BharatNet Program,” meity.gov.in Vietnam’s urban fiber penetration surpassed 85% in 2024, signaling rapid migration from copper. Lead times for specialized optical gear have lengthened from 12 to 18 weeks, benefiting vendors such as Huawei and Nokia while challenging operators to secure inventory. Regional construction firms are capturing contracts as incumbents redeploy capital from legacy maintenance to new builds. The fixed broadband market gains resilience because fiber allows scalable multi-gigabit upgrades without repeated civil works, shortening payback periods for operators.
Government Stimulus Programs Reshape Market Dynamics
The United States’ USD 42.5 billion BEAD program subsidizes fiber in unserved zones, rewriting return-on-investment thresholds for private carriers. Europe’s Digital Decade adds EUR 165 billion for gigabit coverage, and Germany alone allocates EUR 12 billion for rural fiber. These incentives attract overbuilders that challenge incumbents in areas once deemed uneconomical. Open-access obligations generate wholesale revenues for smaller ISPs, spurring price competition. State-level initiatives such as California’s Middle Mile Project create trunk routes that lower incremental build costs for the last mile. Collectively, subsidies accelerate the fixed broadband market toward near-universal coverage.
Bandwidth-Intensive Applications Redefine Speed Requirements
4K video demands 25 Mbps per stream, and 8K pushes beyond 100 Mbps; Microsoft’s Xbox Cloud Gaming and NVIDIA’s GeForce Now each need 50 Mbps with latency under 20 ms. [2]Microsoft, “Xbox Cloud Gaming Platform Expansion,” microsoft.com Meta and Apple VR headsets move 150-300 Mbps during immersive sessions, elevating household peak demand far above historical averages. Cable DOCSIS systems face upstream bottlenecks during concurrent streaming, whereas FTTH supports symmetric gigabit services. Verizon logged 40% year-over-year growth in gigabit plan sign-ups during 2024 as consumers upgraded for multi-screen 4K usage. [3]Verizon Communications, “Network Automation and AI Advances,” verizon.com These patterns propel premium speed tiers, anchoring revenue growth in the fixed broadband market.
AI Network Automation Transforms Operational Economics
Operators deploying machine-learning orchestration cut manual trouble tickets and shorten repair windows, with reported 15-20% OPEX savings. Verizon’s platform processes 1.2 billion events daily, resulting in a 35% reduction in service interruptions. Predictive analytics optimize splice locations, reducing construction schedules by 25%. Smaller ISPs leverage cloud-hosted AI to match the quality of incumbent services without the equivalent headcount. Edge-based AI also enables low-latency enterprise services, positioning carriers as managed solution providers. As automation scales, cost advantages translate into aggressive pricing, deepening competition across the fixed broadband industry.
Restraints Impact Analysis*
| Restraint | (~) % Impact on CAGR Forecast | Geographic Relevance | Impact Timeline |
|---|---|---|---|
| Rising Civil-Works CAPEX and Skilled-Labor Shortages | -1.1% | Global, acute in North America and EU | Short term (≤ 2 years) |
| Inflation-Linked Broadband Price Hikes Suppressing Take-Up in Low-ARPU Zones | -0.8% | Emerging markets and rural areas globally | Medium term (2-4 years) |
| Competitive Threat from Mobile Broadband Saturation in Urban Cores | -0.6% | Urban areas in developed markets | Long term (≥ 4 years) |
| Geopolitical Trade Controls on Optical Components Supply Chain | -0.5% | Global, concentrated impact in North America and EU | Medium term (2-4 years) |
| Source: Mordor Intelligence | |||
Construction Cost Inflation Constrains Deployment Velocity
Civil works outlays increased by 25-30% in 2024 as trenching crews became scarce and materials became costlier. Certified fiber technician wages increased by 20% in US metropolitan areas, while permit backlogs delayed projects by up to six months. Cash-limited overbuilders postponed new markets, and some incumbents slowed edge-out builds to preserve capital. Equipment providers see opportunity in micro-trenching and plug-and-play closure kits that reduce man-hours. Nevertheless, near-term build targets under government programs may slip if the labor supply fails to recover, tempering the expansion pace of the fixed broadband market.
Mobile Broadband Saturation Threatens Fixed-Line Relevance
Urban 5G delivers speeds of 200-400 Mbps, narrowing the gap with entry-level fixed broadband offers. T-Mobile’s 5G Home Internet added 2.8 million subscribers in 2024, cannibalizing cable in dense neighborhoods. [4]T-Mobile US, “5G Home Internet Subscriber Growth,” t-mobile.com Unlimited mobile plans appeal to solo households, and handset tethering suffices for casual streaming. Consequently, fixed operators must upsell ultra-high-speed and low-latency applications to justify premiums. Cable providers accelerate DOCSIS 4.0 and fiber upgrades, while utilities explore open-access fiber to retain customers. Long-term, the fixed broadband market differentiates itself on multi-gigabit capacity and service-level guarantees, rather than headline download speeds alone.
*Our forecasts treat driver/restraint impacts as directional, not additive. The impact forecasts reflect baseline growth, mix effects, and variable interactions.
Segment Analysis
By Technology: Fiber Upgrades Anchor Long-Term Strategy
Fiber-to-the-home recorded 41.0% revenue in 2024 and is forecast to widen its lead as subsidy programs concentrate on FTTH. Fixed wireless access grows at a 13.1% CAGR, propelled by 5G spectrum reuse and lower deployment costs, yet it remains complementary. Cable DOCSIS upgrades sustain relevance where aerial plant exists, but upstream limitations encourage cable operators to overlay fiber in greenfield builds. DSL continues to experience a controlled decline as regulators redefine the baseline broadband speed, which DSL cannot meet.
Competitive dynamics favor players that control both fiber and FWA, enabling them to segment markets by density and income. Starlink’s low-earth-orbit constellation eclipsed 2.3 million subscribers in 2024, proving the satellite’s viability in remote zones. Verizon’s 5G Home Internet demonstrates that mobile operators can enter fixed broadband markets without trenching. Regulators allocating mid-band spectrum often impose rural coverage obligations, indirectly boosting backhaul demand and reinforcing the fixed broadband market’s technology mix.


By Speed Tier: Multi-Gigabit Becomes the New Premium
Services between 100 Mbps and 1 Gbps accounted for 59.63% of the revenue in 2024, reflecting mainstream household needs. Above-1 Gbps offerings post 13.16% CAGR as enterprises, gamers, and content creators demand symmetric throughput. Entry-level tiers, up to 25 Mbps, shrink as governments raise the minimum service definitions.
Operators monetize premium tiers by offering value-added bundles, such as cybersecurity and managed Wi-Fi. Comcast experienced an 85% increase in multi-gig residential uptake in 2024. Fiber carriers can upgrade to 10 Gbps via XGS-PON with minimal incremental CAPEX, whereas cable operators must overhaul their node architecture for symmetrical speeds, influencing capital allocation. This divergence cements fiber’s strategic importance in the fixed broadband market.
By End User: Commercial Uptake Gains Momentum
Residential users accounted for 85.14% of 2024 revenue, while commercial lines grew at an 8.51% CAGR as hybrid work normalizes. Small and medium-sized businesses are increasingly relying on fiber-based services for video conferencing, cloud applications, and data backups. Enterprise customers demand service level agreements and redundant connectivity, driving higher average revenue per user for broadband providers. This evolution in the commercial market underscores the growing importance of high-speed internet as a critical infrastructure, rather than a mere utility.
AT&T’s business fiber accounts climbed 12% in 2024. Operators bundle SD-WAN, security, and unified communications to deepen wallet share. Meanwhile, residential subscribers upgrade to higher tiers to accommodate simultaneous video meetings and streaming. The converging needs of home offices and SMEs blur segmentation lines within the fixed broadband market.
By Application: Gaming and Immersive Media Accelerate
Video streaming dominated 67.97% of 2024 traffic, yet online gaming and immersive media posted a 13.56% CAGR. NVIDIA’s GeForce Now necessitates sustained 50 Mbps and sub-20 ms latency, reinforcing the case for fiber. Remote work and telehealth sustain elevated baseline traffic, while smart-home devices contribute persistent low-bandwidth but latency-sensitive flows.
The evolution of applications increasingly favors low-latency, high-bandwidth services, distinguishing fixed broadband from mobile alternatives. Industrial and enterprise automation drive demand for dedicated internet access and service level guarantees, creating opportunities for managed service revenue. The growing adoption of bandwidth-intensive applications justifies operator investments in fiber infrastructure, while exposing the limitations of legacy copper and cable networks that are nearing capacity.
By Deployment Environment: Suburban and Rural Catch Up
Urban markets, characterized by dense populations, increasingly adopt fiber deployment due to the high concentration of customers and significant revenue potential. Conversely, rural areas are progressively relying on fixed wireless and satellite solutions to achieve cost-effective coverage. Urban zones contributed 46.84% of the revenue in 2024, with an 8.09% CAGR, as metro fiber densification continued. Subsidized builds shift focus to suburban and rural counties where BEAD grants de-risk investment. Charter invested USD 2.1 billion in rural fiber during 2024, leveraging state funds.
Specialized operators, including urban fiber overbuilders and rural wireless ISPs, are capitalizing on opportunities driven by the evolving dynamics of the deployment environment. FWA and satellite offer near-term coverage, but policymakers still favor fiber for longevity. Open-access mandates enable wholesale entrants to transform government-funded backbones into retail competition, thereby broadening the footprint of the fixed broadband market.
By Ownership: Competitive Overbuilders Disrupt Incumbents
Incumbent telcos held 43.70% of lines in 2024 but face a 9.11% CAGR from fixed wireless ISPs and fiber overbuilders. Cable multiple system operators are leveraging their existing infrastructure to expand broadband services while contending with competition from fiber deployments within their service territories. Competitive fiber overbuilders strategically target specific markets with advanced technology offerings, compelling incumbents to expedite their network upgrades.
In 2024, Google Fiber expanded into 22 new markets, highlighting how well-funded overbuilders can effectively compete with incumbent operators by offering superior services. This evolution in the ownership landscape reflects a significant shift in competitive dynamics, where technological advantages and access to capital play a more critical role in determining market position than traditional service territories. Municipal broadband initiatives not only enhance service quality but also promote public-private partnerships while increasing competitive pressure on commercial providers. Although this infrastructure-based competition benefits consumers through improved services and pricing, it presents considerable challenges for operators unable to match the required network investments and service capabilities.
Geography Analysis
The Asia Pacific region accounted for 54.91% of 2024 revenue, as China and India executed large-scale FTTH agendas. China Telecom and China Mobile added 45 million new fiber lines, while BharatNet connected 180,000 villages. South Korea and Japan each exceed 85% fiber penetration, creating mature high-ARPU environments that showcase multi-gigabit uptake. Southeast Asian nations, such as Vietnam and the Philippines, are accelerating fiber rollouts in response to rapid urbanization.
North America, with the BEAD program radically improving rural economics. Verizon netted 389,000 Fios additions in 2024, and cable operators are chasing rural subsidies to extend their networks. Canada’s universal access strategy underwrites remote deployments in the Arctic and Atlantic provinces. Competitive overbuilders leverage private equity to cherry-pick suburbs, expanding the fixed broadband market size across mid-tier cities.
Europe’s Digital Decade sets a 2030 target of a gigabit for all, aligning public grants and private capital. Deutsche Telekom invests EUR 6 billion annually in German FTTH, while the United Kingdom’s altnets, including Openreach, aim to reach 85% full-fiber coverage by 2025. Open-access regulation fosters wholesale revenue streams and keeps retail prices contained. The Middle East and Africa record the highest 7.91% CAGR as Saudi Arabia’s Vision 2030 and South Africa’s metropolitan fiber corridors drive new builds. Gulf states deploy fiber as part of economic diversification, whereas sub-Saharan nations lean on FWA to bridge the connectivity gap.
Mordor Intelligence provides coverage of the fixed broadband market across other key regional markets, including Middle East, South America, Africa, North America, Europe, and Asia, each with their regulatory frameworks and demand patterns.

Competitive Landscape
The global fixed broadband market demonstrates a moderate level of concentration. Operators are increasingly prioritizing infrastructure-based competition, focusing on fiber deployment over maintaining legacy networks. This strategy aims to secure premium service revenues and strengthen market positions. The emergence of 5G fixed wireless access facilitates rapid market entry without the need for extensive civil works, while satellite constellations address connectivity challenges in previously uneconomical rural markets.
Opportunities are emerging in underserved rural and suburban areas, supported by government initiatives such as the BEAD program, which enhance deployment economics for competitive providers. Disruptors reshaping the market include municipal broadband projects, private equity-backed fiber overbuilders, and technology companies like Google Fiber, leveraging superior capital access to enter the market. The adoption of artificial intelligence in network operations is driving competitive advantages by reducing operational costs and improving service quality.
Operators capable of delivering multi-gigabit services with low latency are gaining a competitive edge, intensifying the need for continued investment in infrastructure and technological advancements. Additionally, the Federal Communications Commission's open-access requirements for government-funded deployments create wholesale opportunities while fostering competitive market dynamics across various deployment environments.
Fixed Broadband Industry Leaders
China Telecom Corporation Limited
China Mobile Limited
Comcast Corporation
AT&T Inc.
Verizon Communications Inc.
- *Disclaimer: Major Players sorted in no particular order

Recent Industry Developments
- July 2025: T-Mobile and KKR completed the takeover of Metronet, integrating its FTTH footprint and customer base.
- September 2024: Verizon Communications announced the acquisition of Frontier Communications for USD 20 billion, adding 2.2 million potential fiber locations across 25 states.
- September 2024: TPG finalized an agreement with AT&T to acquire its remaining 70% stake in DIRECTV, pending customary approvals.


Global Fixed Broadband Market Report Scope
| Fiber to the Home/Premises (FTTH/B) |
| Cable (DOCSIS) |
| Digital Subscriber Line (DSL) and Copper |
| Fixed Wireless Access (5G/LTE) |
| Satellite Broadband |
| Up to 25 Mbps |
| 100 Mbps - 1 Gbps |
| Above 1 Gbps (Multi-Gig) |
| Residential |
| Commercial |
| Video Streaming and Entertainment |
| Online Gaming and Immersive Media |
| Remote Work and Cloud Collaboration |
| Smart Home and IoT Connectivity |
| Telehealth and Distance Learning |
| Industrial and Enterprise Automation |
| Urban |
| Suburban |
| Rural |
| Remote and Hard-to-Reach |
| Incumbent Telcos |
| Competitive Fiber Overbuilders |
| Cable Multiple System Operators (MSOs) |
| Fixed Wireless ISPs |
| Satellite Network Operators |
| North America | United States |
| Canada | |
| Mexico | |
| South America | Brazil |
| Argentina | |
| Colombia | |
| Chile | |
| Rest of South America | |
| Europe | Germany |
| United Kingdom | |
| France | |
| Italy | |
| Spain | |
| Russia | |
| Rest of Europe | |
| Asia Pacific | China |
| Japan | |
| India | |
| South Korea | |
| Australia and New Zealand | |
| Rest of Asia Pacific | |
| Middle East and Africa | Saudi Arabia |
| United Arab Emirates | |
| Turkey | |
| South Africa | |
| Nigeria | |
| Rest of Middle East and Africa |
| By Technology | Fiber to the Home/Premises (FTTH/B) | |
| Cable (DOCSIS) | ||
| Digital Subscriber Line (DSL) and Copper | ||
| Fixed Wireless Access (5G/LTE) | ||
| Satellite Broadband | ||
| By Speed Tier | Up to 25 Mbps | |
| 100 Mbps - 1 Gbps | ||
| Above 1 Gbps (Multi-Gig) | ||
| By End User | Residential | |
| Commercial | ||
| By Application | Video Streaming and Entertainment | |
| Online Gaming and Immersive Media | ||
| Remote Work and Cloud Collaboration | ||
| Smart Home and IoT Connectivity | ||
| Telehealth and Distance Learning | ||
| Industrial and Enterprise Automation | ||
| By Deployment Environment | Urban | |
| Suburban | ||
| Rural | ||
| Remote and Hard-to-Reach | ||
| By Ownership | Incumbent Telcos | |
| Competitive Fiber Overbuilders | ||
| Cable Multiple System Operators (MSOs) | ||
| Fixed Wireless ISPs | ||
| Satellite Network Operators | ||
| By Geography | North America | United States |
| Canada | ||
| Mexico | ||
| South America | Brazil | |
| Argentina | ||
| Colombia | ||
| Chile | ||
| Rest of South America | ||
| Europe | Germany | |
| United Kingdom | ||
| France | ||
| Italy | ||
| Spain | ||
| Russia | ||
| Rest of Europe | ||
| Asia Pacific | China | |
| Japan | ||
| India | ||
| South Korea | ||
| Australia and New Zealand | ||
| Rest of Asia Pacific | ||
| Middle East and Africa | Saudi Arabia | |
| United Arab Emirates | ||
| Turkey | ||
| South Africa | ||
| Nigeria | ||
| Rest of Middle East and Africa | ||


Key Questions Answered in the Report
How fast is global fiber deployment growing through 2030?
Fiber lines are expanding at a 6.72% CAGR, propelled by subsidy programs and developing-nation roll-outs that keep the fixed broadband market on a steady growth path.
Which region leads current broadband revenues?
Asia Pacific contributes 54.91% of global revenue, benefiting from China’s and India’s extensive FTTH investments.
What role does 5G fixed wireless play in underserved areas?
5G FWA grows at 13.1% CAGR and provides quick-to-market connectivity where fiber trenching is uneconomic, often serving as an on-ramp to future fiber backhaul.
Why are multi-gigabit tiers gaining traction?
Rising 4K/8K streaming, VR, and cloud gaming demand symmetric high throughput, driving a 13.16% CAGR for services above 1 Gbps and elevating ARPU for operators.
How are government subsidies influencing competition?
Programs such as BEAD and the EU Digital Decade reduce investment risk, attract overbuilders, and mandate open-access wholesale, intensifying competition and expanding the fixed broadband market size.
What is the main operational benefit of AI in network management?
AI-enabled automation lowers OPEX by up to 20% and cuts outages by around one-third, helping carriers offer higher reliability at competitive prices.
Page last updated on:


