Eye Examination Equipment Market Size and Share
Market Overview
| Study Period | 2020 - 2031 |
|---|---|
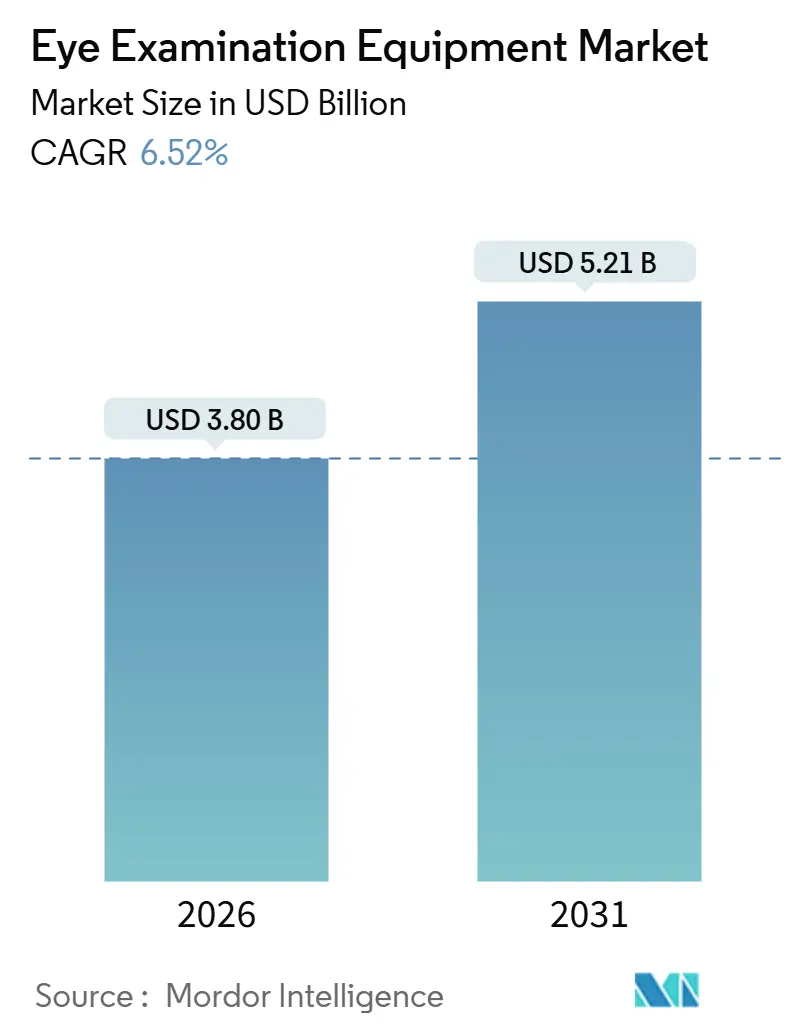
| Market Size (2026) | USD 3.80 Billion |
| Market Size (2031) | USD 5.21 Billion |
| Growth Rate (2026 - 2031) | 6.52% CAGR |
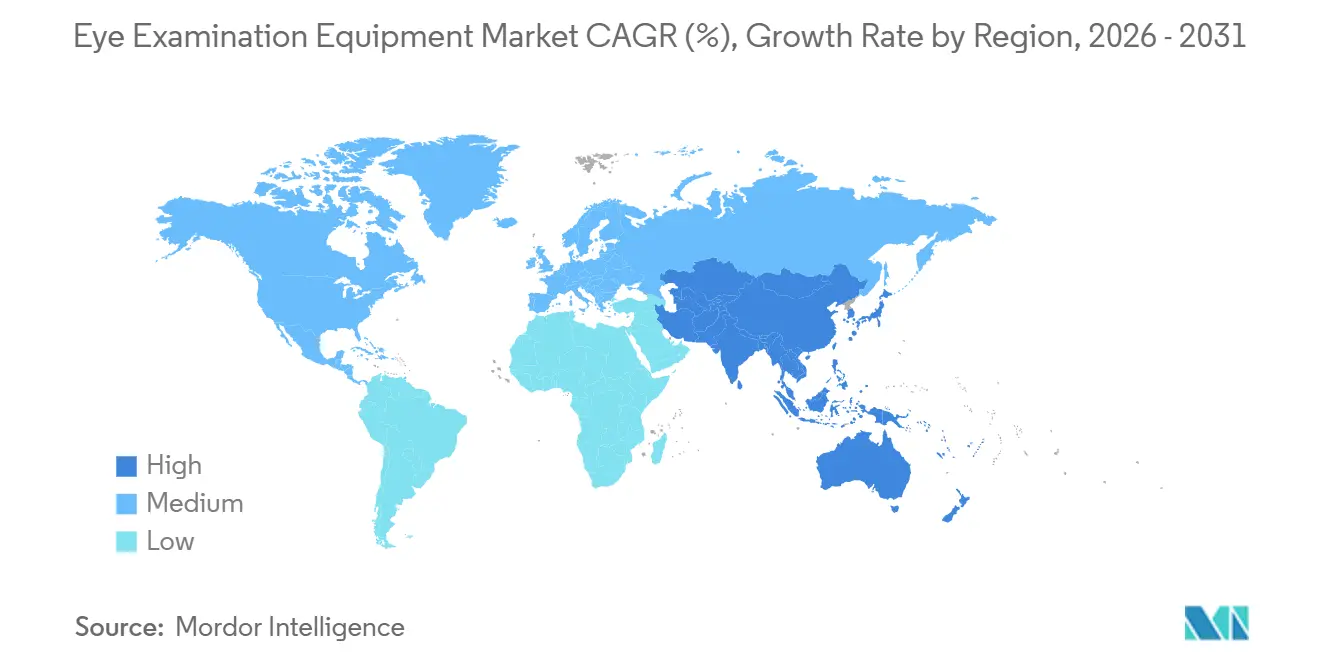
| Fastest Growing Market | Asia Pacific |
| Largest Market | North America |
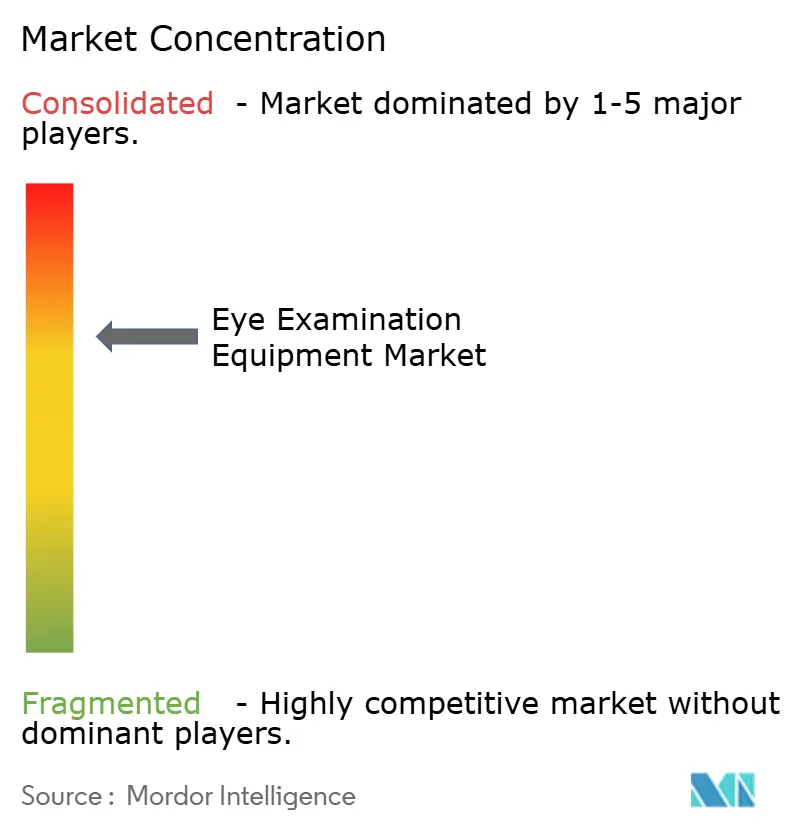
| Market Concentration | Medium |
Major Players *Disclaimer: Major Players sorted in no particular order Image © Mordor Intelligence. Reuse requires attribution under CC BY 4.0. | |
Eye Examination Equipment Market Analysis by Mordor Intelligence
The Eye Examination Equipment Market size is estimated at USD 3.80 billion in 2026, and is expected to reach USD 5.21 billion by 2031, at a CAGR of 6.52% during the forecast period (2026-2031).
Demand rises as aging populations and higher diabetes prevalence converge with rapid adoption of artificial-intelligence tools that trim interpretation time and broaden specialist reach. Hospitals still dominate capital spending, yet ambulatory surgical centers and mobile programs gain traction as payers steer cataract and refractive cases toward lower-cost sites. Platform vendors now bundle imaging hardware with proprietary algorithms, securing recurring software revenue while easing upfront budgets for providers. Ultra-widefield and swept-source technologies shorten exams and detect peripheral lesions earlier, positioning premium devices as throughput multipliers rather than cost centers.
Key Report Takeaways
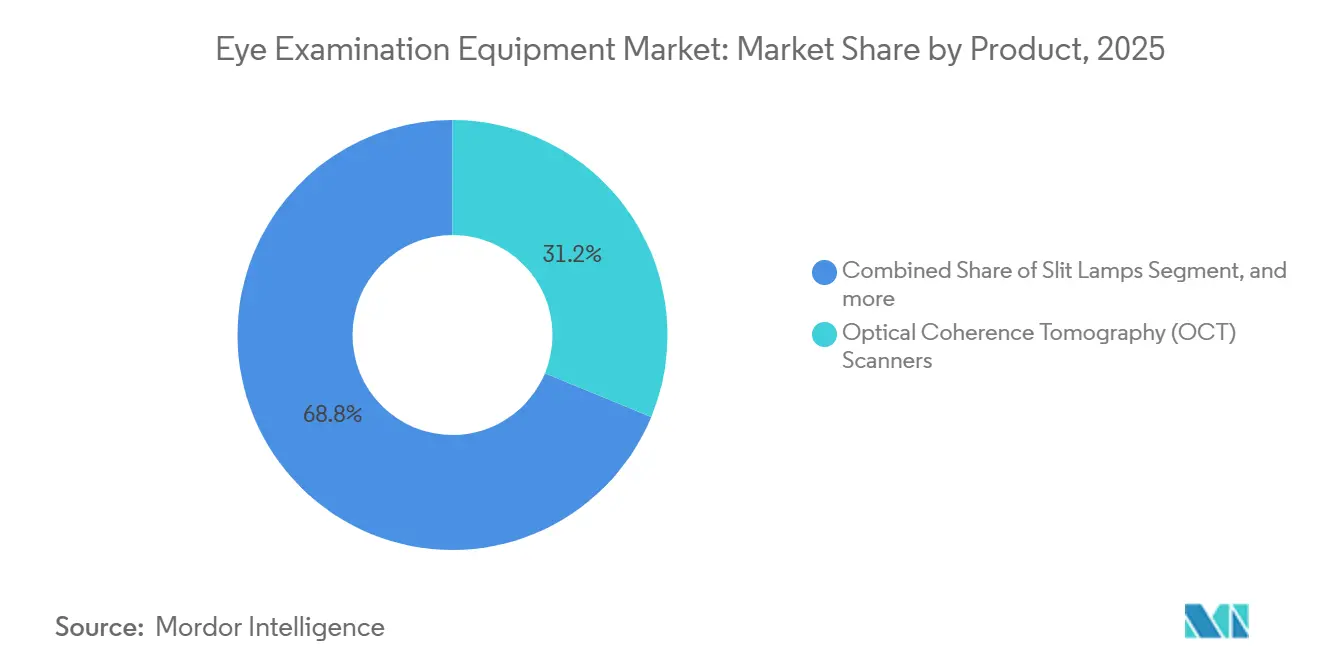
- By product category, optical coherence tomography scanners led with 31.23% revenue share in 2025; fundus and retinal cameras are forecast to expand at an 8.54% CAGR to 2031.
- By end user, hospitals accounted for 58.65% of 2025 revenue, while ambulatory surgical centers recorded the highest projected CAGR of 9.43% through 2031.
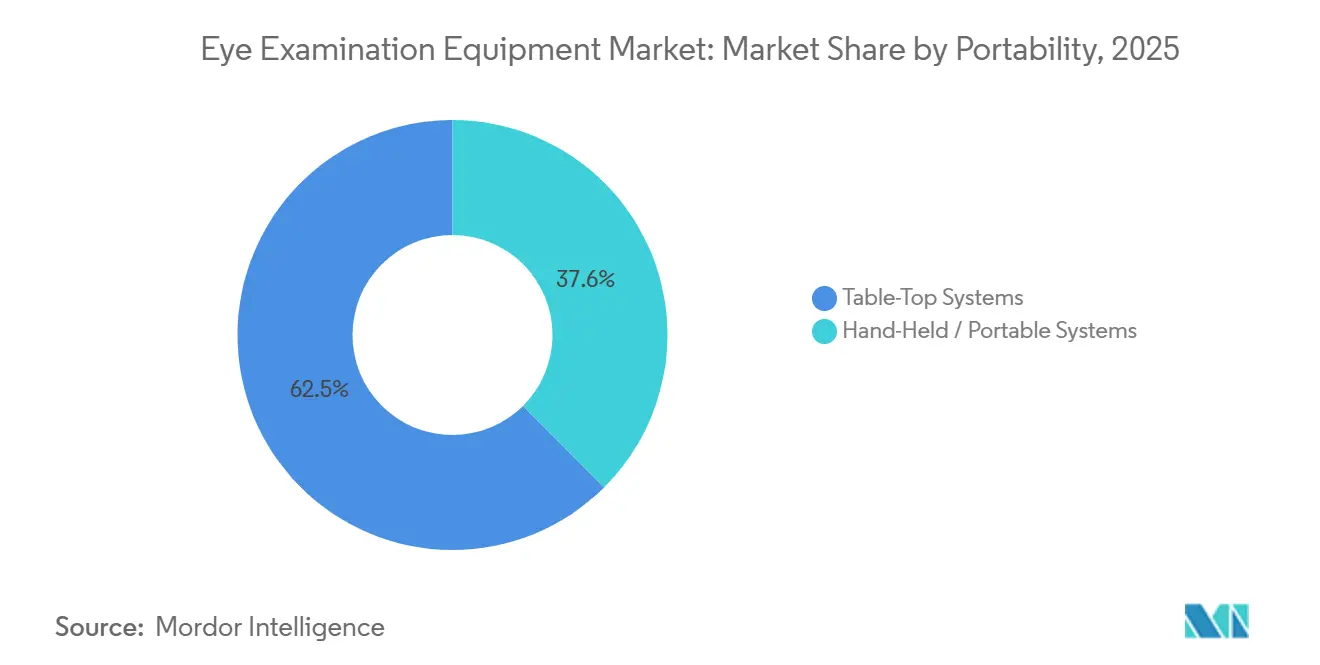
- By portability, table-top systems held 62.45% of the eye examination equipment market share in 2025, and handheld systems are advancing at a 9.11% CAGR through 2031.
- By technology, digital and computer-integrated platforms accounted for 68.76% of the eye examination equipment market size in 2025 and are growing at an 8.76% CAGR through 2031.
- By geography, North America led with a 43.12% revenue share in 2025; Asia-Pacific is posting the fastest regional CAGR of 7.54% through 2031.
Note: Market size and forecast figures in this report are generated using Mordor Intelligence’s proprietary estimation framework, updated with the latest available data and insights as of January 2026.
Global Eye Examination Equipment Market Trends and Insights
Drivers Impact Analysis*
| Driver | (~) % Impact on CAGR Forecast | Geographic Relevance | Impact Timeline |
|---|---|---|---|
| Rising incidence of chronic eye diseases | +1.8% | North America, Europe, urban Asia-Pacific | Medium term (2-4 years) |
| Expansion of global geriatric population | +1.5% | Japan, South Korea, Germany, Italy | Long term (≥ 4 years) |
| Technological advancements in ophthalmic imaging | +1.3% | North America and Europe, APAC follows | Short term (≤ 2 years) |
| Increasing accessibility of eye care in emerging markets | +0.9% | India, China, Indonesia, Sub-Saharan Africa, Latin America | Medium term (2-4 years) |
| Integration of artificial intelligence | +0.7% | United States, EU, Singapore, South Korea, Australia | Short term (≤ 2 years) |
| Growth of tele-ophthalmology programs | +0.6% | Rural India, China, Brazil, Middle East, Africa | Medium term (2-4 years) |
| Source: Mordor Intelligence | |||
Rising Incidence of Chronic Eye Diseases
Diabetic retinopathy, glaucoma, and age-related macular degeneration now account for most diagnostic encounters, replacing episodic refractive checks. The U.S. Centers for Disease Control and Prevention recorded 9.6 million Americans with diabetic retinopathy and 4.22 million with glaucoma in 2022. Global diabetes cases are forecast to exceed 783 million by 2045, a surge that compels health systems to implement automated grading platforms for high-volume retinal screening[1]International Diabetes Federation, “IDF Diabetes Atlas,” idf.org. Germany and the United Kingdom have begun reimbursing AI-assisted diabetic-retinopathy exams at parity with ophthalmologist visits, validating digital infrastructure investments. These epidemiological trends push demand for high-resolution posterior-segment devices that deliver both structural and vascular data in under three minutes.
Expansion of the Global Geriatric Population
People aged 65 and above present cataract, glaucoma, and macular degeneration rates four to six times higher than younger cohorts, keeping replacement cycles tight for tonometers and slit lamps. The World Health Organization estimates 2.2 billion individuals live with vision impairment worldwide, most in low- and middle-income countries where elderly populations grow quickest. Japan reports that citizens aged 75 and older account for 68% of ophthalmology outpatient visits, prompting additional device procurement to manage backlogs[2]Ministry of Health, Labour and Welfare Japan, “Annual Health Statistics 2024,” mhlw.go.jp. South Korea’s expansion of insurance coverage for annual glaucoma screening in adults over 60 increased perimeter installations by 22% year-over-year in 2025. Similar demographic shifts in Italy and Spain are boosting demand for portable units that enable home-based exams amid budgetary constraints.
Technological Advancements in Ophthalmic Imaging
Swept-source OCT, ultra-widefield photography, and multimodal systems compress acquisition time and enlarge fields of view, improving lesion detection. Carl Zeiss Meditec’s PLEX Elite 9000 captures 100,000 A-scans per second and views the choroid through dense cataracts, cutting exam time below three seconds. Topcon’s Maestro2 integrates color fundus, OCT, and OCT-angiography in a single chassis, slashing capital outlays by 35% for mid-sized clinics. The FDA-cleared Home OCT lets macular-degeneration patients self-monitor at home, shifting visits from clinics to virtual dashboards. Handheld OCT prototypes are under neonatal trials, extending imaging to intensive-care nurseries.
Increasing Accessibility of Eye Care Services in Emerging Markets
Government initiatives are funding tele-ophthalmology kiosks and mobile vans that rely on portable cameras and tonometers. India set aside USD 180 million to equip 5,000 primary-health centers with cloud-linked kits. China’s Healthy China 2030 blueprint mandates county-level eye-care centers by 2027, spurring orders for mid-tier OCT units from domestic brands. Brazil has rolled out mobile screening units to 120 municipalities, extending eye exams deep into the Amazon. Kenya and Rwanda test solar-powered fundus cameras in off-grid clinics in partnership with Orbis International.
Restraints Impact Analysis*
| Restraint | (~) % Impact on CAGR Forecast | Geographic Relevance | Impact Timeline |
|---|---|---|---|
| High capital expenditure for advanced equipment | -0.8% | Latin America, Sub-Saharan Africa, South Asia | Medium term (2-4 years) |
| Inadequate reimbursement frameworks | -0.6% | Latin America, Southeast Asia, Africa, Middle East | Long term (≥ 4 years) |
| Shortage of skilled ophthalmic personnel | -0.4% | Rural India, Sub-Saharan Africa, Latin America | Long term (≥ 4 years) |
| Data privacy and cybersecurity concerns | -0.3% | North America, European Union, advanced APAC hubs | Short term (≤ 2 years) |
| Source: Mordor Intelligence | |||
High Capital Expenditure for Advanced Equipment
Swept-source OCT and ultra-widefield cameras cost USD 80,000 to USD 150,000, which is beyond the means of many independent clinics. Forty-one percent of U.S. solo practices deferred OCT purchases in 2024, opting for leases or refurbished units[3]American Academy of Ophthalmology, “Practice Economics Survey 2024,” aao.org. In India, an OCT unit costs INR 6.5 million (USD 78,000), which is equivalent to up to 2 years of clinic revenue. Brazil’s 2025 federal budget covered fewer than 300 OCTs for 215 million citizens. Lease-plus-per-scan models shift capital to operating costs but can raise per-patient expense when volumes are low.
Inadequate Reimbursement Frameworks in Developing Regions
Out-of-pocket payments dominate diagnostics in many low-income settings. Indonesia reimburses an OCT scan at only USD 10, covering less than one-fifth of the actual cost. Mexico’s public system excludes OCT entirely, forcing patients to pay up to USD 145 per scan. Kenya’s national insurer does not cover fundus imaging beyond slit-lamp exams. The World Health Organization lists ophthalmic diagnostics among the least covered service categories in its 2025 universal-coverage review.
*Our forecasts treat driver/restraint impacts as directional, not additive. The impact forecasts reflect baseline growth, mix effects, and variable interactions.
Segment Analysis
By Product: Imaging Convergence Accelerates Adoption
The segment generated 31.23% revenue from OCT in 2025, underscoring its central role in posterior-segment care. Fundus and retinal cameras, projected to grow 8.54% annually, benefit from ultra-widefield and home-monitoring clearances that reduce clinic visits. Handheld fundus cameras are displacing direct ophthalmoscopes in primary care, while multimodal platforms merge angiography with structural scans, improving efficiency. Mature products like slit lamps and tonometers maintain steady replacement cycles, but their following upgrades are now digital, not mechanical. Ultrasound and corneal topography fill surgical planning niches, sustaining modest but stable demand.
Market convergence favors premium multimodal systems that shorten exam times and maximize technician throughput. Notal Vision’s Home OCT brings imaging into patients’ living rooms, foreshadowing broader home-monitoring coverage. Vendors are racing to miniaturize swept-source technology for portable form factors, positioning neonatal and emergency-department use cases as the next growth frontier. Commodity entry-level cameras from Korean and Taiwanese firms force incumbents to justify higher prices through faster scans, AI modules, and service bundles, reshaping the eye examination equipment market.


By End User: Volume Shifts to Outpatient Settings
Hospitals accounted for 58.65% of spending in 2025 because they provide tertiary services, but reimbursement pressures mean upgrades are paced. Ambulatory surgical centers achieve the fastest 9.43% CAGR as cataract and refractive cases move to lower-cost venues that rely on portable imaging to streamline preoperative work-ups. Independent optometrists are rapidly buying OCT units through lease models, capturing medical eye-care revenue that was previously referred out. Academic institutes demand research-grade resolution and open data platforms, sustaining high-priced multimodal purchases.
Basic screening devices reach optical retail chains and occupational health clinics, expanding preventive care but yielding slimmer margins for vendors. Community health centers across India and Africa use donor-funded handheld cameras for mass screenings, extending coverage but offering infrequent replacement sales. These diverse demand patterns require flexible pricing, financing, and after-sales service, compelling manufacturers to tailor packages to each customer class across the eye examination equipment market.
By Portability: Handheld Growth Outpaces Table-Top Dominance
Table-top models still account for 62.45% revenue because they integrate seamlessly with electronic health records and offer higher resolution. Yet handheld systems grow 9.11% annually by bringing diagnostics to remote communities, schools, and mobile vans. The WHO’s 2025 roadmap endorses the use of portable devices to reach populations living more than 50 kilometers from an ophthalmologist. India has deployed 3,200 handheld fundus cameras, cutting rural referral wait times to under 2 weeks. Battery life and narrower fields of view remain restraints, but rapid sensor advances are closing the gap.
Reimbursement incentives still favor diagnostic-grade table-top devices, making them essential in fee-for-service clinics. Portable tonometers like iCare’s rebound models simplify glaucoma checks without topical drops, expanding pediatric and geriatric screening. Handheld OCT prototypes for neonatal units show potential to unlock new purchasing centers. Together, these trends diversify the eye examination equipment market, ensuring vendors must balance high-end accuracy with field-ready durability.
By Technology: Digital Platforms Redefine Workflow
Digital and computer-integrated systems controlled 68.76% of revenue in 2025 and grew at 8.76% as cloud repositories and AI grading replaced analog tools. Analog models persist in areas with unreliable power, yet solar-powered and battery-operated variants erode that niche. Cloud-connected OCTs from Zeiss and Topcon allow retina specialists to supervise multiple satellite clinics, spreading expertise further. EU conformity assessments now treat embedded software separately, lengthening approval cycles but elevating quality benchmarks.
Digital tracking of longitudinal scans improves disease management; Heidelberg’s Spectralis overlays follow-up images to show micron-level changes. Practices using AI for diabetic retinopathy grading cut false negatives by 18%, proving the digital value. Cybersecurity compliance costs rise, but vendors able to certify secure updates gain trust with risk-averse buyers. Analog slit lamps dominate resource-poor settings, yet accelerated broadband and cloud infrastructure rollouts shorten their lifespan, reinforcing digital predominance in the eye examination equipment market.
Geography Analysis
North America contributed 43.12% of 2025 revenue, powered by Medicare coverage of annual diabetic-retinopathy screening and accelerated FDA pathways for software-as-a-medical-device approvals. Permanent tele-ophthalmology reimbursement widens asynchronous screening in pharmacies and primary care offices, bolstering sales of portable cameras. Canada earmarked CAD 85 million (USD 63 million) for rural imaging, shrinking distance barriers for Indigenous populations. Mexico’s private chains expand handheld tonometer fleets, yet public insurance gaps limit uptake outside urban centers.
Asia-Pacific delivers a 7.54% CAGR through 2031, outpacing all regions. China’s Healthy China 2030 mandate funds county-level eye-care centers and drives OCT orders from local manufacturers. India’s program to cut avoidable blindness below 0.25% requires 4,000 new OCT units and 15,000 technicians by 2030, creating a robust pipeline for vendors. Japan’s 29% senior population fuels steady tonometer replacements, while budget constraints push refurbished purchases. Australia’s reimbursement for OCT angiography lifted installations by 19% in 2025, positioning it as a premium platform test bed. Price-sensitive Southeast Asian markets prefer handheld fundus cameras for mass screenings, yielding volume but thinner margins.
Europe grows modestly as Medical Device Regulation costs slow approvals. Germany spent EUR 320 million (USD 350 million) in 2025 on diabetic retinopathy equipment for primary care, yet the United Kingdom postponed non-urgent upgrades, lengthening replacement cycles. France and Italy deploy portable cameras in pharmacies to ease rural wait lists, boosting handheld sales 14% in 2025. Middle Eastern sovereign funds finance AI screening in Egypt and Saudi Arabia to bring avoidable blindness below 0.5% by 2030. Brazil anchors South America with 120 mobile eye units, though advanced imaging remains concentrated in private hubs.

Competitive Landscape
The eye examination equipment market shows moderate concentration; the top five vendors—Carl Zeiss Meditec, Topcon, Nidek, Haag-Streit, and Canon—command 52% of 2025 revenue. Leasing models that bundle hardware with per-scan software fees dominate strategy, allowing vendors to shift capital costs off customer books while locking clients into recurring subscriptions. AI integration commands 20–30% premiums and differentiates offerings, yet requires region-specific validation, straining smaller firms.
Disruptors from South Korea and Taiwan are undercutting prices by up to 40% on entry-level fundus cameras, forcing incumbents to justify premiums through swept-source capabilities, multimodal scans, and robust service. Patent filings signal focus areas: Zeiss seeks choroidal-imaging and AI layer segmentation, while Topcon targets portable OCT. Home-monitoring and neonatal imaging remain white-space segments; Notal Vision’s FDA-cleared Home OCT leads, and Topcon’s 35% stake in Notal Vision underscores commitment.
Cybersecurity compliance under FDA and EU MDR raises costs 15–20%, favoring well-capitalized incumbents and accelerating consolidation. Vendors investing early in secure software and post-market surveillance are poised to extend share as customers prioritize data-protection assurances within the eye examination equipment market.
Eye Examination Equipment Industry Leaders
Carl Zeiss Meditec AG
Topcon Corporation
NIDEK Co., Ltd.
Canon Medical Systems (Eye Care)
Haag-Streit Group
- *Disclaimer: Major Players sorted in no particular order

Recent Industry Developments
- January 2026: Grafton Optical announced exclusive UK & Ireland distribution partnership with Visionix for their advanced imaging devices.
- November 2025: Topcon Healthcare received FDA 510(k) clearance and officially launched OMNIA, a fully automated, 4-in-1 pretesting solution designed to streamline and modernize the eye-care workflow. The compact system integrates objective refraction, keratometry, tonometry, and pachymetry into a single device, enabling practitioners to capture consistent, high-quality data with minimal training.
- January 2025: Boots Opticians launched optomap as part of its most advanced eye test ever, which could help to detect signs of severe health conditions. This exciting advancement in ophthalmology will be available in over 120 stores, making Boots Opticians the first multiple high-street retailer to make this technology more widely available.


Global Eye Examination Equipment Market Report Scope
As per scope of the report, eye examination equipment includes devices used by eye care professionals to diagnose and assess vision and eye health. These tools include phoropters, slit lamps, autorefractors, tonometers, and visual acuity charts. They facilitate accurate detection of vision problems, eye diseases, and overall ocular condition.
The Eye Examination Equipment Market Report is Segmented by Product (OCT Scanners, Ophthalmic Ultrasound, Corneal Topography, Slit Lamps, Tonometers, Ophthalmoscopes, Perimeters, Fundus Cameras, and Other Products), End-User (Hospitals, Clinics, ASCs, Academic Institutes, and Other End-Users), Portability (Table-Top and Hand-Held), Technology (Digital and Analog), and Geography (North America, Europe, Asia-Pacific, Middle East & Africa, and South America). The market report also covers the estimated market sizes and trends for 17 countries across major regions globally. The report offers the value (in USD million) for the above segments.
| Optical Coherence Tomography (OCT) Scanners |
| Ophthalmic Ultrasound Imaging Systems |
| Corneal Topography & Tomography Systems |
| Slit Lamps |
| Tonometers |
| Direct & Indirect Ophthalmoscopes |
| Perimeters / Visual-Field Analysers |
| Fundus / Retinal Cameras |
| Other Products |
| Hospitals |
| Ophthalmology & Optometry Clinics |
| Ambulatory Surgical Centres (ASCs) |
| Academic & Research Institutes |
| Other End-Users |
| Table-Top Systems |
| Hand-Held / Portable Systems |
| Digital / Computer-Integrated |
| Analog / Mechanical |
| North America | United States |
| Canada | |
| Mexico | |
| Europe | Germany |
| United Kingdom | |
| France | |
| Italy | |
| Spain | |
| Rest Of Europe | |
| Asia-Pacific | China |
| Japan | |
| India | |
| Australia | |
| South Korea | |
| Rest Of Asia-Pacific | |
| Middle East & Africa | GCC |
| South Africa | |
| Rest Of Middle East & Africa | |
| South America | Brazil |
| Argentina | |
| Rest Of South America |
| By Product | Optical Coherence Tomography (OCT) Scanners | |
| Ophthalmic Ultrasound Imaging Systems | ||
| Corneal Topography & Tomography Systems | ||
| Slit Lamps | ||
| Tonometers | ||
| Direct & Indirect Ophthalmoscopes | ||
| Perimeters / Visual-Field Analysers | ||
| Fundus / Retinal Cameras | ||
| Other Products | ||
| By End-User | Hospitals | |
| Ophthalmology & Optometry Clinics | ||
| Ambulatory Surgical Centres (ASCs) | ||
| Academic & Research Institutes | ||
| Other End-Users | ||
| By Portability | Table-Top Systems | |
| Hand-Held / Portable Systems | ||
| By Technology | Digital / Computer-Integrated | |
| Analog / Mechanical | ||
| Geography | North America | United States |
| Canada | ||
| Mexico | ||
| Europe | Germany | |
| United Kingdom | ||
| France | ||
| Italy | ||
| Spain | ||
| Rest Of Europe | ||
| Asia-Pacific | China | |
| Japan | ||
| India | ||
| Australia | ||
| South Korea | ||
| Rest Of Asia-Pacific | ||
| Middle East & Africa | GCC | |
| South Africa | ||
| Rest Of Middle East & Africa | ||
| South America | Brazil | |
| Argentina | ||
| Rest Of South America | ||


Key Questions Answered in the Report
How large is the eye examination equipment market in 2026?
The eye examination equipment market size reaches USD 3.80 billion in 2026 and is on course to hit USD 5.21 billion by 2031.
Which product category grows the fastest through 2031?
Fundus and retinal cameras are projected to post an 8.54% CAGR, outpacing all other equipment categories.
Why are ambulatory centers important to equipment vendors?
Payers shift cataract and refractive cases to outpatient facilities, driving a 9.43% CAGR in equipment spending at these centers.
What makes Asia-Pacific the fastest-growing region?
Government mandates in China and India, combined with expanding tele-screening programs, deliver a 7.54% regional CAGR.
How are vendors mitigating high capital costs for clinics?
Manufacturers now offer zero-upfront leases tied to per-scan fees, converting large capital purchases into manageable operating expenses.
Which technology trend shapes future device design?
Cloud-connected platforms with embedded AI grading dominate new launches, enabling remote supervision and faster clinical decisions.
Page last updated on:


