Exercise And Weight Loss Apps Market Size and Share
Market Overview
| Study Period | 2020 - 2031 |
|---|---|
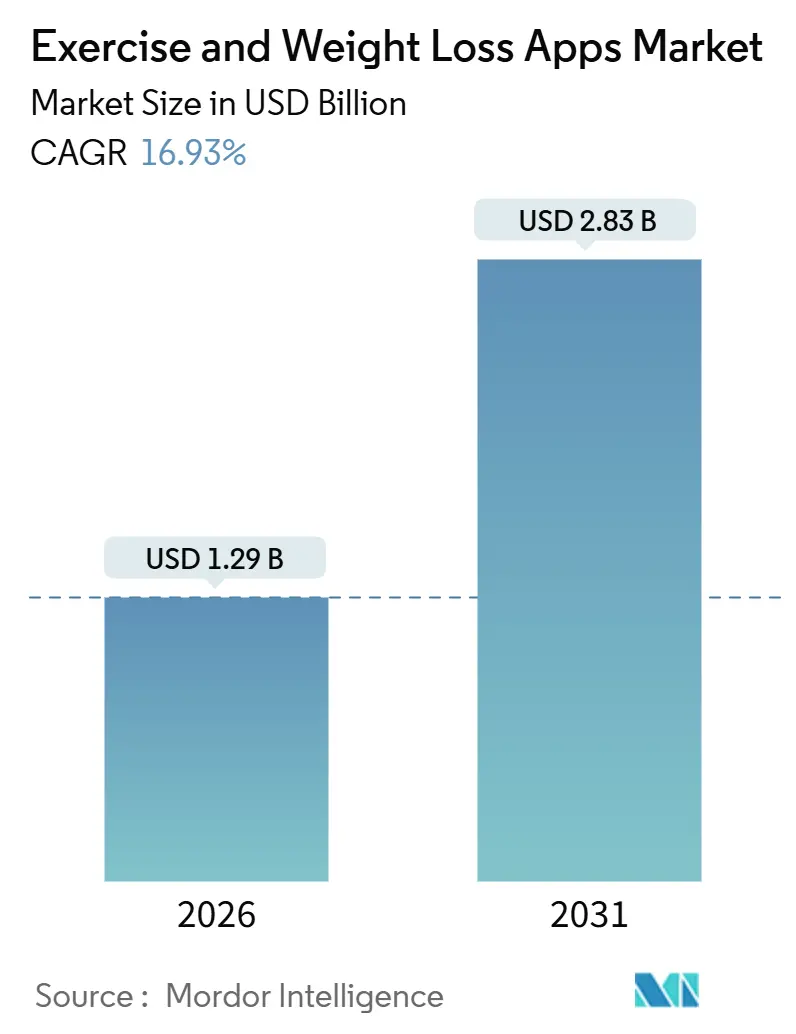
| Market Size (2026) | USD 1.29 Billion |
| Market Size (2031) | USD 2.83 Billion |
| Growth Rate (2026 - 2031) | 16.93% CAGR |
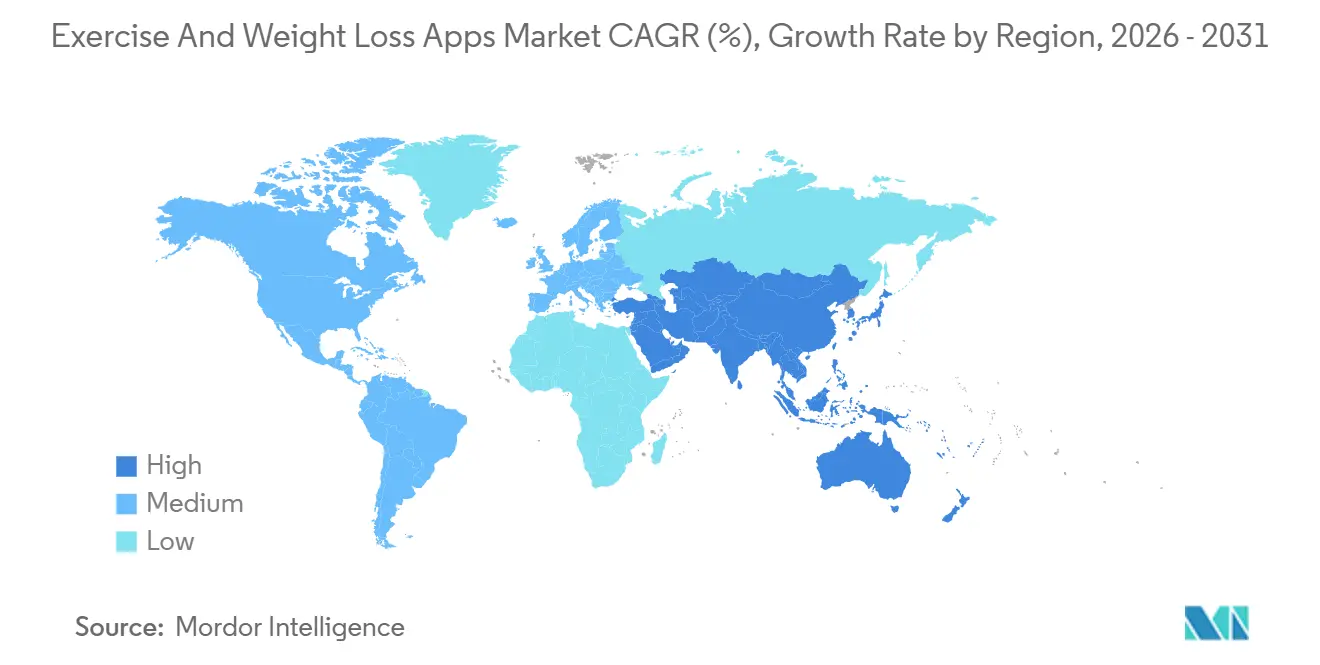
| Fastest Growing Market | Asia Pacific |
| Largest Market | North America |
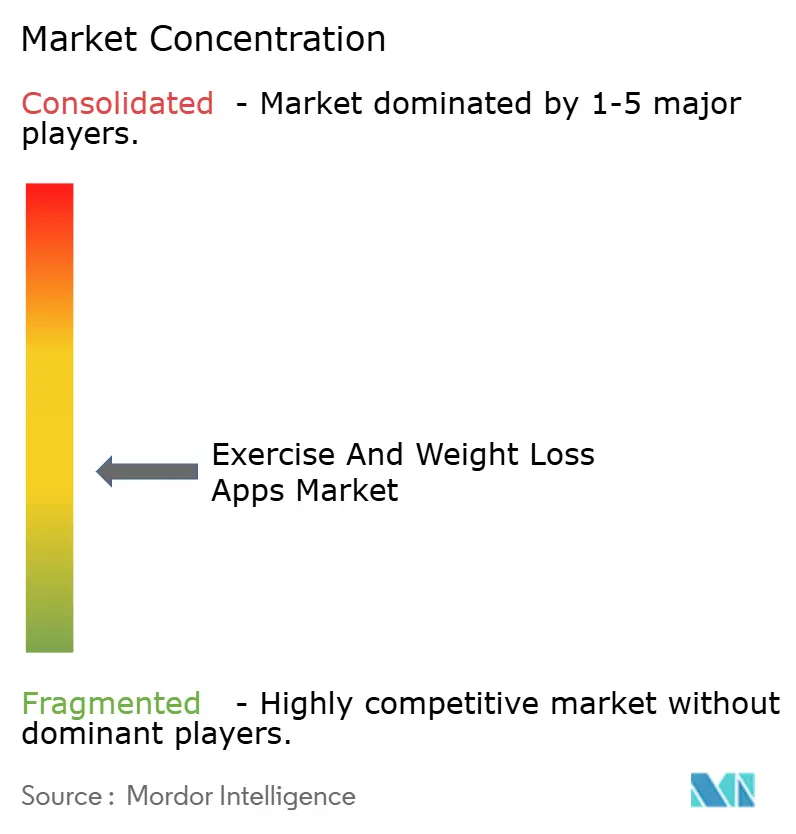
| Market Concentration | Medium |
Major Players *Disclaimer: Major Players sorted in no particular order Image © Mordor Intelligence. Reuse requires attribution under CC BY 4.0. | |
Exercise And Weight Loss Apps Market Analysis by Mordor Intelligence
The Exercise And Weight Loss Apps Market size is estimated at USD 1.29 billion in 2026, and is expected to reach USD 2.83 billion by 2031, at a CAGR of 16.93% during the forecast period (2026-2031).
Always-connected coaching, expanding wearable ownership, and employers subsidizing digital wellness benefits are accelerating adoption. Higher smartphone penetration in emerging economies, the global shift toward preventive healthcare, and the falling cost of on-device machine learning chips are reinforcing demand. Enterprises are bundling apps with employee-assistance plans to cut insurance costs, while stricter privacy rules in Europe and the United States raise the compliance bar, favoring well-capitalized developers. Competitive intensity remains high because no vendor controls more than 30% of the market share in any major geography, yet proprietary hardware ecosystems are consolidating mindshare among higher-income users. Venture funding continues to flow into AI-powered nutrition and VR-based workout platforms that promise stronger habit formation and lower churn.
Key Report Takeaways
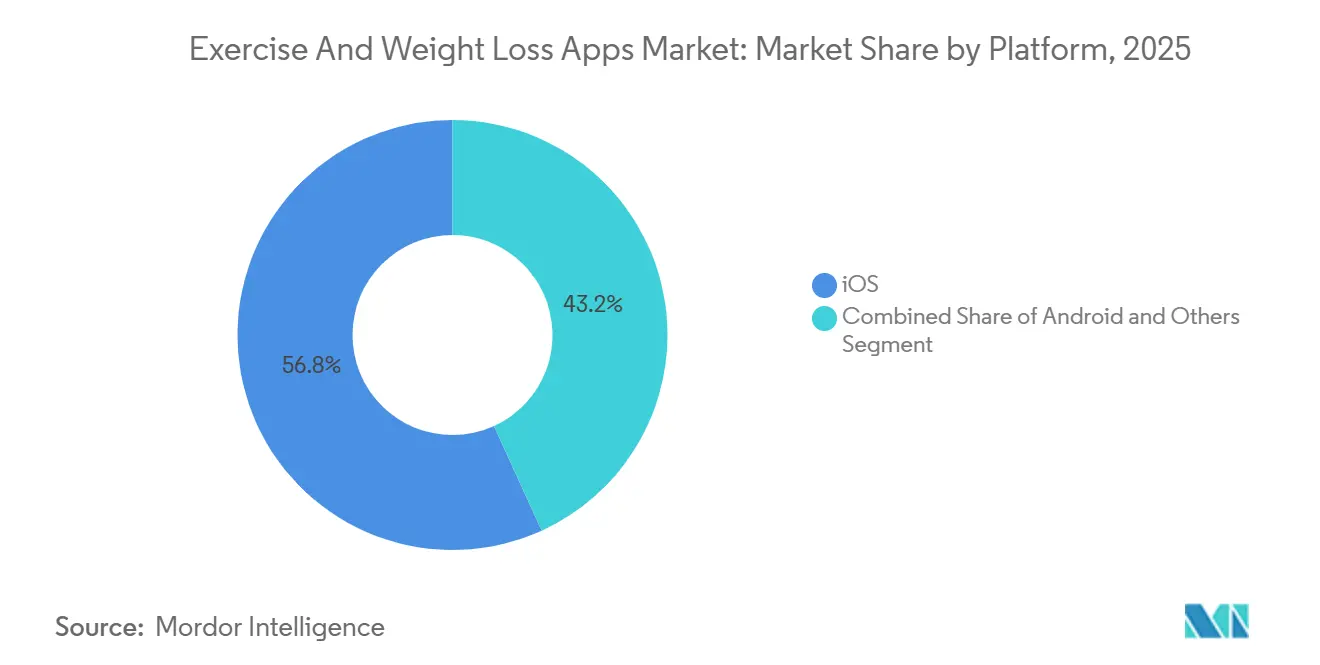
- By platform, iOS led with 56.81% revenue share in 2025, while WearOS & HarmonyOS combined are expanding at a 17.58% CAGR through 2031.
- By device type, smartphones captured 68.57% of the exercise & weight loss apps market in 2025; wearables are growing at a 19.31% CAGR through 2031.
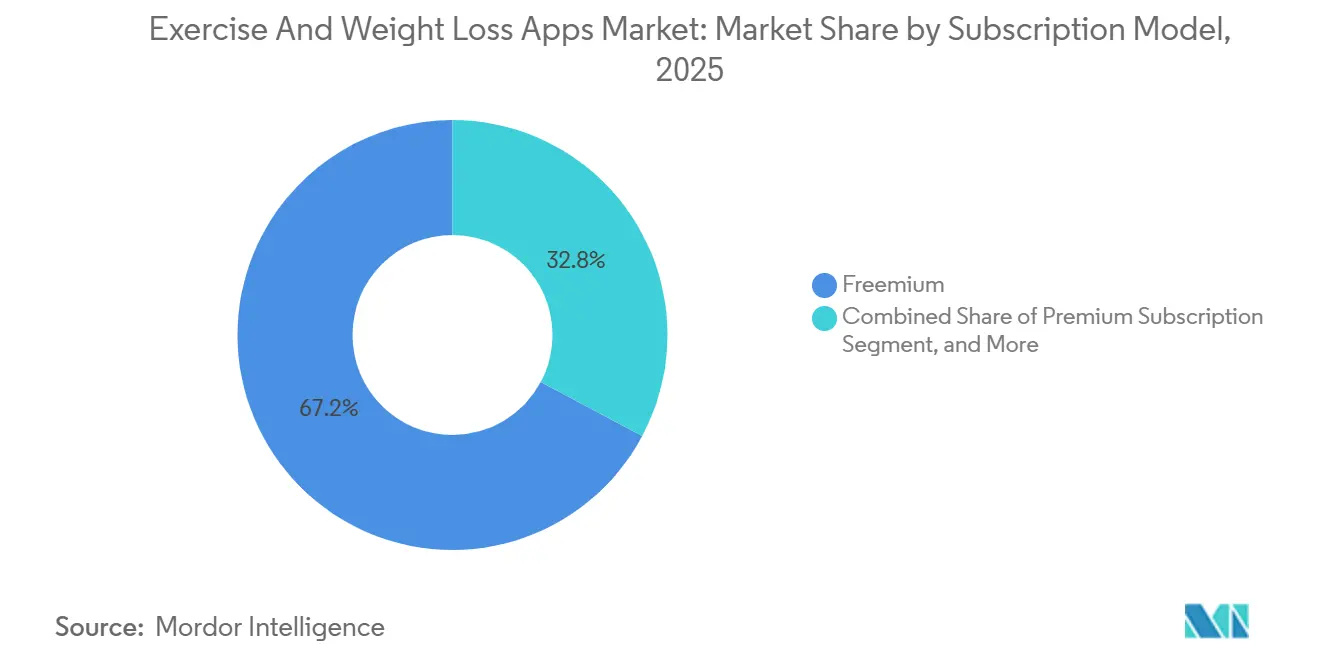
- In the subscription model, freemium held a 67.22% share in 2025, whereas premium subscriptions are advancing at a 18.04% CAGR.
- By geography, North America accounted for 39.83% of revenue in 2025, but Asia-Pacific is projected to register the fastest CAGR of 19.47% through 2031.
Note: Market size and forecast figures in this report are generated using Mordor Intelligence’s proprietary estimation framework, updated with the latest available data and insights as of January 2026.
Global Exercise And Weight Loss Apps Market Trends and Insights
Drivers Impact Analysis*
| Driver | (~) % Impact on CAGR Forecast | Geographic Relevance | Impact Timeline |
|---|---|---|---|
| Smartphone and wearable penetration boom | +3.2% | Global with APAC core and spill-over to MEA | Medium term (2-4 years) |
| Subscription-first revenue models gaining ARPU | +2.8% | North America and Europe, expanding to APAC | Short term (≤ 2 years) |
| Rising global obesity and wellness awareness | +3.5% | Global | Long term (≥ 4 years) |
| Employer-paid corporate wellness subsidies | +2.1% | North America, Western Europe, urban APAC hubs | Medium term (2-4 years) |
| AI image-recognition nutrition coaching | +2.4% | North America and Europe, early adoption in APAC | Short term (≤ 2 years) |
| AR/VR-based immersive workout gamification | +1.9% | North America, Europe, Japan, South Korea | Medium term (2-4 years) |
| Source: Mordor Intelligence | |||
Smartphone and Wearable Penetration Boom
Rising handset affordability and falling sensor prices mean that two out of every three adults worldwide now carry a device capable of continuous biometric capture.[1]ARM Holdings, “Machine-Learning-Ready Cortex Cores for Health Analytics,” arm.com Oura and WHOOP have opened APIs that stream heart rate variability and skin temperature data, allowing third-party apps to deliver real-time recovery advice. Garmin and Fitbit now expose over 500 endpoints to developers, widening the addressable sensor universe. As a result, the exercise & weight loss apps market is transitioning from episodic calorie logging to longitudinal coaching anchored in personalized metrics. The fragmentation of data schemas does raise engineering hurdles, yet studios that solve normalization enjoy defensible moats. APAC leads volume growth because India and Southeast Asia are leapfrogging PCs and adopting mobile-first fitness solutions at scale.
Subscription-First Revenue Models Gaining ARPU
Developers have discovered that annual contracts account for 67% of total subscription volume and deliver a median first-year lifetime value of USD 86.35, almost seven times the revenue generated by a single month of service. Median annual pricing is USD 39.99, a 65% discount over 12 individual monthly payments, which tempers churn while maintaining cash flow. Top-decile apps convert 68.3% of trial users by deferring paywalls until after three customized sessions, a tactic that visibly demonstrates value. However, revenue per install after 60 days averages only USD 0.63, so paid user acquisition must remain below that cost ceiling to protect margins. This math explains why inorganic marketing is viable only for titles with day-30 retention exceeding 8% on Android and 16% on iOS. Consequently, the exercise & weight loss apps market increasingly relies on high-engagement micro-cohorts rather than mass-download strategies.
Rising Global Obesity and Wellness Awareness
WHO estimates show that 2.11 billion adults lived with overweight or obesity in 2021, a figure on track to hit 3.8 billion by 2050 if lifestyles stay unchanged. Physical inactivity already saddles world health systems with USD 54 billion in care costs and USD 14 billion in lost productivity each. In the United States, 40.3% of adults meet medical obesity criteria, spurring employers to subsidize digital weight-loss tools that cost far less than bariatric surgery or long-term GLP-1 medication. These macro pressures translate into sustained demand for evidence-based mobile programs that promise measurable reductions in waistline. Applications that can verify a 5% body-weight loss over 12 months are winning inclusion in corporate benefit catalogs, reducing their customer-acquisition costs to near zero.
Employer-Paid Corporate Wellness Subsidies
Corporate wellness spending reached USD 61.2 billion in 2024 and is forecast to surpass USD 94 billion by 2026. In the Kaiser Family Foundation’s 2024 survey, 53% of large U.S. companies offered fitness app stipends, making mobile coaching one of the top three health perks, alongside gym reimbursement and biometric screenings. Vitality’s Active Rewards program boosted tracked activity days by 30.6% after it tied incentives to verified wearable data. Employers favor apps that anonymize individual metrics while still pushing aggregate dashboards to HR teams, a design that satisfies privacy mandates while delivering a return on investment. For developers, this B2B2C channel offers predictable revenue and lower churn because contracts run for multi-year benefit cycles. Consequently, enterprise sales pipelines are lengthening, but the exercise & weight loss apps market’s route to market is also professionalizing.
Restraints Impact Analysis*
| Restraint | (~) % Impact on CAGR Forecast | Geographic Relevance | Impact Timeline |
|---|---|---|---|
| Tightening health-data privacy regulation | -1.8% | Europe, North America, spreading globally | Short term (≤ 2 years) |
| High churn and low long-term retention | -2.3% | Global | Long term (≥ 4 years) |
| 30% app-store commission pressure | -1.2% | Global, acute on iOS | Medium term (2-4 years) |
| Companion-app saturation on smartwatches | -0.9% | North America, Europe, urban APAC | Medium term (2-4 years) |
| Source: Mordor Intelligence | |||
Tightening Health-Data Privacy Regulation
The European Data Protection Board issued EUR 1.58 billion in GDPR penalties during 2024, including a EUR 251 million fine against Meta for mishandling health data.[2]European Data Protection Board, “GDPR Enforcement Tracker 2024,” edpb.europa.eu The FTC expanded its Health Breach Notification Rule to cover any app that collects biometric data, even if it falls outside HIPAA’s traditional scope. Developers must now encrypt data at rest, appoint data protection officers, and publish algorithmic risk assessments. Compliance budgets divert resources from feature innovation, especially at studios with fewer than 50 employees.
High Churn and Low Long-Term Retention
AppsFlyer benchmarks show that 71% of fitness app users quit within 90 days, and day-30 retention averages only 8-12% on Android and 16% on iOS. ETH Zurich researchers demonstrated that day-7 engagement signals predict dropout with 86.5% accuracy, stressing the importance of early habit loops.[3]ETH Zurich, “Churn Prediction in Digital Health Apps,” ethz.ch The median trial-to-paid conversion rate is 39.9%, meaning fewer than two in five trialists ever pay.
*Our forecasts treat driver/restraint impacts as directional, not additive. The impact forecasts reflect baseline growth, mix effects, and variable interactions.
Segment Analysis
By Platform: iOS Premium Monetization Anchors Revenue
iOS controlled 56.81% share in 2025, reflecting its user base that spends 2.4 times more than Android owners on in-app purchases. The exercise & weight loss apps market share leadership on iOS is reinforced by curated discovery channels that reward polished interfaces, native Swift code, and high-resolution media. Annual plans priced above USD 50 achieve better conversion because Apple users exhibit lower price sensitivity. Android, despite a larger global install base, skews freemium; regionally tiered pricing and greater piracy drag average revenue per user below USD 5. The Others cluster—WearOS and HarmonyOS—will expand at a 17.58% CAGR, propelled by Huawei’s tightly integrated HarmonyOS stack in China and Samsung’s repositioning of WearOS watches as fitness-first devices. Apple’s compliance with the EU Digital Markets Act introduced alternative stores but imposed a EUR 0.50 core-technology fee on each annual download, dampening incentives to bypass the App Store.
A secondary factor behind iOS dominance is the rising attach rate of Apple Watch, which deepens ecosystem lock-in. Android developers face additional friction because Google’s Health Connect will replace Google Fit in 2026, forcing code migrations. HarmonyOS offers lucrative access to China’s vast user pool but demands local data residency, multiple payment integrations, and state-mandated content audits. In sum, studios treat iOS as the premium gateway, Android as the volume play, and Others as strategic bets tied to regional expansions.


By Device Type: Wearables Close the Coaching Loop
Smartphones held 68.57% of the exercise & weight loss apps market size in 2025, yet wearables are posting a robust 19.31% CAGR and are projected to bridge the gap by 2031. Continuous heart-rate, GPS, and sleep-stage capture transform episodic workouts into longitudinal health journeys. Apple HealthKit remains the most widely synchronized API, but it requires a paired iPhone for full data access, limiting autonomous Apple Watch scenarios. Garmin, Fitbit, and WHOOP expose raw sensor streams that third-party apps use to deliver personalized training-load alerts and injury-risk forecasts. Tablets remain a niche, consumed mostly in living-room yoga or cycling sessions, where larger displays enhance form visualization.
As wearables become the primary ingestion layer and phones the visualization layer, developers who master multi-device orchestration enjoy higher net promoter scores. Peloton’s 2025 decision to sync workout records with Apple Health, Garmin, and Fitbit without needing Peloton hardware shows that even hardware incumbents must embrace openness. Fragmentation imposes maintenance costs because each OEM enforces distinct authentication flows and rate limits, yet those who normalize data feeds gain a defensible competitive edge.
By Subscription Model: Annual Contracts Lock in Lifetime Value
Freemium apps dominated with a 67.22% share in 2025, exploiting zero-friction onboarding to build large funnels. Still, premium subscriptions are scaling faster at an 18.04% CAGR because annual plans lock users in and smooth revenue. Trial-to-paid conversion hinges on personalized onboarding: apps that tailor workouts within the first session retain twice as many users beyond 90 days. Pay-per-feature and one-time purchases now account for less than 5% of revenue, a niche favored by calorie-tracking plug-ins and advanced analytics modules that power users buy on top of base subscriptions.
Developers face a razor-thin acquisition window, as revenue per install averages USD 0.63 after 2 months. To acquire profitably, they either negotiate corporate-wellness contracts in which employers subsidize fees or invest in content that drives organic referral traffic. Premium titles that combine live coaching, AI meal recognition, and social leaderboards show the flattest churn curves, validating the bet on bundled value.
Geography Analysis
North America generated 39.83% of global revenue in 2025, and the United States alone recorded a 35.1% user penetration rate for fitness apps. Employer health plans amplify adoption by subsidizing app subscriptions, creating steady corporate demand. Regulatory headwinds are manageable: the FTC now treats wellness apps as covered entities for breach purposes, but clear disclosure and encryption remain sufficient safeguards. Canada mirrors U.S. patterns in metropolitan corridors, while Mexico lags due to inconsistent 4G coverage and lower disposable income. Collectively, North America remains the region with the highest ARPU, averaging USD 14 per paying subscriber per month.
Europe follows with strong but regulation-shaped momentum. GDPR fines reached EUR 1.58 billion in 2024, and the Digital Services Act requires algorithmic risk audits for health apps. Germany, the United Kingdom, and France are leading the way in adoption thanks to national health systems that reimburse certain digital therapeutics. Yet, stringent consent flows reduce personalization by limiting data combinations. Southern and Eastern Europe are catching up as telecom costs fall and localized multilingual content improves retention.
Asia-Pacific is the fastest mover at a 19.47% CAGR, propelled by India’s smartphone boom and China’s HarmonyOS push. HealthifyMe’s USD 45 million Series D, raised in 2024, underwrites U.S. expansion and also cements leadership in vernacular AI nutrition coaching for Indians. China remains a parallel universe where Keep and Codoon monetize through mini-programs inside WeChat and Alipay. Japan and South Korea rank among the world’s highest adopters of wearables, driving experiments with AR-enhanced running routes. Southeast Asia shows double-digit user growth as 5G networks roll out and handset prices dip below USD 120.
The Middle East, Africa, and South America remain emerging territories. Gulf Cooperation Council states boast above-average ARPU due to high iOS penetration, while Brazil leads Latin America in installs but contends with currency volatility. Infrastructure gaps and lower healthcare spend per capita keep these regions below 10% combined share, but long-term upside is substantial once connectivity and payment rails mature.

Competitive Landscape
Apple Fitness+ ties content to Apple Watch and leverages deep iOS integration, sustaining subscriber retention near 90% annually. Samsung Health counters with FlexIt live-training content on Tizen smart TVs, extending workouts from wrist to living room. MyFitnessPal leads the way in calorie tracking with a 14-million-item food database and a freemium model that monetizes through ad-free and advanced macro analytics. Strava focuses on social leaderboards and GPS-mapped activities, but its Android day-30 retention is 8%, half its iOS metric, highlighting platform-specific engagement gaps.
Peloton exemplifies a hardware-first player pivoting toward platform neutrality. The 2025 integration with Apple Health, Garmin, and Fitbit indicates recognition that consumers demand data portability. Noom applies cognitive-behavioral prompts to weight loss, drawing paying users who seek coach-led accountability. Emerging disruptors include January AI, which predicts glycemic response, and FitXR, which gamifies cardio in VR headsets, raising barriers for copycat entrants through proprietary datasets and immersive IP.
Strategic themes now center on API breadth, legal defensibility, and omnichannel presence. Garmin’s Health SDK and Fitbit’s Web API each support more than 500 integrations, encouraging developers to join walled gardens in exchange for massive sensor datasets. Privacy compliance constitutes a rising moat; studios holding ISO 27701 certifications find B2B deals easier to close. With smaller players squeezed by 30% store commissions and rising acquisition costs, mergers have accelerated, favoring platforms with recurring revenue above USD 50 million and churn below 5% per month.
Exercise And Weight Loss Apps Industry Leaders
HealthifyMe
MyFitnessPal
Peloton
Garmin Connect
Apple
- *Disclaimer: Major Players sorted in no particular order

Recent Industry Developments
- January 2026: Oura opened its real-time body temperature stream to third-party apps after completing FDA clearance for its illness-detection algorithms.
- October 2025: Peloton integrated its app with Apple Health, Garmin Connect, and Fitbit to deliver cross-platform workout syncing without proprietary hardware.
- October 2024: HealthifyMe raised USD 45 million in Series D funding to expand AI nutrition coaching across the United States and Southeast Asia.
- February 2024: Samsung partnered with FlexIt to deploy personal-trainer videos through the Samsung Daily+ hub on Tizen smart TVs.


Global Exercise And Weight Loss Apps Market Report Scope
The Exercise and Weight Loss Apps Market is defined as the global industry segment that develops mobile and digital applications designed to help users track workouts, monitor diet and nutrition, manage weight, and improve overall fitness through personalized programs, data analytics, and interactive features.
The Exercise & Weight Loss Apps Market Report is Segmented by Platform (iOS, Android, Others), Device Type (Smartphones, Tablets, Wearables), Subscription Model (Freemium, Premium Subscription, Pay-per-Feature), and Geography (North America, Europe, Asia-Pacific, Middle East & Africa, South America). Market Forecasts are Provided in Terms of Value (USD).
| iOS |
| Android |
| Others (WearOS, HarmonyOS, etc.) |
| Smartphones |
| Tablets |
| Wearables |
| Freemium |
| Premium Subscription |
| Pay-per-Feature / One-time Purchase |
| North America | United States |
| Canada | |
| Mexico | |
| Europe | Germany |
| United Kingdom | |
| France | |
| Italy | |
| Spain | |
| Rest of Europe | |
| Asia-Pacific | China |
| Japan | |
| India | |
| Australia | |
| South Korea | |
| Rest of Asia-Pacific | |
| Middle East & Africa | GCC |
| South Africa | |
| Rest of Middle East & Africa | |
| South America | Brazil |
| Argentina | |
| Rest of South America |
| By Platform | iOS | |
| Android | ||
| Others (WearOS, HarmonyOS, etc.) | ||
| By Device Type | Smartphones | |
| Tablets | ||
| Wearables | ||
| By Subscription Model | Freemium | |
| Premium Subscription | ||
| Pay-per-Feature / One-time Purchase | ||
| By Geography | North America | United States |
| Canada | ||
| Mexico | ||
| Europe | Germany | |
| United Kingdom | ||
| France | ||
| Italy | ||
| Spain | ||
| Rest of Europe | ||
| Asia-Pacific | China | |
| Japan | ||
| India | ||
| Australia | ||
| South Korea | ||
| Rest of Asia-Pacific | ||
| Middle East & Africa | GCC | |
| South Africa | ||
| Rest of Middle East & Africa | ||
| South America | Brazil | |
| Argentina | ||
| Rest of South America | ||


Key Questions Answered in the Report
What is the current value of the exercise & weight loss apps market?
The exercise & weight-loss apps market stood at USD 1.29 billion in 2026 and is projected to reach USD 2.83 billion by 2031.
Which platform delivers the highest revenue share?
IOS leads with 56.81% share, supported by users who spend more per subscription and convert trials at higher rates.
Which device segment is expanding fastest?
Wearables are growing at a 19.31% CAGR, driven by continuous biometric sensing and deeper coaching integrations.
Why are employers subsidizing fitness apps?
Corporate wellness programs aim to curb healthcare costs, and 53% of large U.S. firms already offer fitness-app stipends.
What regulatory risk should developers monitor most closely?
Tightening privacy rules under GDPR and the U.S. FTC’s Health Breach Notification Rule now require end-to-end encryption and breach disclosure for apps that handle biometric data.
Page last updated on:


