
Europe Urban Logistics Market Size and Share
Market Overview
| Study Period | 2020 - 2031 |
|---|---|
| Forecast Data Period | 2026 - 2031 |
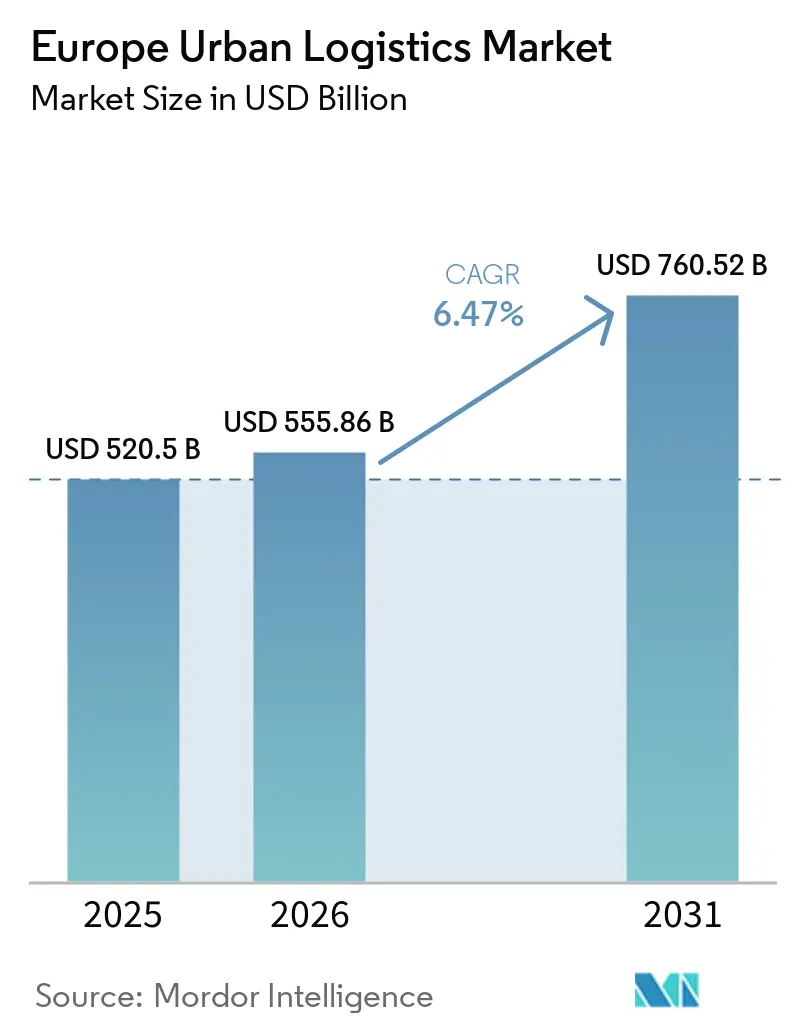
| Base Year Market Size (2025) | USD 520.5 Billion |
| Market Size (2026) | USD 555.86 Billion |
| Market Size (2031) | USD 760.52 Billion |
| Growth Rate (2026 - 2031) | 6.47 % |
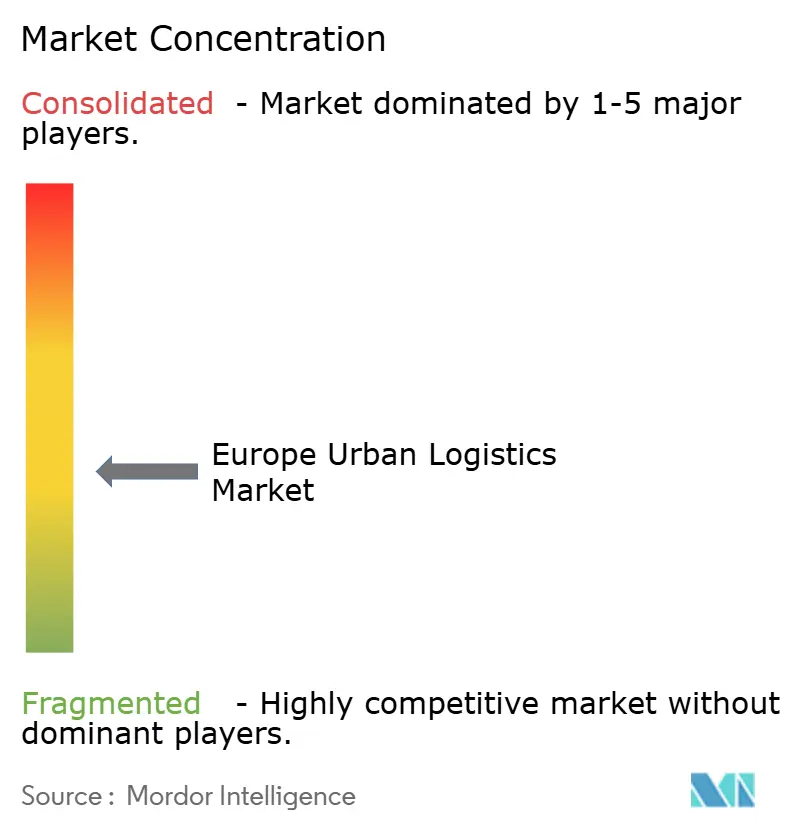
| Market Concentration | Medium |
Major Players *Disclaimer: Major Players sorted in no particular order Image © Mordor Intelligence. Reuse requires attribution under CC BY 4.0. | |
Europe Urban Logistics Market Analysis by Mordor Intelligence
The Europe urban logistics market size was valued at USD 520.50 billion in 2025 and is estimated to grow from USD 555.86 billion in 2026 to reach USD 760.52 billion by 2031, at a CAGR of 6.47% during the forecast period (2026-2031).
The Europe urban logistics market is being reshaped as parcel volumes concentrate in dense cities and delivery expectations become shorter. E-commerce, direct-to-patient medicine distribution, and quick-commerce services are increasing the need to hold inventory closer to consumers. This shift favors micro-hubs, parcel lockers, and coordinated delivery routes over dispatches from distant depots. Competitive pressure is also rising as platforms seek to offer faster delivery in London, Paris, and Berlin. A shortage of qualified drivers and tighter city access rules are raising the value of dense networks, compliant fleets, and reliable local operating capacity.
Key Report Takeaways
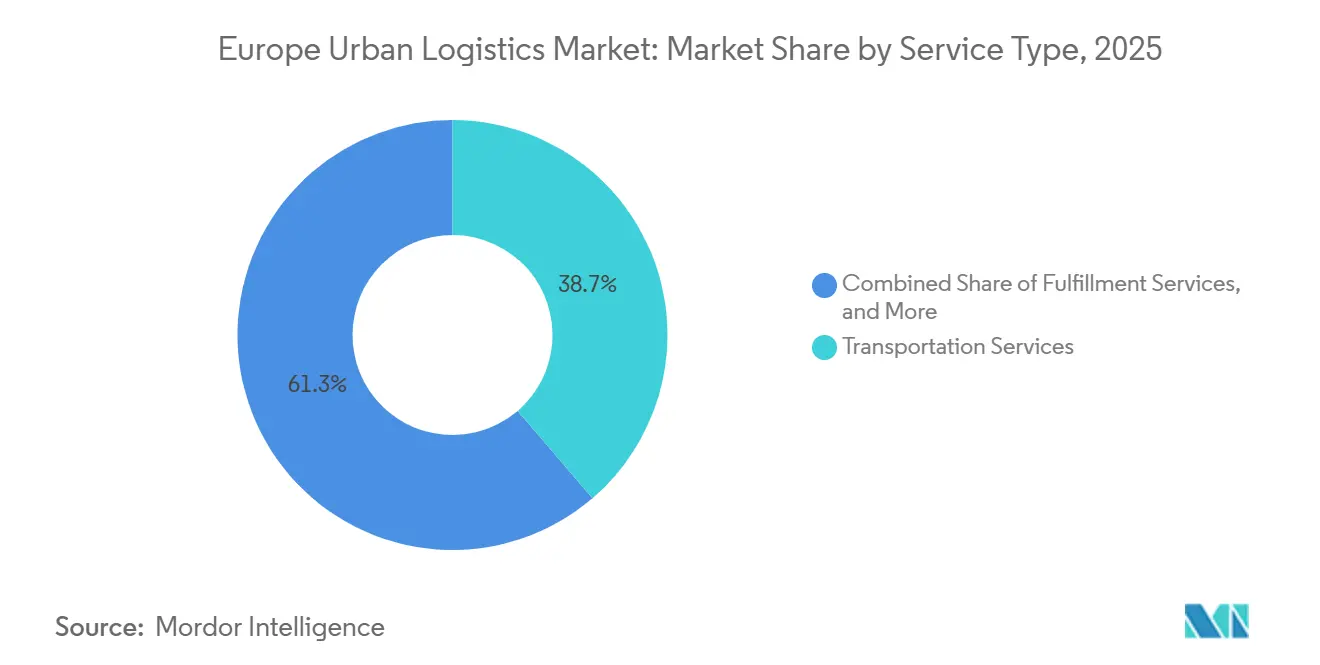
- By service type, transportation services held 38.71% of the Europe urban logistics market share in 2025, while the reverse logistics services segment is forecast to grow at an 8.39% CAGR through 2031.
- By delivery speed, standard delivery held 76.90% of the Europe urban logistics market size in 2025, while the instant and same-day delivery segment is forecast to grow at a 7.56% CAGR through 2031.
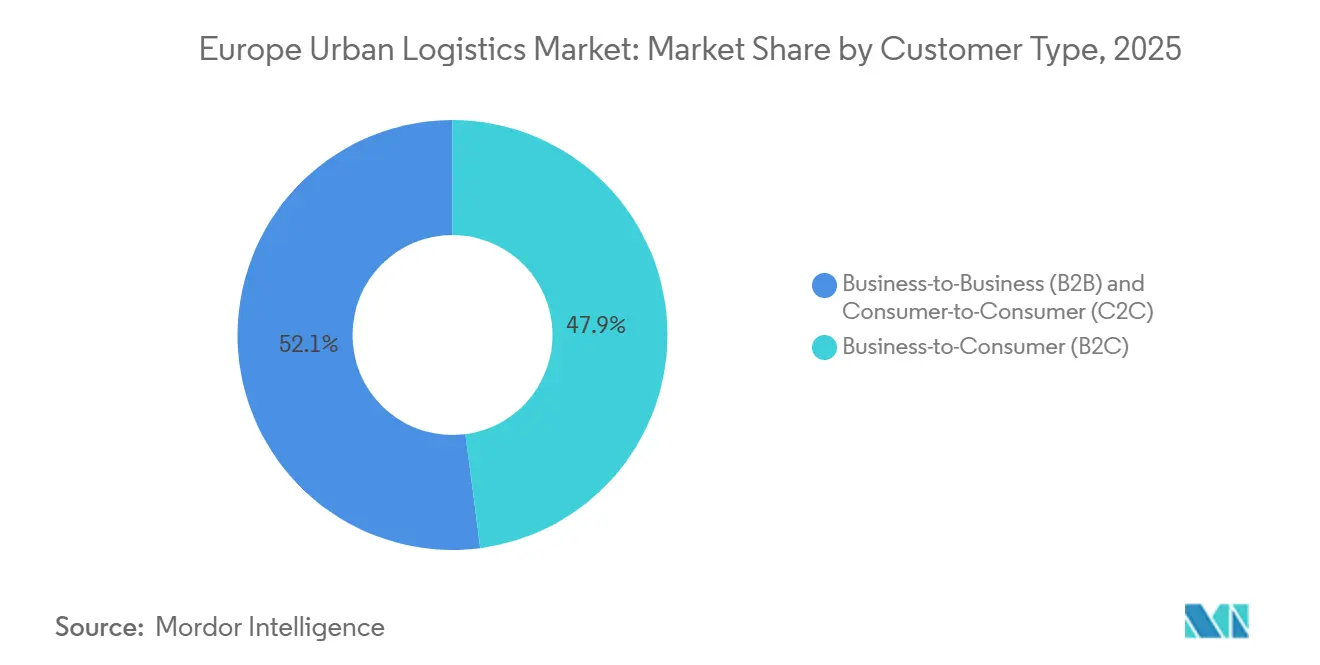
- By customer type, B2C held 47.94% of the Europe urban logistics market share in 2025, while C2C is forecast to grow at a 9.33% CAGR through 2031.
- By end-use industry, e-commerce and retail held 34.13% of the Europe urban logistics market size in 2025, while the healthcare and pharmaceuticals segment is forecast to grow at a 9.10% CAGR through 2031.
- By geography, Germany held 27.47% in 2025, while Poland is forecast to grow at a 7.94% CAGR through 2031.
Note: Market size and forecast figures in this report are generated using Mordor Intelligence’s proprietary estimation framework, updated with the latest available data and insights as of January 2026.
Market Trends and Insights
Drivers Impact Analysis of Europe Urban Logistics Market*
| Driver | (~) % Impact on CAGR Forecast | Geographic Relevance | Impact Timeline |
|---|---|---|---|
| E-Commerce Fulfillment Density | +2.0% | Global, concentrated in Germany, United Kingdom, France, Netherlands, Belgium, Poland | Short term (≤ 2 years) |
| Parcel-Locker and PUDO Network Expansion | +0.9% | Germany, Poland, France, Nordics, United Kingdom | Medium term (2-4 years) |
| Same-Day and Quick-Commerce Demand | +1.3% | London, Paris, Berlin, Amsterdam, Madrid | Short term (≤ 2 years) |
| Zero-Emission-Zone Fleet Transition | +0.5% | Netherlands, Germany, France, United Kingdom, Nordics | Medium term (2-4 years) |
| Vacant Retail and Parking Assets for Micro-Hubs | +0.6% | London, Berlin, Munich, Paris | Medium term (2-4 years) |
| AI-Enabled Routing and Curb-Time Optimization | +0.7% | Pan-European, with early gains in dense metro corridors | Long term (≥ 4 years) |
| Source: Mordor Intelligence | |||
E-Commerce Fulfillment Density
E-commerce density is a central driver of the European urban logistics market because it increases the number of deliveries that can be served from each urban route. Higher online retail activity also reduces the delivery window that shoppers and merchants consider acceptable. Operators are therefore moving inventory closer to consumers instead of adding capacity to routes from outer-city locations. The March 2026 launch of JD.com’s Joybuy platform in 6 European markets offered same-day delivery to more than 15 million households in London, Paris, and Berlin[1]. This service model raises the competitive standard for established carriers and their shipper relationships. Dense local operations can reduce the cost per drop, which makes city-adjacent sites more important for the Europe urban logistics market.
Same-Day and Quick-Commerce Demand
Quick commerce is expanding across Western European cities as consumers expect short delivery windows for more purchase categories. Flink operated 160 fulfillment hubs across Germany and the Netherlands, with an average basket value above EUR 45.0 (USD 52.9), when it raised USD 100.0 million in March 2026[2]. The company’s targeted expansion approach showed that dense operations and disciplined hub selection remained important to profitability. The European urban logistics market, therefore, needs smaller sites that can place inventory near demand, even when those sites do not fit traditional warehouse economics. Same-day expectations are extending from grocery to fashion, consumer electronics, and healthcare. This broadens the customer base for operators that can handle different parcel types through one local network.
Zero-Emission-Zone Fleet Transition
Zero-emission-zone requirements are driving a major fleet and charging investment cycle in the European urban logistics market. The Netherlands applied its ZEZ-F rollout to 18 cities, including Amsterdam, Rotterdam, and Utrecht, from January 2025. Battery-electric vans accounted for 78% of new van registrations in ZEZ municipalities during the first half of 2025, compared with 11% in the first half of the previous year[3]. The pattern directs spending toward smaller electric vehicles and depot-based charging, which favors operators with established urban sites. More than 320 low-emission and zero-emission zones were active or planned across Europe, while EU action on corporate fleets supported the same direction. Operators that delay fleet renewal could lose access to dense city corridors as demand rises.
AI-Enabled Zonal Routing and Curb-Time Optimization
Artificial intelligence is moving from route-planning trials into day-to-day urban delivery operations. A 2025 Scientific Reports study found that an AI-supported dynamic routing framework reduced total operating costs by 24.3% in a realistic urban delivery scenario. The same study raised on-time delivery performance to 92.8% by allowing routes to respond to traffic and changing access conditions[4]. In the European urban logistics market, this capability can help operators serve dense corridors without adding vehicles. Digital curbside booking trials in Berlin and Padua also show that loading-zone access is becoming an operational input rather than a simple scheduling issue. Better stop-level information can reduce failed deliveries, redelivery costs, and vehicle dwell time.
Restraints Impact Analysis of Europe Urban Logistics Market*
| Restraint | (~) % Impact on CAGR Forecast | Geographic Relevance | Impact Timeline |
|---|---|---|---|
| Driver Shortages and Wage Inflation | -1.2% | Pan-European, most acute in Germany, Netherlands, United Kingdom, Poland | Short term (≤ 2 years) |
| Urban Access Restrictions and Compliance Costs | -0.9% | Netherlands, Germany, France, United Kingdom, Nordics | Medium term (2-4 years) |
| Scarcity of Inner-City Logistics Real Estate | -0.7% | London, Paris, Amsterdam, Berlin, Milan | Long term (≥ 4 years) |
| Fragmented Curbside and Zero-Emission-Zone Rules | -0.5% | Germany, France, Belgium, Netherlands, United Kingdom | Medium term (2-4 years) |
| Source: Mordor Intelligence | |||
Driver Shortages and Wage Inflation
A limited workforce remains a structural constraint for the European urban logistics market, even when freight demand weakens. The European Parliament Research Service identified road transport workforce conditions as a continuing policy and labor issue across Europe. Rising wage pressure can be especially difficult for smaller carriers that depend on flexible local labor. Smaller operators also face the costs of electric vehicle replacement and compliance certification at the same time. These pressures can reduce their ability to compete for city-center contracts. Scaled networks with deeper resources may gain a stronger position as labor availability remains limited.
Urban Access Restrictions and Compliance Costs
City access restrictions create uneven costs for the European urban logistics market because carriers do not begin with the same fleet age or financial capacity. Operators serving several countries must track different zone boundaries, vehicle rules, enforcement dates, and local permits. Compliance administration can remain demanding even when a carrier operates at scale. Route changes around restricted areas can add distance per drop in the most valuable delivery corridors. Scarcity of inner-city sites also makes it harder to relocate inventory nearer to demand. Fragmented curbside and zero-emission-zone rules add another layer of planning for carriers serving multiple cities.
*Our forecasts treat driver/restraint impacts as directional, not additive. The impact forecasts reflect baseline growth, mix effects, and variable interactions.
Europe Urban Logistics Market Segment Analysis
By Service Type:
Transportation Services Lead While Reverse Logistics Gains GroundTransportation services held 38.71% of the Europe urban logistics market size by service type in 2025. Linehaul, last-mile van operations, and courier networks remained the operational base of urban parcel delivery. The scale of routine parcel supported the segment’s volume position flows across cities. Still, margins faced pressure from labor costs, vehicle compliance requirements, and the need for higher route density. Consolidated dispatch from micro-hubs can improve the economics of local delivery compared with single-leg operations from distant facilities. Fulfillment Services became more important as retailers and grocery operators shifted picking and packing into city-core sites below 4,000 m².
Reverse logistics services is forecast to expand at an 8.39% CAGR through 2031, the fastest rate among service types. Extended producer responsibility frameworks and the Ecodesign for Sustainable Products Regulation are increasing the need for documented recovery processes across electronics, textiles, and packaging. Mandatory textile collection obligations in France during 2025 and tighter plastic packaging collection targets in Germany added collection, sorting, and re-commerce activities within cities. The Europe urban logistics industry can support these flows through returns processing at local hubs. Multi-carrier returns capability can serve both compliance needs and the value recovery from recommerce.

By Delivery Speed:
Standard Delivery Leads While Instant Services ExpandStandard delivery held 76.90% of the Europe urban logistics market share in 2025. Its scale made route density, drop rates, and cost per kilometer important operating measures that can affect earnings across large delivery volumes. Next-day delivery retained a strong role in B2B shipments and time-sensitive consumer orders. It can command a service premium without the full infrastructure demands of instant delivery. Scheduled delivery also remained relevant for subscription retail and grocery services, where reliability was more important than speed.
Instant and same-day delivery is forecast to expand at a 7.56% CAGR through 2031. Platform competition and consumer experience with rapid grocery delivery are supporting this growth in dense cities. This delivery tier benefits from micro-hubs, routing systems, and electric cargo bikes that can also support standard delivery. The Urban Microhub Alliance in London targeted more than 1 million green parcel deliveries in 2026 from repurposed parking and railway-arch sites. Investment in speed-tier infrastructure can improve both premium and standard delivery operations when volumes are concentrated in city areas.
By Customer Type:
B2C Leads While C2C Adds Recommerce FlowsB2C accounted for 47.94% of the Europe urban logistics market share by customer type in 2025. It remained the main source of volume for parcel carriers, last-mile platforms, and out-of-home locker networks. Promotional events and seasonal retail cycles created material changes in delivery volumes, which favored flexible capacity and locker-supported delivery models. B2B retained a stable role in healthcare, automotive parts, and industrial components. Service agreements and traceability requirements can support premium urban delivery contracts in those categories.
C2C is forecast to grow at a 9.33% CAGR through 2031, the highest rate among customer types. Recommerce platforms are integrating logistics more closely into their customer experience and retention models. DHL reported that 57% of European consumers regularly sold through online marketplaces in 2026, while the figure reached 67% in Germany and the Netherlands. These parcels are generally smaller and align well with lockers and pickup points. Carriers can use the same physical network for C2C shipments, outbound B2C parcels, and returns.
By End-Use Industry:
Retail Leads While Healthcare and Pharmaceuticals AdvanceE-commerce and retail held 34.13% of the Europe urban logistics market size by end-use industry in 2025. The category included mass consumer goods, same-day grocery delivery, and high-value fashion with different delivery speeds and return needs. Carriers, therefore, needed to operate several local service levels. Food and beverage formed the second-largest demand pool as online grocery and quick commerce grew. Consumer electronics, fashion, and apparel also generated high-value parcel volumes and substantial returns activity, making reverse logistics capability important for serving these customers competitively.
The healthcare and pharmaceuticals segment is forecast to grow at a 9.10% CAGR through 2031. Direct-to-patient medicine delivery and tighter cold-chain needs are increasing the role of specialized local operations. The European Medicines Agency’s 2025 decision allowed Wegovy to be transported at temperatures up to 30°C for 48 hours during last-mile distribution, expanding the range of eligible vehicles and reducing some cold-chain requirements. Gordon Delivery expanded its cold-chain home-delivery partnership with Apotea in July 2026 to reach 9.5 million people in Sweden. Automotive parts and industrial and manufacturing continued to provide predictable B2B delivery requirements.
Geography Analysis
Germany Urban Logistics Market
Germany held 27.47% of the Europe urban logistics market size by country in 2025. Its position reflected dense cities, a large e-commerce and manufacturing base, and an established carrier and third-party logistics infrastructure. The Europe urban logistics market faced demand and supply pressure in Germany as carriers served high parcel volumes under tighter access expectations. Zero-emission zones in cities such as Berlin, Hamburg, and Munich were advancing vehicle investment needs and reinforcing the importance of compliant fleets and local operating capacity.
Broader European Markets
The United Kingdom held the second-largest country position, supported by a competitive last-mile sector and sustained investment in London micro-hubs. Brownfield and underground logistics locations in London remained relevant where proximity to customers justified higher rental costs. France, Italy, Spain, Belgium, and the Netherlands were mature urban delivery environments with different regulatory and infrastructure conditions. Milan, Rome, Madrid, and Barcelona attracted interest in logistics assets as supply constraints increased rental pressure. The Netherlands showed the rapid effect of zero-emission zones on van replacement and the value of combining local sites with electric fleet operations.
Poland and Nordics Urban Logistics Market
Poland is forecast to grow at a 7.94% CAGR through 2031, the fastest country rate in the Europe urban logistics market. Rising e-commerce use, higher household incomes, and a larger role in European carrier networks supported this outlook. Urban logistics development in Kraków reflected the growing role of specialized facilities in the country, including sites that support local inventory positioning for delivery operators. Planned automation and low-emission building systems also reflected the infrastructure needed to support same-day and next-day delivery. Nordic countries retained high parcel volumes per person and demanding delivery standards, with lockers as the leading consumer delivery preference in Finland.
Competitive Landscape
The Europe urban logistics market remained moderately fragmented, with pan-European carriers, national postal operators, specialist providers, and technology-enabled platforms competing across city delivery networks. Larger carriers held important parcel and out-of-home infrastructure positions, while specialists served individual cities and operating niches. Network density and the ability to meet access rules are key bases of competition. Geopost reached 140,000 out-of-home points in 28 European countries, including 100,000 parcel shops and 40,000 lockers. Its out-of-home volumes rose 26%, while 46% of regular European online shoppers preferred out-of-home delivery.
Carriers are combining locker expansion with fleet electrification to strengthen their local networks. GXO is also focusing on operational intelligence rather than network scale alone. GXO IQ was expected to operate in 50 logistics facilities by the end of 2026, alongside trials of AI-driven autonomous material-handling vehicles in European facilities.
Competition in smaller secondary cities across Eastern and Southern Europe remained less developed than in major Western European metropolitan areas. Locker density, same-day capacity, and pharmaceutical-grade cold-chain services were still limited in many of those locations. This created room for consolidation and new sites where operators accepted longer investment payback periods. Amazon Logistics Europe, Evri, and XPO Logistics Europe are relevant additions for coverage of urban last-mile, locker, contract-logistics, and B2B activity. Their roles broaden the comparison across retailer-linked operations, national parcel networks, and contract logistics. The Europe urban logistics market has room for both scaled carriers and local specialists, although capital and compliance demands favor better-resourced networks.
Europe Urban Logistics Industry Leaders
-
DHL Group
-
GeoPost SA
-
GLS Group
-
United Parcel Service, Inc.
-
FedEx Corporation
- *Disclaimer: Major Players sorted in no particular order
Europe Urban Logistics Market Companies Covered in this Report
- DHL Group
- GeoPost SA
- GLS Group
- United Parcel Service, Inc.
- FedEx Corporation
- DSV A/S
- Kuehne + Nagel International AG
- GEODIS SA
- CEVA Logistics AG
- DACHSER SE
- Rhenus SE & Co. KG
- GXO Logistics, Inc.
- ID Logistics Group
- STEF SA
- InPost SA
- Poste Italiane S.p.A.
- Koninklijke PostNL NV
- PostNord AB
- Posten Bring AS
- bpost SA/NV
- Correos Express Paquetería Urgente, SA, SME
- Amazon Logistics
Recent Industry Developments in Europe Urban Logistics Market
- June 2026: DHL Group announced a EUR 160 million (USD 188.21 million) investment plan for its French logistics infrastructure from 2026 to 2027, encompassing warehouse expansions in southern Paris, Orléans, and Lyon, and accelerated fleet electrification across its Supply Chain, Freight, and Global Forwarding divisions.
- March 2026: GXO Logistics deployed its first AI-driven autonomous industrial truck, powered by KION’s NVIDIA-based Physical AI technology, at its facility in Épinoy, France, one of the earliest live deployments of AI-native material handling in a high-volume European urban logistics site.
- March 2026: DACHSER achieved emission-free deliveries across 25 European cities in 10 countries, operating 60 electric vehicles and 13 cargo bikes through its Emission-Free Delivery program. The network, which includes London, Paris, Berlin, Amsterdam, Copenhagen, Stockholm, Madrid, and Warsaw, has doubled in city count over the past three years.
- February 2026: GLS doubled its European out-of-home (OOH) network from 70,000 to 130,000 locations, including a Southern European locker rollout in Italy, Spain, and Portugal through a partnership with Keba. The company targets 30,000 proprietary parcel lockers by 2030 while expanding shared-carrier access points in Germany, the Czech Republic, and the Netherlands.
Europe Urban Logistics Market Report Scope
Segmentation Overview
| Transportation Services |
| Warehousing and Urban Storage Services |
| Fulfillment Services |
| Reverse Logistics Services |
| Value-Added Logistics (VAL) Services |
| Instant and Same-Day Delivery |
| Next-Day Delivery |
| Scheduled Delivery |
| Standard Delivery |
| Business-to-Business (B2B) |
| Business-to-Consumer (B2C) |
| Consumer-to-Consumer (C2C) |
| E-commerce and Retail |
| Food and Beverage |
| Healthcare and Pharmaceuticals |
| Consumer Electronics |
| Fashion and Apparel |
| Automotive Parts |
| Industrial and Manufacturing |
| Others |
| United Kingdom |
| Germany |
| France |
| Spain |
| Italy |
| Belgium |
| Netherlands |
| Poland |
| NORDICS (Denmark, Finland, Iceland, Norway, and Sweden) |
| Rest of Europe |
| By Service Type | Transportation Services |
| Warehousing and Urban Storage Services | |
| Fulfillment Services | |
| Reverse Logistics Services | |
| Value-Added Logistics (VAL) Services | |
| By Delivery Speed | Instant and Same-Day Delivery |
| Next-Day Delivery | |
| Scheduled Delivery | |
| Standard Delivery | |
| By Customer Type | Business-to-Business (B2B) |
| Business-to-Consumer (B2C) | |
| Consumer-to-Consumer (C2C) | |
| By End-Use Industry | E-commerce and Retail |
| Food and Beverage | |
| Healthcare and Pharmaceuticals | |
| Consumer Electronics | |
| Fashion and Apparel | |
| Automotive Parts | |
| Industrial and Manufacturing | |
| Others | |
| By Country | United Kingdom |
| Germany | |
| France | |
| Spain | |
| Italy | |
| Belgium | |
| Netherlands | |
| Poland | |
| NORDICS (Denmark, Finland, Iceland, Norway, and Sweden) | |
| Rest of Europe |
Key Questions Answered in the Report
What is the expected growth rate for urban logistics in Europe?
The Europe urban logistics market is forecast to grow at a 6.47% CAGR from 2026 to 2031 and reach USD 760.52 billion by 2031.
Which service is growing fastest in European urban delivery?
Reverse logistics services is forecast to expand at an 8.39% CAGR through 2031, supported by recovery and recommerce requirements.
Why are zero-emission zones important for city deliveries?
They require operators to replace or adapt fleets, and electric vans represented 78% of new registrations in Dutch ZEZ municipalities in the first half of 2025.
Which customer group is expanding fastest for parcel carriers?
C2C is forecast to grow at a 9.33% CAGR through 2031 as online resale platforms increase parcel flows.
Which country is expected to expand fastest through 2031?
Poland is forecast to grow at a 7.94% CAGR, supported by e-commerce adoption and investments in logistics infrastructure.
How are leading operators competing in European city delivery?
Leading operators are expanding locker networks, electrifying fleets, and using operational data to improve routing and local delivery performance.