Europe Global Capability Centers Market Size and Share
Market Overview
| Study Period | 2020 - 2031 |
|---|---|
| Forecast Data Period | 2026 - 2031 |
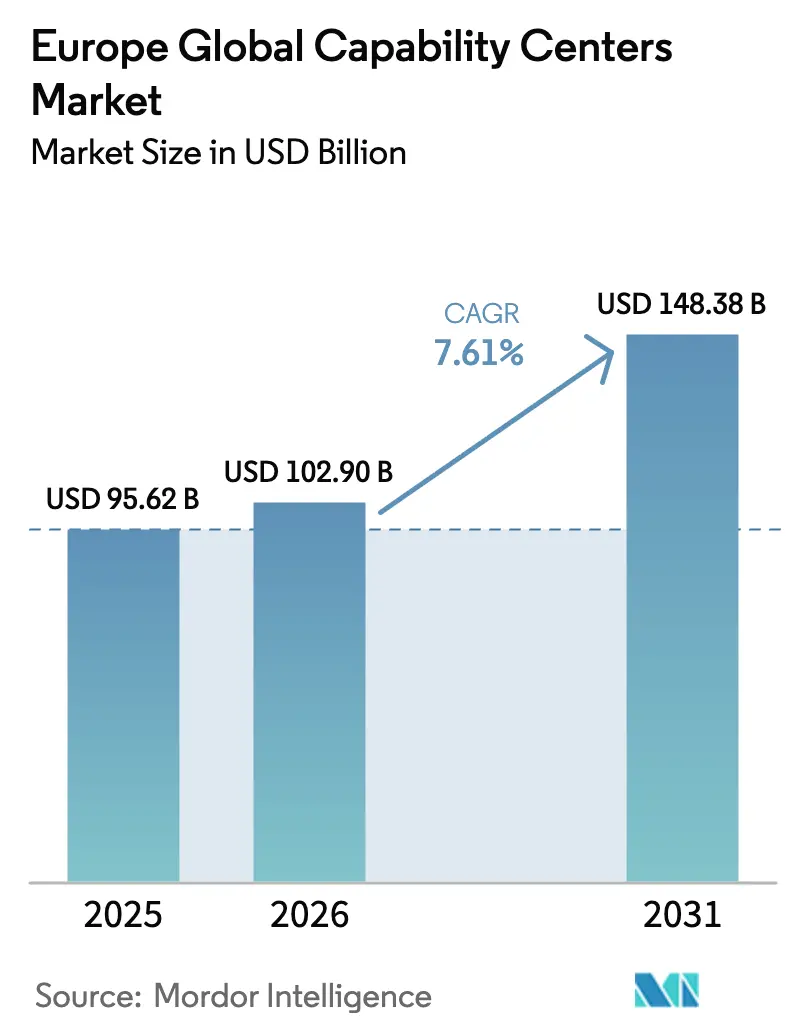
| Base Year Market Size (2025) | USD 95.62 Billion |
| Market Size (2026) | USD 102.9 Billion |
| Market Size (2031) | USD 148.38 Billion |
| Growth Rate (2026 - 2031) | 7.61% CAGR |
| Market Concentration | Medium |
Major Players *Disclaimer: Major Players sorted in no particular order Image © Mordor Intelligence. Reuse requires attribution under CC BY 4.0. | |
Europe Global Capability Centers Market Analysis by Mordor Intelligence
Europe's global capability centers market size in 2026 is estimated at USD 102.9 billion, growing from 2025 value of USD 95.62 billion with 2031 projections showing USD 148.38 billion, growing at 7.61% CAGR over 2026-2031. Nearshore digital talent strategies are driving the growth of Europe's global capability centers market, as well as stricter EU data localization rules and increased enterprise demand for cloud-native engineering capacity. The dominant Information Technology and Digital Services function contributed 54.29% of the revenue in 2024, while Knowledge Process Outsourcing expanded at the fastest rate, with a 7.87% CAGR. Large enterprises continued to account for 86.38% of total demand, while small and medium enterprises posted the strongest growth of 9.26%, as cloud adoption lowered the minimum viable scale. Geographic patterns are shifting: the United Kingdom held 17.89% of % European global capability centers market share in 2024, but Poland is closing the gap on an 8.25% trajectory supported by attractive fiscal incentives. Industry-wise, Banking, Financial Services, and Insurance generated 34.57% demand in 2024, whereas Healthcare and Life Sciences led future velocity at 8.19% CAGR.
Key Report Takeaways
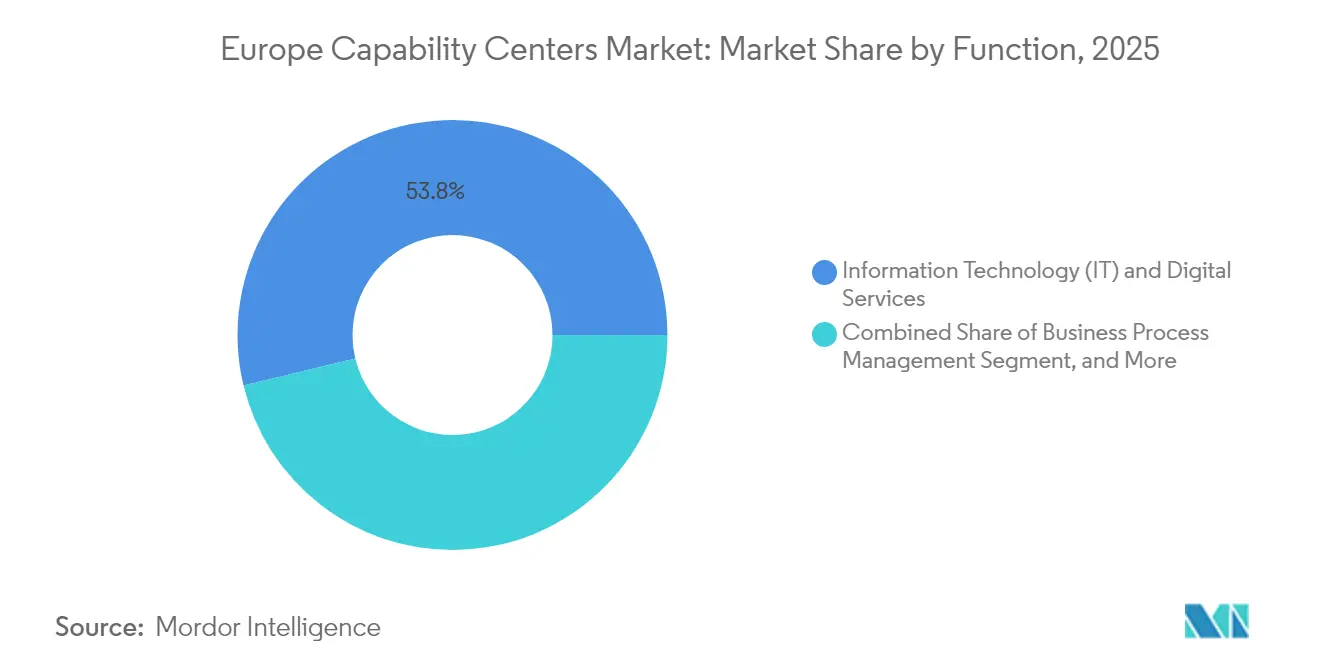
- By function, Information Technology and Digital Services captured a 53.78% share of the global Europe capability centers market in 2025; Knowledge Process Outsourcing is forecast to expand at a 7.84% CAGR through 2031.
- By engagement model, captive centers held 57.05% of the Europe global capability centers market size in 2025; hybrid build-operate-transfer models are advancing at an 8.48% CAGR through 2031.
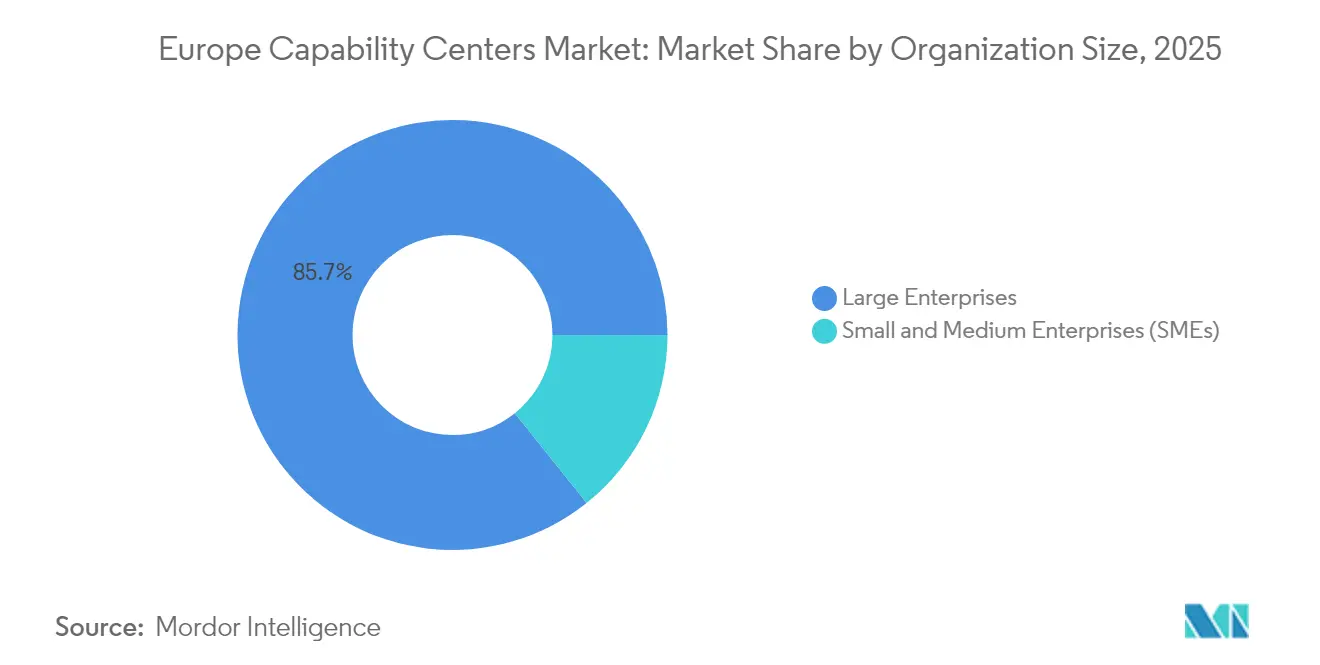
- By organization size, large enterprises accounted for 85.72% participation in 2025, while small and medium enterprises are projected to grow at a 9.07% CAGR.
- By industry vertical, Banking, Financial Services, and Insurance led with a 34.10% revenue share in 2025; Healthcare and Life Sciences posted the highest 8.05% CAGR from 2025 to 2031.
- By country, the United Kingdom held a 17.52% market share in 2025, whereas Poland is the fastest-growing market, with an 8.12% CAGR.
Note: Market size and forecast figures in this report are generated using Mordor Intelligence’s proprietary estimation framework, updated with the latest available data and insights as of 2026.
Europe Global Capability Centers Market Trends and Insights
Drivers Impact Analysis*
| Driver | (~) % Impact on CAGR Forecast | Geographic Relevance | Impact Timeline |
|---|---|---|---|
| Rising demand for nearshore digital talent | +2.1% | Western Europe and Nordic markets | Medium term (2-4 years) |
| Strong government incentives and tax subsidies | +1.8% | Central and Eastern Europe, France, Germany | Short term (≤ 2 years) |
| Accelerating enterprise digital transformation investments | +2.3% | United Kingdom, Germany, Netherlands | Medium term (2-4 years) |
| Cost arbitrage versus Western European headquarters | +1.2% | Eastern Europe, Portugal, Ireland | Long term (≥ 4 years) |
| Increase in multi-country hybrid build-operate-transfer structures | +0.9% | EU-wide | Medium term (2-4 years) |
| Availability of green energy infrastructure for ESG goals | +0.7% | Nordic countries, Germany | Long term (≥ 4 years) |
| Source: Mordor Intelligence | |||
Rising Demand for Nearshore Digital Talent in Europe
European employers are pivoting to talent pools inside the single market as tighter data-sovereignty rules and shrinking labor availability erode traditional offshore advantages. Seventy-seven percent of firms surveyed by the European Commission found that new hires lacked the necessary digital skills, while the overall workforce is projected to contract by 2 million each year until 2040. Nearshore capability centers mitigate this gap by combining cultural alignment, overlapping work hours, and secure data jurisdictions. IoT platform engineering commands a 45% hiring premium, and AI roles grow 27%. Therefore, enterprises anchor high-complexity projects within the European global capability centers market to secure scarce expertise.[1]Mercer, “The Evolving Workforce,” mercer.com
Strong Government Incentives and Tax Subsidies for Global Capability Centers
Aggressive R&D tax credits, IP box regimes, and employment-based grants can lower effective operating costs by up to 40% in countries such as Poland, Hungary, and Portugal. These savings amplify Europe's global capability centers market appeal by offsetting wage inflation. Poland’s 200% super-deduction for qualifying R&D spend and fast-track depreciation schedules have catalyzed several 2025 investment announcements. As OECD Pillar Two rules curb pure tax-rate competition, governments are pivoting toward productivity-linked rebates, supporting hybrid build-operate-transfer launches that transition to full captives once knowledge transfer is complete.
Accelerating Enterprise Digital Transformation Investments
AI, 5G, and multi-cloud orchestration strategies underpin a fresh wave of enterprise transformation budgets that funnel work into capability centers specializing in data science, model governance, and process robotics. One-third of national digital plans across the EU-27 explicitly finance AI commercialization corridors. Enterprises establish global capability centers in Europe to standardize DevSecOps, manage cross-border data portability under the EU Data Act, and train staff on zero-trust architectures. Vertical AI adoption across automotive, advanced manufacturing, and healthcare stimulates demand for domain-specific labs embedded in capability centers.
Cost Arbitrage versus Western European Headquarters
Even after considering regional wage inflation, blended labor and facility expenses in Central and Eastern Europe remain 30-50% below the benchmarks of London, Frankfurt, or Paris. Savings widen when utility prices and ESG retrofit costs are considered, driving workload migration to energy-efficient campuses in Poland, Romania, and Portugal. Multilingual talent densities further reinforce economic logic, allowing finance-grade support or Nordic language service desks at favorable rates. The consequent expansion of Europe's global capability centers market footprints in lower-cost EU states sustains long-run competitiveness for multinationals.
Restraints Impact Analysis*
| Restraint | (~) % Impact on CAGR Forecast | Geographic Relevance | Impact Timeline |
|---|---|---|---|
| Intensifying talent competition and wage inflation | -1.4% | Germany, the Netherlands, Nordic countries | Short term (≤ 2 years) |
| Regulatory complexity around EU data sovereignty | -0.8% | All EU jurisdictions | Medium term (2-4 years) |
| Rising facility costs due to ESG-compliant retrofits | -0.6% | Western Europe metropolitan areas | Long term (≥ 4 years) |
| Limited scalability of niche language skills | -0.4% | Specialized micro-markets | Medium term (2-4 years) |
| Source: Mordor Intelligence | |||
Intensifying Talent Competition and Wage Inflation
Sixty-two-point-eight percent of EU employers struggled to recruit ICT specialists in 2024, forcing double-digit wage uplifts that dilute classic arbitrage savings.[2]European Labor Authority, “Three Ways for EU Companies to Grow the ICT Workforce,” eures.europa.eu Attrition in AI and ML roles averaged 18% in 2025, significantly higher than enterprise norms, while total reward packages have expanded to include remote work flexibility and continuous learning allowances. Although reskilling partnerships with universities exist, their talent pipelines take several years to mature, keeping near-term labor costs elevated across the European global capability centers market.
Regulatory Complexity Around EU Data Sovereignty
The EU Data Act prohibits certain non-personal data transfers and mandates cloud-switching portability by 2025, imposing additional encryption, audit, and contractual requirements on data centers.[3]Lexology, “EU Data Act Now Formally Adopted,” lexology.com Divergent national implementations of shared directives create inconsistent compliance checkpoints, which slow multi-country rollouts and lengthen the time-to-value for new centers. Legal-tech automation and local-cloud colocation mitigate risk; however, the added expense depresses the effective market margins of global Europe capability centers through mid-decade.
*Our forecasts treat driver/restraint impacts as directional, not additive. The impact forecasts reflect baseline growth, mix effects, and variable interactions.
Segment Analysis
By Function / Capability: Digital Services Drive Innovation Velocity
Information Technology and Digital Services contributed 53.78 of % Europe global capability centers market revenue in 2025, underscoring its primacy in orchestrating cloud-native workloads. The segment combines software engineering, platform operations, and cybersecurity governance within centers of excellence that align with EU data protection codes. Continuous-delivery pipelines, container orchestration, and zero-trust frameworks form the technical core, while bilingual Scrum teams enhance client proximity.
Knowledge Process Outsourcing, although smaller, is the fastest-growing line at a 7.84% CAGR to 2031. Complex regulatory reporting, pharmacovigilance, and financial risk analytics drive this demand, favoring centers that couple domain expertise with advanced analytics. Europe's global capability centers market size attributed to KPO is expected to exceed USD 18.06 billion by 2031, reflecting the compounding of compliance workloads and the increasing demand for AI-enabled research assistance.


By Engagement Model: Hybrid Structures Gain Strategic Traction
Captives held 57.05% volume in 2025 as firms preserved IP ownership and governance clarity. Indigenous HR teams and in-house legal counsels ensure direct oversight of sensitive datasets, particularly under GDPR Article 28 processor obligations. Mature captives add advanced automation in finance, procurement, and human capital analytics to raise internal service levels.
Hybrid build-operate-transfer (BOT) constructs grow at an annual rate of 8.48%, launched by firms that lack boot-up expertise yet value eventual ownership. Providers design and scale centers for 24-36 months before equity ownership is transferred to the client. Europe's global capability centers' market share gains for hybrids outpace those of legacy outsourced models, thanks to flexible risk-transfer mechanisms and faster talent acquisition cycles.
By Organization Size: SMEs Accelerate Digital Adoption
Large enterprises accounted for 85.72% of spending in 2025, cementing their top-down influence on ecosystem standards and vendor selection rigor. Their centers emphasize complex multi-jurisdiction compliance and proprietary platform builds.
SMEs, however, record 9.07% CAGR as SaaS and low-code stacks slash entry thresholds. Off-the-shelf cloud accelerators bundle service desk, DevOps, and data governance modules, enabling sub-$5 million annual budgets to sustain viable hubs. Europe's global capability centers and industry peers report that SMEs favor multi-tenant facilities in Poland and Portugal, where campus amenities are shared, reducing overhead.
By Industry Vertical: Healthcare Transformation Accelerates Growth
Banking, Financial Services, and Insurance led 2025 revenue at 34.10% due to stringent audit trails and real-time fraud analytics. Centers here integrate payment system hardening, Basel IV risk analytics, and digital asset custody solutions.
The healthcare and life sciences sector is expected to expand at an annual rate of 8.05%, driven by the European Health Data Space, which mandates secure and interoperable processing of patient records. Specialist centers in Ireland and the Netherlands focus on regulatory-grade clinical data annotation, medical device software validation, and pharmacogenomic AI pipelines. Europe's global capability centers market size dedicated to health applications is forecast to top USD 12.63 billion by 2031 as cross-border e-prescription exchange scales.
Geography Analysis
The United Kingdom retained 17.52% of Europe's global capability centers market revenue in 2025, leveraging deep financial services expertise, English-language advantage, and GMT time-zone alignment. Post-Brexit data-transfer frictions, however, encourage dual-hub architectures: U.K. captives now pair with EU-domiciled affiliates to serve continental clients without the complexity of standard contractual clauses. [4]European Parliament, “Protection of Strategic and Sensitive European Data,” europarl.europa.eu Investment policy continuity, robust cyber-skilling programs, and London’s access to capital continue to underpin its leadership, despite higher wage costs.
Poland is the breakout performer, compounding at 8.12% through 2031, amid EUR-denominated tax credits that slash R&D expenses by two-thirds for qualifying projects. Warsaw and Krakow agglomerations host multilingual graduates, 5G fiber backbones, and an abundant supply of Class-A offices. Corporate approvals also favor Poland’s EU single-market status, avoiding the headaches of origin rules certification that afflict third-country hubs. These factors cement Poland as the prime destination for green-field centers within the European global capability centers market.
Germany and France exhibit moderate growth, anchored in their domestic industrial bases and access to renewable energy sources. German clusters in Munich and Berlin support automotive software and manufacturing execution-system analytics. French sites emphasize aerospace engineering and luxury goods IT, supported by national AI ethics frameworks. The rest of Europe, encompassing the Nordic states and Iberia, offers niche advantages: Sweden and Finland supply green energy data centers, while Portugal markets cost-efficient, multilingual CX labs. Collectively, these regions deliver diversification for firms, balancing risk, cost, and ESG metrics.
Competitive Landscape
The European global capability centers market competition is moderate, with top players combining regulatory expertise, hybrid-cloud engineering, and AI automation to widen service margins. Institutional incumbents, such as JPMorgan Chase, HSBC, and Citi, operate multi-thousand-seat captives that handle risk analytics and digital payments orchestration. Their early investments in GDPR and in-house legal-tech stacks deter new entrants in high-compliance verticals.
Technology majors, notably Microsoft, IBM, and Amazon Web Services, layer hyperscale infrastructure with professional services pods that architect cloud landing zones and provide data sovereignty guardianship. For example, AWS’s USD 15.7 billion outlay for 2025-2033 fortifies regional zones in Germany and Spain, unlocking AI workload residency options for clients. These strategies reinforce the European global capability centers market standing of cloud providers as partners rather than mere landlords.
Boutique disruptors carve niches in quantum-algorithm design, ESG compliance analytics, and multilingual AI model training. They win deals by offering 90-day proofs of concept and flexible terms for IP ownership. Meanwhile, European telecom equipment leaders such as Nokia and Ericsson are embedding 5G and private-network R&D in their Nordic labs to expedite the development of edge-computing use cases. Cross-licensing made easier by the forthcoming Unitary Patent system further lowers entry hurdles for R&D-intensive captives.
Europe Global Capability Centers Industry Leaders
IBM Corporation
Microsoft Corporation
Google LLC
ABB Ltd.
Siemens AG
- *Disclaimer: Major Players sorted in no particular order

Recent Industry Developments
- September 2025: Amazon Web Services announced USD 15.7 billion for cloud-infrastructure growth across Germany and Spain through 2033 to satisfy AI workload residency rules.
- September 2025: Computacenter invested EUR 45 million (USD 48 million) in AI-enhanced managed services platforms across its European estate.
- August 2025: Microsoft unveiled a USD 2.1 billion AI and cloud hub in Italy, including programs to create 30,000 digital jobs by 2030.
- August 2025: Ericsson launched a 5G network-optimization hub in Stockholm employing 200 engineers.


Europe Global Capability Centers Market Report Scope
The scope of the global capability center study for the market segmentation by the Function/Capability for (i) Information Technology (IT) and Digital Services segment is limited to Software Development, Cloud and Infrastructure Management, Cybersecurity, Data Analytics and AI/ML; (ii) Engineering / ER&D segment is limited to Product Design and Testing, Embedded Systems, Digital Twin / Simulation; (iii) Business Process Management (BPM) segment is limited to Finance and Accounting, HR, Payroll and Talent Management, Procurement, Customer Service; and (iv)Knowledge Process Outsourcing (KPO) segment is limited to Market Research and Insights, Risk and Compliance, Legal and Regulatory Support, Strategy and Consulting Support. Similarly, for segmentation by the Engagement Model, scope for (i) Hybrid Build-Operate-Transfer (BOT) is limited to Joint Venture / Strategic Partnership and Virtual Captive Model. The rest of the segment scope is as specified for the listed segment.
| Information Technology (IT) and Digital Services |
| Engineering / ER&D |
| Business Process Management (BPM) |
| Knowledge Process Outsourcing (KPO) |
| Captive (Self-Build) / In-house |
| Build-Operate-Transfer (BOT) |
| Hybrid Build-Operate-Transfer (BOT) |
| Large Enterprises |
| Small and Medium Enterprises (SMEs) |
| Banking, Financial Services, and Insurance (BFSI) |
| Telecom and IT |
| Healthcare and Life Sciences |
| Manufacturing, Automotive and Industrial |
| Retail and Consumer Goods |
| Other Industry Verticals |
| United Kingdom |
| Germany |
| France |
| Poland |
| Central and Eastern Europe |
| Rest of Europe |
| By Function / Capability | Information Technology (IT) and Digital Services |
| Engineering / ER&D | |
| Business Process Management (BPM) | |
| Knowledge Process Outsourcing (KPO) | |
| By Engagement Model | Captive (Self-Build) / In-house |
| Build-Operate-Transfer (BOT) | |
| Hybrid Build-Operate-Transfer (BOT) | |
| By Organization Size | Large Enterprises |
| Small and Medium Enterprises (SMEs) | |
| By Industry Vertical | Banking, Financial Services, and Insurance (BFSI) |
| Telecom and IT | |
| Healthcare and Life Sciences | |
| Manufacturing, Automotive and Industrial | |
| Retail and Consumer Goods | |
| Other Industry Verticals | |
| By Country | United Kingdom |
| Germany | |
| France | |
| Poland | |
| Central and Eastern Europe | |
| Rest of Europe |


Key Questions Answered in the Report
What is the projected value of Europe global capability centers by 2031?
The Europe global capability centers market size is forecast to reach USD 148.38 billion by 2031.
What is the market size in 2026?
The Europe global capability centers market size is USD 102.9 billion in 2026.
Which country is growing fastest in new capability centers?
Poland is expected to expand at an 8.12% CAGR through 2031, driven by generous R&D tax incentives and competitive labor costs.
Which industry vertical shows the strongest future demand?
The healthcare and Life Sciences Sector is expected to grow at an 8.05% CAGR as companies adapt to the European Health Data Space regulations.
How are hybrid build-operate-transfer models performing?
Hybrid build-operate-transfer models are registering an 8.48% CAGR, the highest among engagement types, balancing flexibility with long-term control.
What is the main talent-related challenge facing capability centers?
Intense competition for AI, cybersecurity, and IoT expertise is pushing wage growth and raising overall operating costs across Europe.
Why are companies choosing nearshore centers instead of traditional offshore hubs?
Nearshore centers offer regulatory compliance with EU data sovereignty laws, cultural and time zone alignment, and faster access to specialized digital skills.
Page last updated on:


