
Market Overview
| Study Period | 2021 - 2031 |
|---|---|
| Market Size (2026) | USD 6.77 Billion |
| Market Size (2031) | USD 9.67 Billion |
| Growth Rate (2026 - 2031) | 7.42 % |
| Fastest Growing Market | Middle East |
| Largest Market | Europe |
| Market Concentration | Medium |
Major Players *Disclaimer: Major Players sorted in no particular order Image © Mordor Intelligence. Reuse requires attribution under CC BY 4.0. | |
Eubiotics Market Analysis by Mordor Intelligence
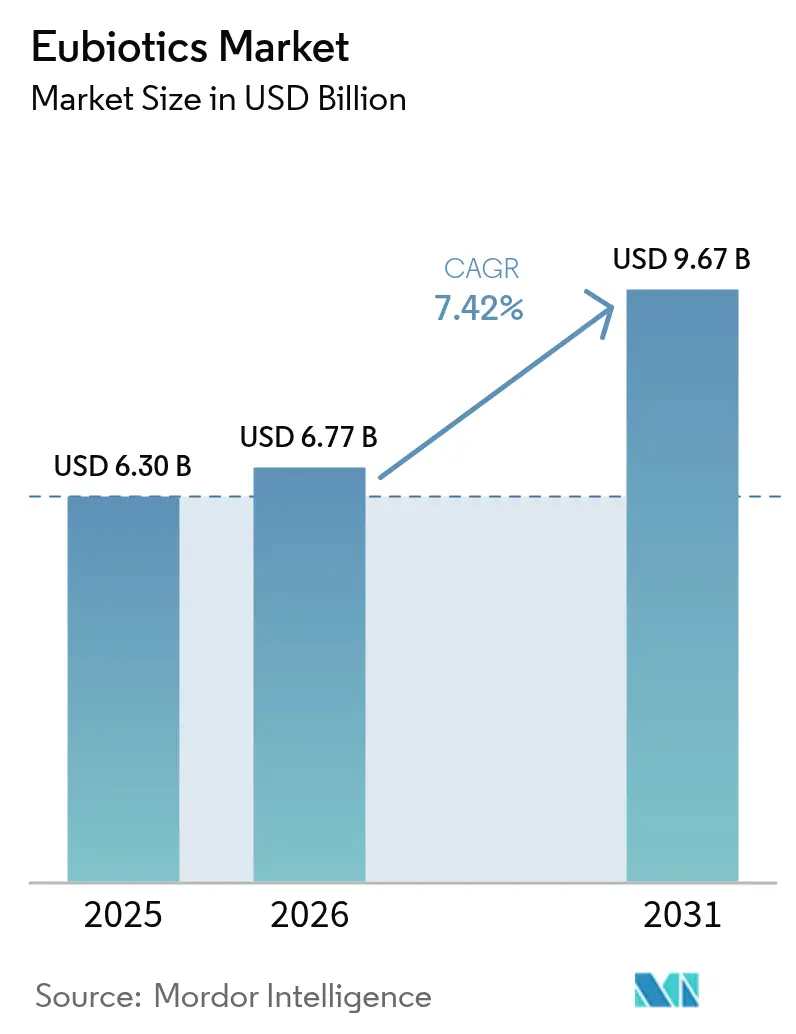
The Eubiotics Market size was valued at USD 6.30 billion in 2025 and estimated to grow from USD 6.77 billion in 2026 to reach USD 9.67 billion by 2031, at a CAGR of 7.42% during the forecast period (2026-2031). Rising restrictions on antibiotic growth promoters, steady gains in aquaculture output, and precision nutrition technologies are accelerating the adoption of probiotics, organic acids, prebiotics, and phytogenic additives across all livestock segments. Large retailers that mandate antibiotic-free supply chains reinforce demand momentum, while digital livestock systems show measurable feed-cost savings and lower nitrogen excretion when coupled with targeted eubiotic programs. Supply-chain resilience and circular-economy sourcing strengthen competitive positioning, and regulatory convergence in North America and Asia-Pacific reduces approval complexity for globally harmonized product launches. Moderate market concentration leaves room for regional specialists who can tailor formulations to local raw-material bases and environmental pressures. Across all trends, the eubiotics market continues to pivot from broad-spectrum antibiotics toward sustainable gut-health solutions that deliver quantifiable farm-level returns.
Key Report Takeaways
- By type, probiotics led with 41.10% of the eubiotics market share in 2025; essential oils are forecast to expand at a 9.64% CAGR through 2031.
- By animal type, poultry held 34.10% of the eubiotics market share in 2025, while aquaculture is projected to grow at an 8.44% CAGR by 2031.
- By function, gut-health and performance applications accounted for 54.40% of 2025 revenue, and feed-efficiency improvement is expected to advance at an 8.33% CAGR through 2031.
- By form, dry powders led with 62.20% of 2025 revenue; liquid formulations register the strongest 8.45% CAGR over the forecast period.
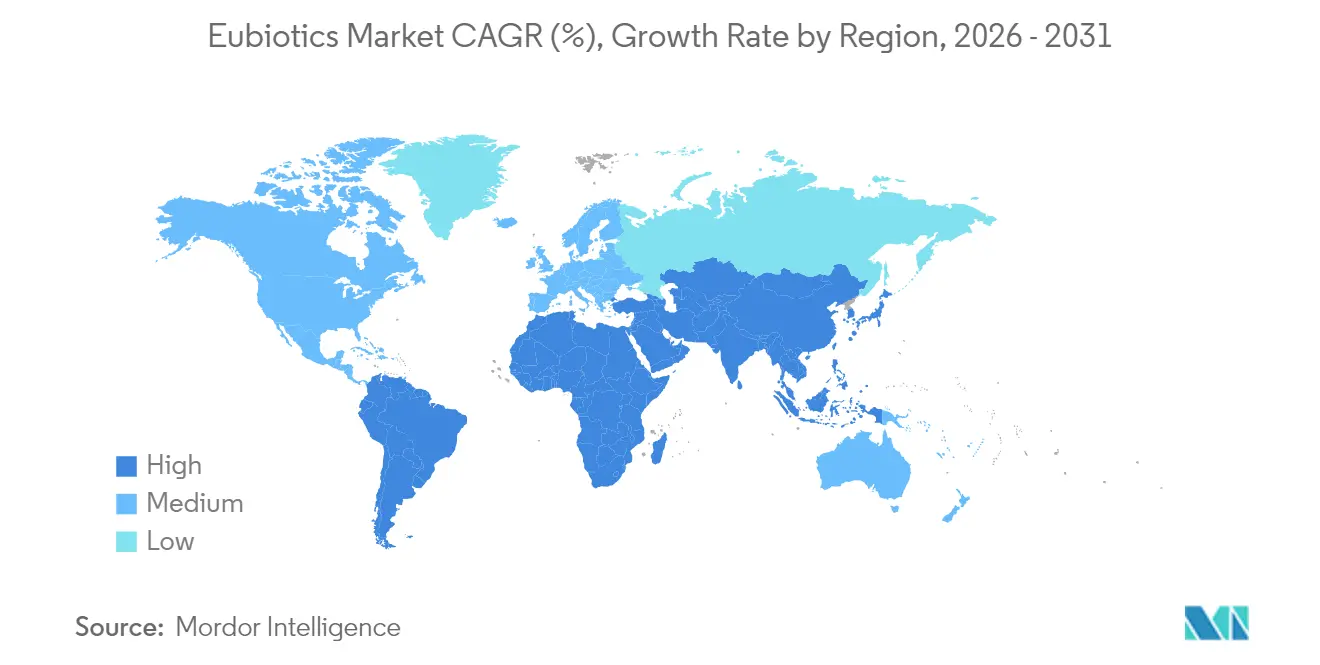
- By geography, Europe accounted for 34.40% of the eubiotics market size in 2025; the Middle East is projected to advance at a 7.78% CAGR over the forecast period.
- The top five suppliers controlled 43.8% of 2024 revenue, with BASF SE leading at 11.5% market share.
Note: Market size and forecast figures in this report are generated using Mordor Intelligence’s proprietary estimation framework, updated with the latest available data and insights as of 2026.
Market Trends and Insights
Drivers Impact Analysis of Eubiotics Market*
| Driver | (~) % Impact on CAGR Forecast | Geographic Relevance | Impact Timeline |
|---|---|---|---|
| Regulatory restrictions on antibiotic growth promoters | +2.1% | Global, led by EU and North America | Medium term (2-4 years) |
| Rising consumer demand for antibiotic-free animal products | +1.8% | North America, Europe, Asia-Pacific urban centers | Long term (≥ 4 years) |
| Expansion of aquaculture production globally | +1.4% | Asia-Pacific, Middle East, South America | Long term (≥ 4 years) |
| Technological advances in precision nutrition and delivery systems | +1.2% | Global, concentrated in developed markets | Medium term (2-4 years) |
| Growing awareness of gut-health importance in animal performance | +0.9% | Global, faster adoption in intensive farming regions | Medium term (2-4 years) |
| Increasing focus on sustainable and circular-economy practices | +0.7% | Europe, North America, progressive Asian markets | Long term (≥ 4 years) |
| Source: Mordor Intelligence | |||
Regulatory restrictions on antibiotic growth promoters
The formal phase-out of antibiotic growth promoters across major livestock regions has set an irreversible shift toward eubiotics. Regulation (EC) No 1831/2003 created a rigorous safety dossier process that many other jurisdictions now mirror, resulting in a clearer, more standardized approval path that rewards suppliers with robust clinical data packages.[1]European Food Safety Authority, “Guidance on the Assessment of the Safety of Feed Additives,” efsa.europa.eu As the U.S. FDA’s Innovative FEED Act introduces similar streamlining, multinational producers can coordinate dossier submissions, shorten time-to-market, and deploy harmonized formulations that meet common safety thresholds.
Rising consumer demand for antibiotic-free animal products
Demand for antibiotic-free meat and dairy has moved from niche to mainstream. Large grocery chains impose supplier policies that eliminate antibiotic use, pushing producers toward eubiotics despite higher additive costs. Premium shelf prices offset these costs and create a compelling economic case, particularly in urban Europe, North America, and advanced Asian economies where consumers link antibiotic stewardship to health and food safety.[2]U.S. Food and Drug Administration, “Innovative FEED Act Summary,” fda.gov
Expansion of aquaculture production globally
The rapid expansion of aquaculture is a major driver of eubiotic adoption, as fish and shrimp farms increasingly seek sustainable alternatives to antibiotics for disease prevention and gut health management. Global aquaculture capacity is rising sharply, with Gulf projects such as the Cargill-NEOM venture targeting 600,000 metric-ton output by 2030. Water-stable probiotic and phytogenic formulations reduce pathogen load and improve feed conversion in recirculating aquaculture systems, aligning with environmental discharge regulations and investor sustainability mandates.
Technological advances in precision nutrition and delivery systems
Sensors embedded in feeders adjust eubiotic dosage in real-time, aligning probiotic and phytogenic inclusion rates with daily animal growth curves for higher feed-conversion efficiency. Precision micro-encapsulation protects heat-sensitive essential oils and probiotic spores, ensuring greater than or equal to 90% survival through pelleting temperatures and gastric transit. On-farm trials report 25% lower crude protein intake and 40% less nitrogen excretion when precision nutrition platforms deliver targeted eubiotic blends, supporting stricter environmental-compliance limits. Species-specific algorithms in recirculating aquaculture systems dose water-stable probiotics that cut Vibrio counts by 30% in shrimp grow-out ponds, improving survival rates and reducing antibiotic use.
Restraints Impact Analysis of Eubiotics Market*
| Restraint | (~) % Impact on CAGR Forecast | Geographic Relevance | Impact Timeline |
|---|---|---|---|
| High costs and complex regulatory approval processes | -1.5% | Global, particularly stringent in EU and North America | Medium term (2-4 years) |
| Supply-chain volatility and raw-material sourcing challenges | -1.1% | Global, acute in developing markets | Short term (≤ 2 years) |
| Limited awareness and technical expertise in developing markets | -0.8% | Africa, parts of Asia-Pacific, South America | Medium term (2-4 years) |
| Inconsistent efficacy results and lack of standardization | -0.6% | Global, more pronounced in emerging applications | Short term (≤ 2 years) |
| Source: Mordor Intelligence | |||
High costs and complex regulatory approval processes
High costs and complex regulatory approval processes slow product launches and raise entry barriers for smaller suppliers. Submitting a full EFSA safety dossier can cost several million EUR and extend timelines to 3–4 years, tying up capital that could otherwise fund Research and Development. Diverging post-Brexit rules mean companies must now prepare separate submissions for the EU and the UK, duplicating documentation and laboratory studies. These burdens tilt competitive advantage toward multinationals with dedicated regulatory teams and can discourage investment in novel mechanisms of action that lack a clear pathway to fast approval.
Supply-chain volatility and raw-material sourcing challenges
Supply-chain volatility and raw-material sourcing challenges create unpredictable input costs that erode producer margins. Climate-driven swings in Peru’s anchovy fishery, a key omega-3 source, triggered a 35% price spike after the 2023 El Nino shutdown and exposed the fragility of marine-based ingredient supply lines. Logistical disruptions—ranging from container shortages to Red Sea routing detours—add further uncertainty and delay the arrival of critical botanical oils and organic-acid intermediates. Producers increasingly hedge risk through vertical integration, local cultivation of herb crops, and partnerships with single-cell protein ventures that decouple formulations from volatile commodity streams.
*Our forecasts treat driver/restraint impacts as directional, not additive. The impact forecasts reflect baseline growth, mix effects, and variable interactions.
Eubiotics Market Segment Analysis
By Type:
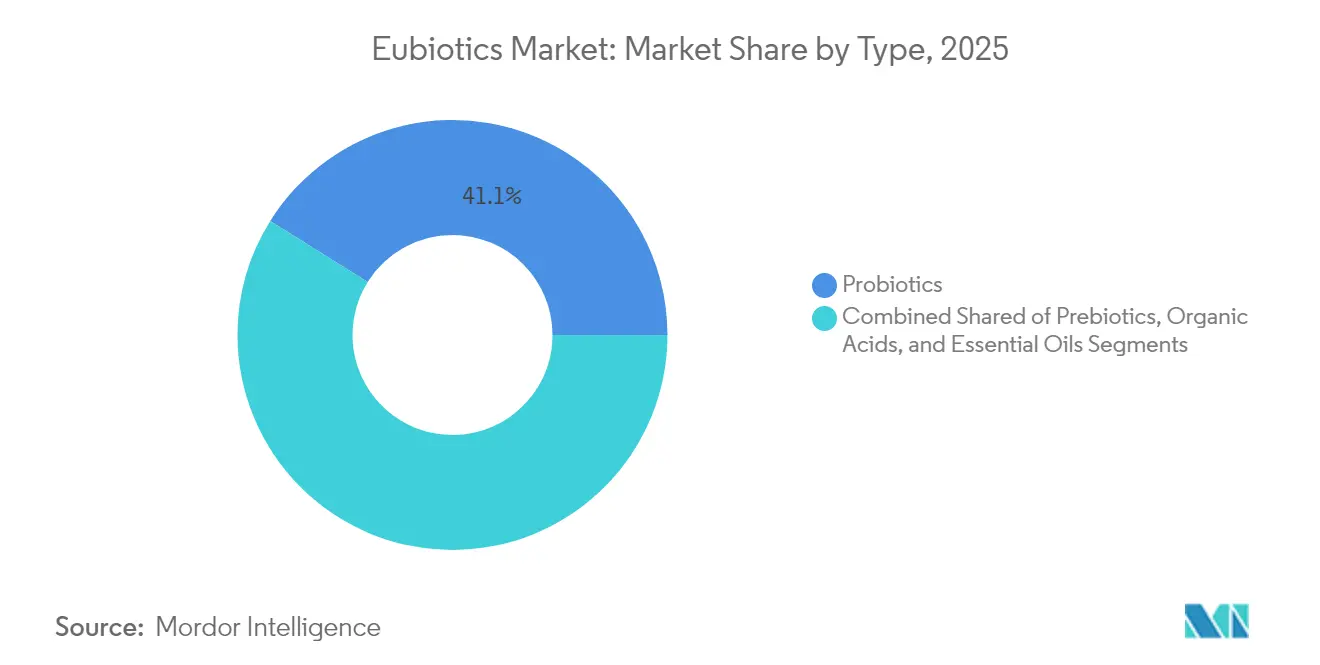
Probiotics Lead While Essential Oils AccelerateProbiotics held a 41.10% 2025 revenue share, underpinning the largest slice of the eubiotics market. Their dominance stems from extensive clinical validation, reliable performance across climates, and accommodating regulatory precedents that expedite approvals. The segment’s Bacillus spores tolerate pelleting temperatures, ensuring delivery past the proventriculus and into the ileum, where competitive exclusion exerts its effect. Synbiotic formulations that blend probiotics with fructooligosaccharide prebiotics show feed-conversion improvements of 3-4%, validating complementary mechanisms.
Essential oils record the fastest 9.64% CAGR to 2031. Consumer preference for plant-based antimicrobials and the compounds’ multilayered actions on gut microbes drive uptake. Micro-encapsulation of thymol, carvacrol, and cinnamaldehyde stabilizes volatile compounds, and inclusion rates as low as 100 ppm deliver measurable pathogen suppression. Organic acids and prebiotics retain niche roles in acidification and substrate provisioning, while multi-modal blends aim to capture synergistic benefits. Collective progress in formulation science cements the eubiotics market as the central platform for gut-health innovation.



By Animal Type:
Poultry Dominance Challenged by Aquaculture GrowthPoultry contributed 34.10% of 2025 revenue, reflecting decades of antibiotic-alternative programs in broilers and layers. Inclusion rates average 500 g per metric ton of feed, and cumulative lifetime feed-conversion gains deliver strong cost-benefit ratios. Aquaculture’s 8.44% forecast CAGR shifts relative growth toward marine and freshwater species. Shrimp, tilapia, and hybrid grouper trials indicate pathogen load reductions exceeding 30% when precise water-stable probiotics are dosed through automated feeders.
Swine operations integrate multi-strain probiotics post-weaning to curb enterotoxigenic Escherichia coli. Ruminant adoption lags due to complex rumen dynamics, yet propionibacterium blends that modulate volatile fatty acid ratios gain traction as methane-reduction tools. Companion-animal formulations segment adds a premium layer where pet-food marketers leverage the humanization trend to justify higher price points. Collectively, animal-specific optimization widens the eubiotics market size while allowing specialty suppliers to capture margin through proprietary strains.
By Function:
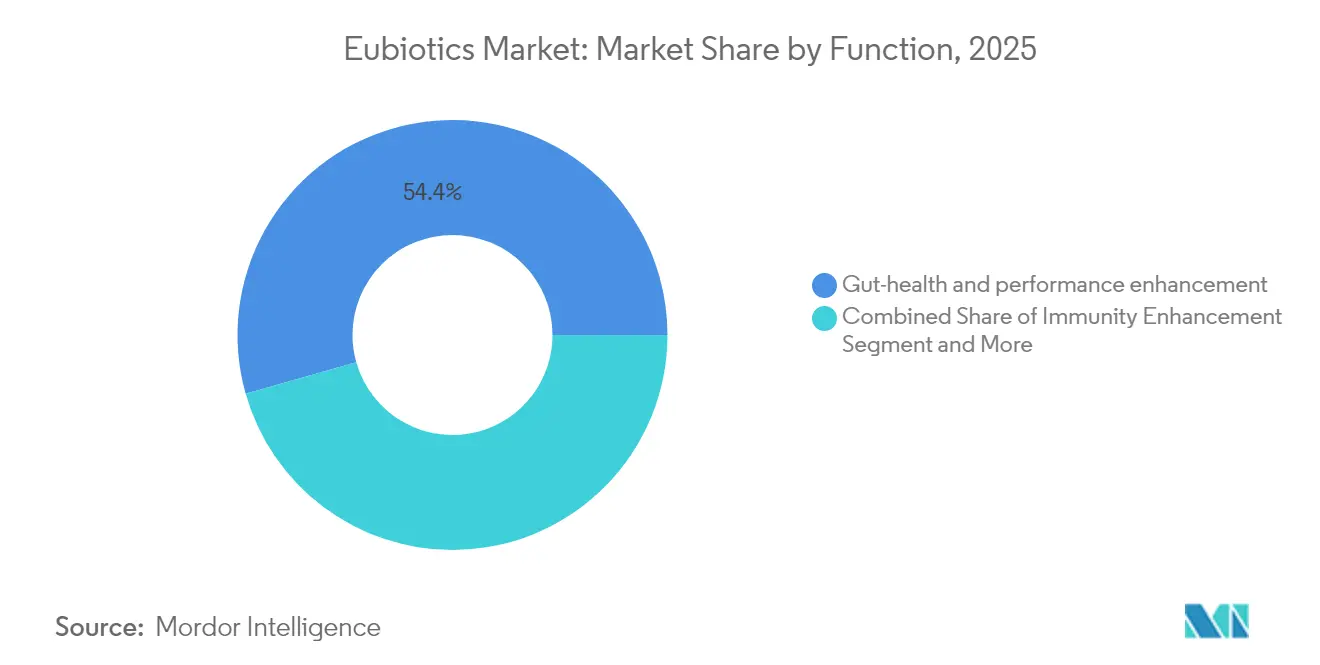
Performance Applications Drive Market EvolutionGut-health and performance applications represented 54.40% of 2025 revenue, underscoring the central role of digestive integrity in animal productivity. These products enhance villi height, improve nutrient absorption, and modulate inflammatory responses, delivering consistent weight-gain benefits under a range of farm conditions. Disease-prevention functions, while smaller in revenue share, hold regulatory importance in regions that cap antibiotic residue levels in meat exports. Feed-efficiency improvement posts an 8.33% CAGR, making it the fastest functional driver within the eubiotics market. Producers quantify feed-conversion improvements through daily-gain metrics, enabling direct cost-benefit validation for premium inclusions.
Immune-system enhancement gains prominence as veterinary teams recognize the gut–immune axis; specific yeast-cell-wall derivatives elevate immunoglobulin A levels in broilers. Stress-mitigation functions target stocking density and thermal stress challenges, particularly in tropical poultry houses where heat waves compromise gut barrier integrity. Integration of precision-feeding algorithms introduces dynamic dosing, ensuring functional additives support performance exactly when animals experience metabolic peaks. Collectively, these function-level trends reinforce the eubiotics market’s pivot from basic health insurance to production-economics optimization.
By Form:
Liquid Applications Challenge Powder DominanceDry powders maintained 62.20% revenue in 2025, driven by long shelf life, low logistics cost, and compatibility with existing feed-mill augers. The eubiotics market nonetheless sees liquid formulations rising at an 8.45% CAGR, supported by stabilization chemistries that prevent microbial spoilage and sedimentation. Liquids are dosed accurately through automated spraying systems, reducing inclusion variability that can erode efficacy. Their water-soluble nature benefits nursery swine and calf milk replacers, where uniform dispersion is critical.
Encapsulated granules occupy a premium niche because lipid coatings trigger controlled release only after the gastric barrier, ensuring active ingredients reach the ileum or cecum. Paste and gel formulations cater to aquaculture and companion-animal segments that require water stability or palatability. Microencapsulation now blends dry-form stability with liquid-form bioavailability, offering hybrid solutions that straddle both benefits. Ultimately, form-factor innovation continues to differentiate suppliers and expands the eubiotics market by addressing specific operational constraints across livestock systems.
Geography Analysis
Europe and United Kingdom Eubiotics Market
Europe’s 34.40% revenue share in 2025 stems from stringent feed-additive rules, high producer awareness, and established distribution infrastructure. Product developers benefit from proximity to fermentation inputs, veterinary universities, and contract research labs that speed proprietary-strain screening. The EU Organic Action Plan triggers incremental demand for certified eubiotics that complement organic livestock diets while addressing vitamin and amino-acid gaps. Regulatory divergence following Brexit introduces dual-registration costs but also niche opportunities for fast-track approvals under UK guidelines.
GCC Eubiotics Market
The Middle East delivers the fastest 7.78% CAGR, anchored by aquaculture megaprojects under Saudi Vision 2030. Gulf Cooperation Council countries invest in desert-climate aquafeed facilities that marry single-cell protein and eubiotics to close domestic protein gaps. Government feed-subsidy schemes reward local producers that integrate sustainable gut health solutions to minimize antibiotic residues and align with halal and green-label standards.
APAC and South America Eubiotics Market
Asia-Pacific shows heterogeneous patterns. Advanced markets like Japan and South Korea emphasize value-added formulations and traceability, while China and India focus on cost-effective blends due to scale. Regulatory clearance remains slower in China, yet local production clusters in Shandong and Fujian provinces shorten supply chains. South American producers leverage abundant botanical raw materials to develop essential oil blends domestically, providing cost advantages in export-oriented beef and poultry sectors.

Regulatory Landscape
Eubiotics suppliers operate under feed-additive regimes that increasingly require strain-level identity, safety, and efficacy evidence before market access. In the European Union, Regulation (EC) No 1831/2003 anchors a centralized authorization system built on EFSA scientific assessment and European Commission implementing regulations. Recent authorizations and renewals in 2025-2026 show the cadence of updates affecting probiotic and microbial additive portfolios, including Commission Implementing Regulation (EU) 2025/2576 (effective 8 January 2026) authorizing a Bacillus subtilis and Bacillus amyloliquefaciens preparation for poultry, and Commission Implementing Regulation (EU) 2026/1146 covering renewals for specific Lactiplantibacillus plantarum and Lentilactobacillus buchneri preparations.
Outside Europe, the United States relies on the FDA framework for animal food ingredients and additives, including the Food Additive Petition pathway and conditions of use codified in 21 CFR 571. For global suppliers, these parallel systems shape product design, such as DSM/NCIMB strain deposits, CFU specifications, and labeling, and they reward companies that can sustain multi-year dossier work, especially when approvals cover multiple intended functions (for example, gut flora stabilizers versus technological additives such as silage additives authorized under implementing regulations including (EU) 2026/1020).
Competitive Landscape
The top five players command 43.8% of 2024 revenue, signifying moderate concentration that still allows regional innovators space to operate. BASF SE holds an 11.5% share through its broad BalanGut and monoglyceride lines that address gut-barrier integrity, while dsm-firmenich’s 10.3% stake faces restructuring as the company divests its Animal Nutrition and Health unit in 2025. This divestiture could catalyze share redistribution, particularly if private equity buyers integrate the asset into existing feed platforms.
Strategic differentiation centers on proprietary strain libraries, encapsulation patents, and digital integration services that model feed-converter responses in real-time. Evonik’s joint venture with Shandong Vland Biotech illustrates the importance of local manufacturing that lowers logistics costs and meets domestic content rules in China. Lesaffre’s acquisition of Biorigin boosts yeast-derived prebiotic capacity, ensuring a secure supply of mannan-oligosaccharides amid rising Brazilian demand.
Supply-chain resilience underpins competitive success. Companies vertically integrate fermentation input streams or partner with single-cell-protein ventures to hedge fishmeal shortages. Those investments not only protect margins but also resonate with sustainability commitments that retailers and investors track through scope-3 emissions dashboards. The outcome is a dynamic eubiotics market in which scale players must constantly innovate while agile entrants leverage focus and speed to capture niche growth.
Eubiotics Industry Leaders
BASF SE
dsm-firmenich
Novonesis
Cargill, Incorporated
ADM
- *Disclaimer: Major Players sorted in no particular order

Eubiotics Market Companies Covered in this Report
- BASF SE
- dsm-firmenich
- Cargill, Incorporated
- Novonesis
- ADM
- Kemin Industries, Inc.
- Lallemand Inc.
- Evonik Industries AG
- Alltech
- Adisseo
- Huvepharma
- Phibro Animal Health Corporation
- Novus International, Inc.
- Marubeni Corporation (Orffa)
- VetAgro S.p.A.

Market Opportunities and Future Outlook
The clearest opportunity remains in regulatory-compliant, evidence-backed product pipelines that translate microbiome science into dossiers acceptable under frameworks such as the EU feed additive authorization process under Regulation (EC) No 1831/2003 and EFSA review. Suppliers that invest in strain characterization, reproducible manufacturing controls, and efficacy packages can reduce reformulation and resubmission cycles as implementing regulations add new authorizations or renewals. They can also support retailer and integrator antibiotic-reduction programs with documented outcomes rather than generic claims.
Formulation and delivery technologies also widen the value pool, particularly for species and production systems where stability and precision dosing are decisive. This is consistent with ongoing commercialization in 2024-2026: dsm-firmenich advanced EU-approved performance nutrition capabilities with ProAct 360 in poultry (EU approval announced in April 2024), while Novonesis expanded ruminant-focused probiotic offerings with a Bacillus-based dairy product (Bovacillus) introduced in Europe in 2026. Together, these moves reinforce demand for multi-modal programs (probiotic, prebiotic, postbiotic, and enzyme-adjacent solutions) that producers can validate using measurable feed efficiency and health indicators.
Recent Industry Developments in Eubiotics Market
- April 2026: Novonesis introduced Bovacillus, a Bacillus-based probiotic positioned for dairy cattle productivity in Europe. The launch extends eubiotics adoption beyond monogastrics into ruminant programs, where suppliers compete on strain robustness and on-farm performance validation.
- June 2025: dsm-firmenich launched GutServ Biotics, a postbiotic solution aimed at supporting healthier piglets. The release broadens the companys gut-health toolkit beyond live microbes and supports producers seeking more process-stable solutions in intensive swine systems.
- April 2024: dsm-firmenich announced EU regulatory approval for ProAct 360, a second-generation feed protease for poultry. This strengthens enzyme-adjacent performance nutrition offerings that can be paired with eubiotic strategies to improve feed utilization under antibiotic-reduction programs.


Eubiotics Market Report Scope and Research Methodology
Market Definition and Coverage
The eubiotics market is defined as the value of gut health feed additives used in animal nutrition to support beneficial intestinal microflora and improve feed efficiency, health, and performance. This includes products sold into feed mills, premixers, integrators, and farm channels as commercial eubiotic solutions.
Scope exclusions: This sizing excludes veterinary drugs and antibiotic growth promoters, and it also leaves out general feed enzymes, vitamins, and minerals that are not positioned or sold as eubiotic gut health solutions.
Segments Covered in This Report
- By Type
- Probiotics
- Lactobacilli
- Bifidobacteria
- Other Probiotics (Bacillus subtilis, Saccharomyces boulardii, etc.)
- Prebiotics
- Inulin
- Fructo-oligosaccharides
- Galacto-oligosaccharides
- Other Prebiotics (Mannan-oligosaccharides, beta-Glucans, etc.)
- Organic Acids
- Essential Oils (Phytogenics)
- Probiotics
- By Animal Type
- Ruminant
- Poultry
- Swine
- Aquaculture
- Other Animal Types (Companion Animals, Equines, etc.)
- By Form
- Dry (powder, granule)
- Liquid (solution, suspension, emulsion)
- By Function (Primary Objective)
- Gut-health and performance enhancement
- Immunity enhancement
- Pathogen control / disease mitigation
- Feed-efficiency improvement
- By Geography
- North America
- United States
- Canada
- Mexico
- Rest of North America
- Europe
- Germany
- United Kingdom
- France
- Spain
- Italy
- Russia
- Rest of Europe
- Asia-Pacific
- China
- Japan
- India
- Australia
- Rest of Asia-Pacific
- South America
- Brazil
- Argentina
- Rest of South America
- Middle East
- Saudi Arabia
- Turkey
- Rest of Middle East
- Africa
- South Africa
- Rest of Africa
- North America
Data Sources, Market Sizing, and Validation
Desk Research
Desk work was first used to map what is counted as eubiotics in animal feed, and to set the country and species demand context. We referenced public sources such as FAOSTAT livestock and feed output series, USDA livestock, poultry, and feed reports, Eurostat agriculture and trade tables, and national agriculture ministry publications where they are available for major producing countries.
To keep the market model grounded, we also reviewed company annual reports and investor decks for feed additives exposure, along with association websites and technical papers that discuss the shift away from antibiotic growth promoters and the adoption of gut health programs. Patent and scientific literature scans were used to understand ingredient trends and product form moves (dry versus liquid), and paid subscriptions focused on company financials and patent intelligence helped with cross-checks where public disclosures were thin. The desk sources mentioned here are illustrative, and many other public references were also reviewed to fill gaps and validate assumptions.
Primary Interviews and Surveys
Primary work was used to verify the real buying behavior behind eubiotics, since product claims and labeling can vary widely across markets. We spoke with a mix of feed additive suppliers, feed manufacturers, integrators, distributors, and nutrition consultants across key livestock regions to confirm product mix, typical inclusion rates, and price movement (especially for probiotics, organic acids, and essential oils).
Findings from these discussions were then used to adjust country-level adoption assumptions, align average selling price ranges to actual contract practices, and validate whether volume growth is being driven more by species expansion, tighter regulations, or replacement of antibiotic growth promoters.
Distribution of primary research fieldwork respondents
| Company type | Respondent position | Region |
|---|---|---|
| Top tier: 27% | CXOs: 17% | APAC: 42% |
| Mid tier: 54% | Functional/Unit leaders: 41% | EMEA: 31% |
| Smaller Players: 19% | Managers: 42% | Americas: 27% |
Market-Sizing & Forecasting
Sizing starts with a top-down build where livestock headcount, commercial feed production, and practical eubiotics penetration are used to reconstruct the addressable feed additive demand pool, and then convert it into value using indicative price bands. Since buying is often done through premixes and integrated channels, penetration and pricing were treated differently by species and by region, and then rolled up to a global total.
To keep the totals grounded, selective bottom-up checks were run using supplier revenue exposure, channel feedback on mix shifts, and sampled volume times average selling price for the most common product types. Key inputs that were tracked include feed production growth, broiler and swine output trends, restrictions on antibiotic growth promoters, the move toward gut health programs, dry versus liquid form share, and typical inclusion rates for probiotics and organic acids. Where a local data gap existed, proxy indicators were used (such as feed output or meat production), and the assumption was re-tested through expert calls before being applied.
Forecasting relied on scenario analysis supported by a light multivariate view of the main drivers, where adoption curves and price progression were stress-tested against expected livestock output and regulation enforcement strength. The final forecast path was accepted only after it matched the direction and pace described by industry respondents, especially around replacement intensity for antibiotics and the pace of integrator adoption.
Data Validation & Update Cycle
Validation is done through several checks so the market value does not depend on one data series. Model outputs are compared with independent signals like feed production trends, livestock output changes, trade direction for key ingredients, and revenue commentary found in public filings, and then any large variance is investigated.
Anomalies are flagged at country and species level, followed by a second analyst review of the drivers, calculations, and currency conversions before sign-off. When a major event changes pricing or adoption (for example a regulation change or a disease shock), the assumptions are rechecked and expert contacts may be revisited to confirm what is happening on the ground. Reports are refreshed at least once a year, and right before delivery a final pass is done to reflect the most recent updates in the model.
Mordor Intelligence's Eubiotics Market Sizing Compared With Other Published Estimates
Published eubiotics market numbers can look quite different even when the topic name is the same, since each publisher chooses its own product scope, end-use coverage, and year assumptions. Differences also come from how quickly average prices are assumed to rise, which regions are treated as mature versus high growth, and how much primary feedback is used to correct desk-based adoption estimates.
The main gap comes from whether adjacent feed additive categories are bundled in. Mordor Intelligence counts only defined eubiotic types used for gut microflora support in animal feed (probiotics, prebiotics, organic acids, and essential oils), and it does not fold in broader gut health solutions like enzymes and synbiotics that can inflate the total. A second driver is the base year choice, since some estimates quote 2025 values while this study's published current-year number is 2026, which changes the starting point in a fast-growing market.
Benchmark comparison
| Source | Market Size | Gaps in Research Methodology |
|---|---|---|
| Mordor Intelligence | USD 6.77 B (2026) | |
| Global Research Publisher A | USD 6.28 B (2025) | Uses a 2025 base year and a different forecast window, and its segment coverage emphasized a narrower set of end uses, which can shift the total when rolled forward to 2026. |
| Industry Publisher B | USD 8.71 B (2025) | Appears to include a wider definition of gut health feed additives, with additional categories such as enzymes and synbiotics included alongside core eubiotics, which raises the reported 2025 market value. |
The table shows that year selection and what gets counted as eubiotics explain most of the spread, more than any single growth assumption. By keeping inputs tied to visible livestock and feed indicators and then pressure-testing prices and adoption through expert feedback, we land on a market size that is easier to reproduce and interpret for planning.


Key Questions Answered in the Report
What is the Eubiotics market size in 2026 and how fast is it growing?
The market stands at USD 6.77 billion in 2026 and is projected to expand at a 7.42% CAGR to reach USD 9.67 billion by 2031.
Which Eubiotic type commands the largest revenue share?
Probiotics lead the landscape with 41.10% of 2025 revenue, supported by extensive clinical validation and favorable regulatory precedents.
What are the fastest-growing product and animal segments?
Essential oils record the quickest 9.64% CAGR through 2031, while the aquaculture segment posts an 8.44% CAGR as global fish and shrimp production scales up.
What key factors fuel demand for eubiotics?
Regulatory bans on antibiotic growth promoters, consumer preference for clean-label meat and dairy, rapid aquaculture expansion, and precision-nutrition technologies collectively accelerate adoption.
Page last updated on:


 Your data is secure and never sold or shared.


