Environmental Testing Equipment Market Size and Share
Market Overview
| Study Period | 2019 - 2030 |
|---|---|
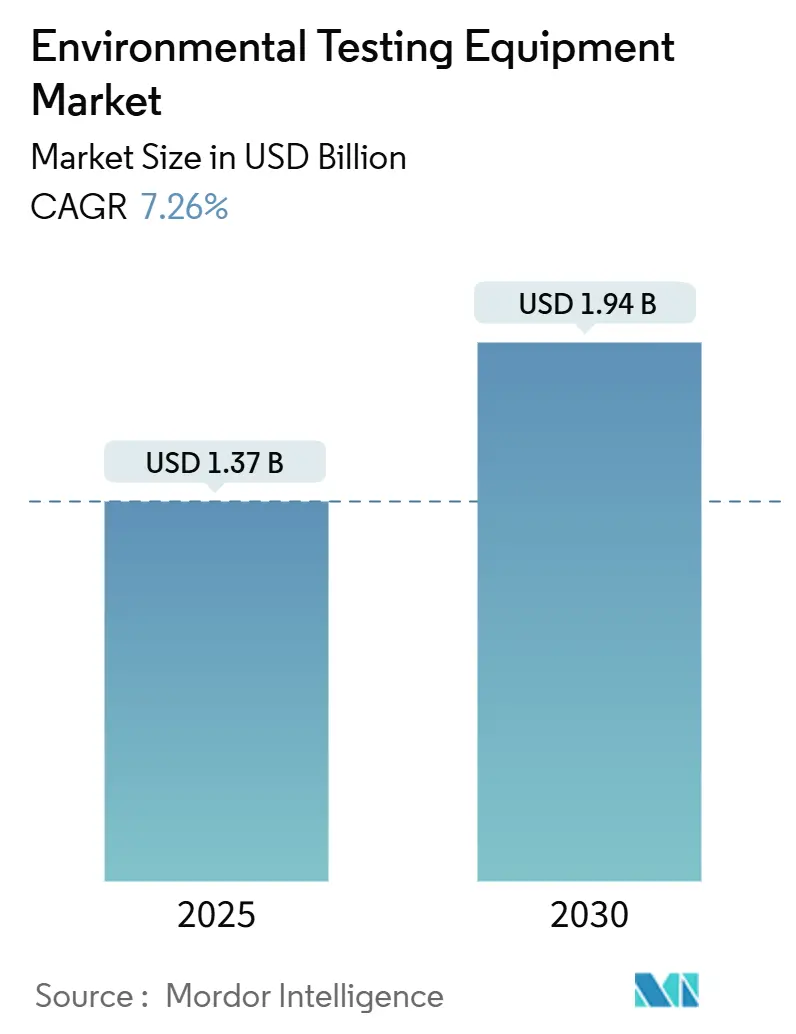
| Market Size (2025) | USD 1.37 Billion |
| Market Size (2030) | USD 1.94 Billion |
| Growth Rate (2025 - 2030) | 7.26% CAGR |
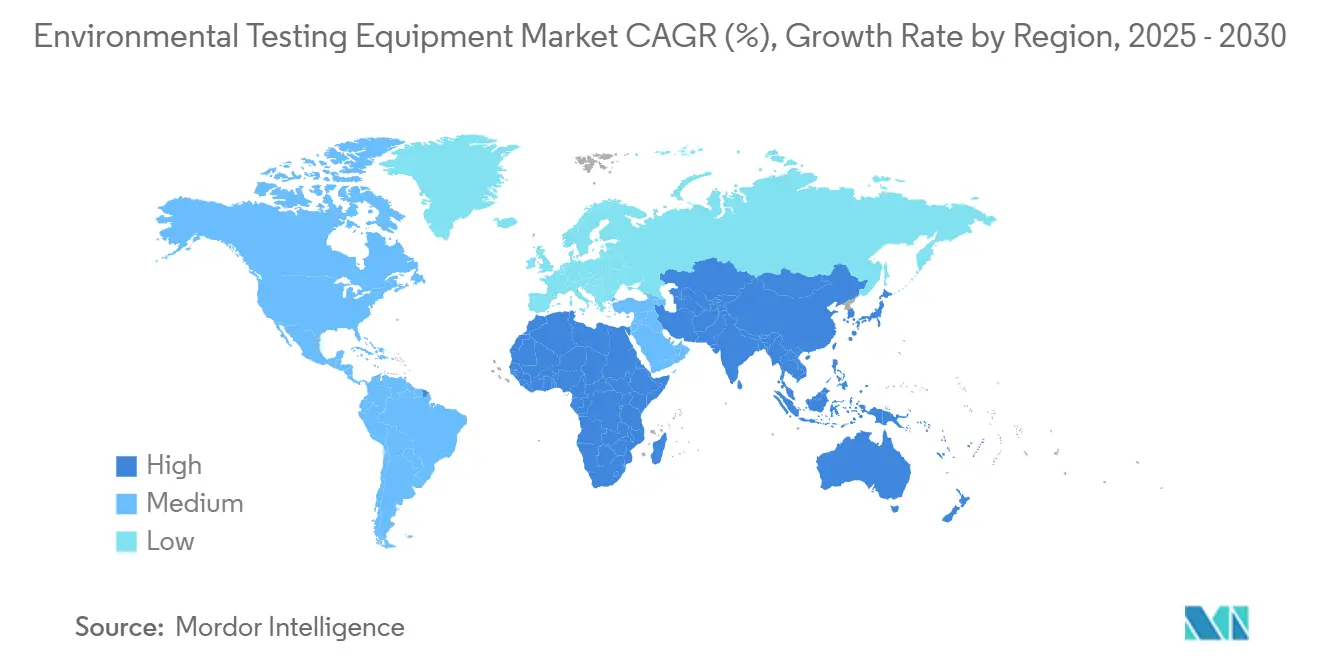
| Fastest Growing Market | Africa |
| Largest Market | Asia Pacific |
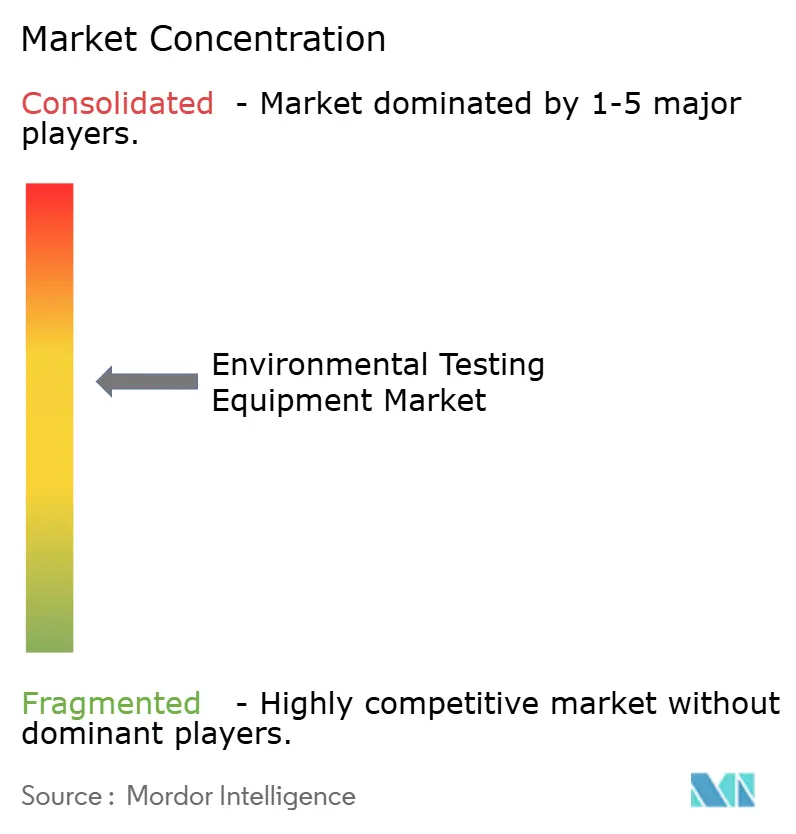
| Market Concentration | Medium |
Major Players *Disclaimer: Major Players sorted in no particular order Image © Mordor Intelligence. Reuse requires attribution under CC BY 4.0. | |
Environmental Testing Equipment Market Analysis by Mordor Intelligence
The environmental testing equipment market size is valued at USD 1.37 billion in 2025 and is projected to reach USD 1.94 billion by 2030, reflecting a 7.26% CAGR over the period. The Environmental testing equipment market is shifting from retrospective compliance checks toward real-time, data-centric risk management that anticipates regulatory changes before they arrive. Portable analyzers are increasingly replacing benchtop systems in fieldwork, while lab-on-chip sensors condense multi-step assays into single-use cartridges that non-specialists can operate. The convergence of climate-resilient infrastructure funding, ESG-linked capital, and tightening air and water standards is amplifying demand for equipment capable of continuous monitoring and measurement. Competitive pressure is intensifying as software-first entrants embed machine-learning algorithms into ruggedized devices, allowing predictive maintenance without cloud connectivity.
Key Report Takeaways
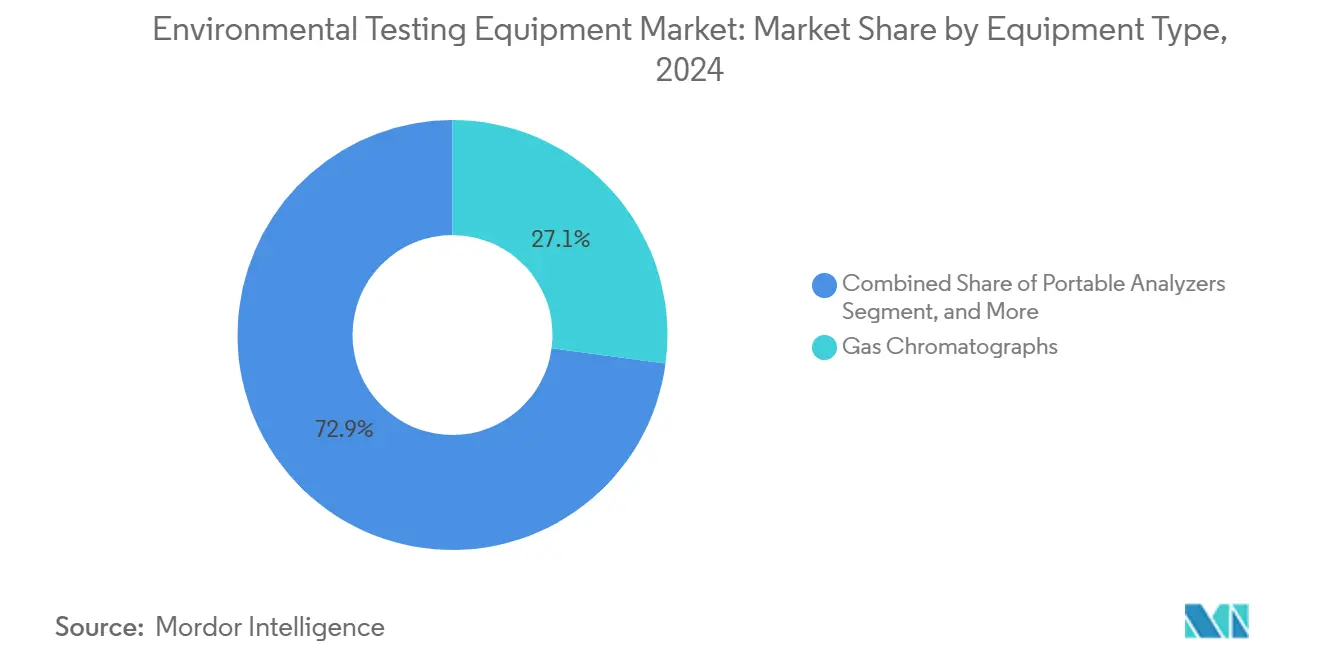
- By equipment type, gas chromatographs accounted for 27.12% of the environmental testing equipment market size in 2024, whereas portable analyzers are forecast to grow at an 8.66% CAGR through 2030.
- By sample type, water and wastewater testing accounted for 42.37% of the environmental testing equipment market size in 2024, but food and agricultural samples are expected to grow at an 8.27% CAGR over the forecast period.
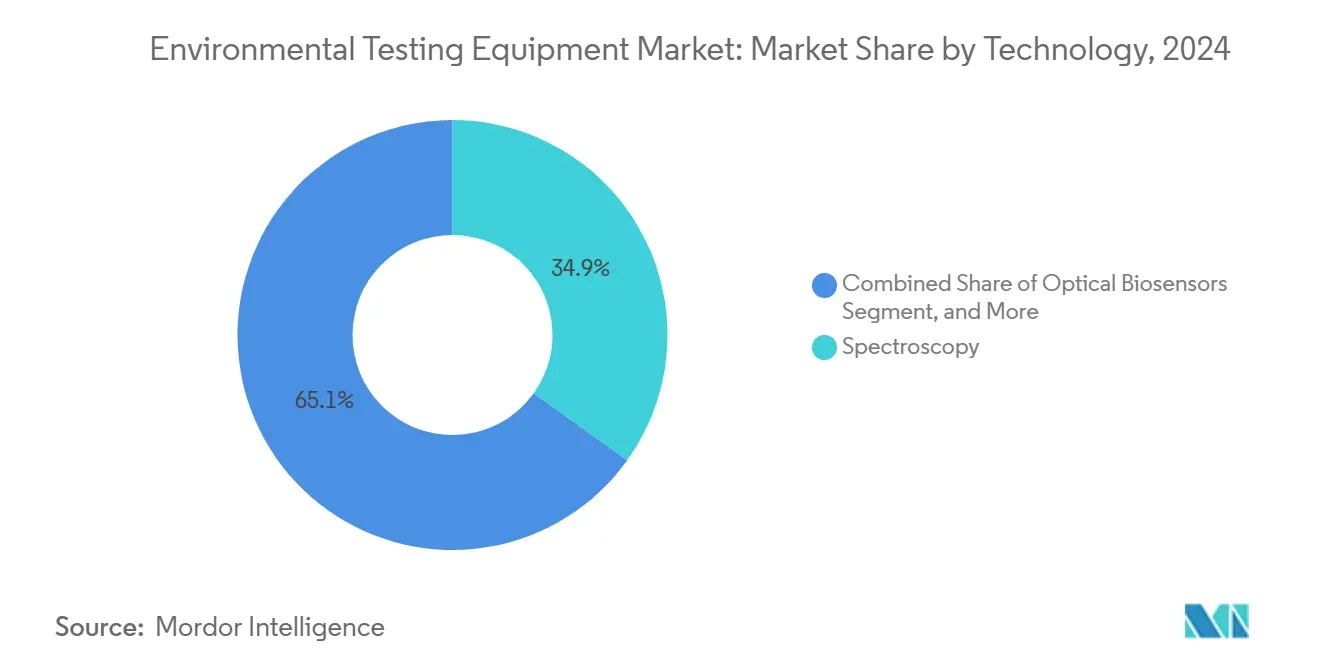
- By technology, spectroscopy led with a 34.89% of the environmental testing equipment market size in 2024, while optical biosensors are forecast to expand at an 8.32% CAGR through 2030.
- By end-use industry, municipal water treatment utilities held a 29.67% of the environmental testing equipment market size in 2024, while agriculture is projected to record an 8.79% CAGR through 2030.
- By geography, the Asia Pacific accounted for 35.83% of the environmental testing equipment market size in 2024, whereas Africa is expected to post an 8.21% CAGR from 2024 to 2030.
Global Environmental Testing Equipment Market Trends and Insights
Drivers Impact Analysis*
| Driver | (~) % Impact on CAGR Forecast | Geographic Relevance | Impact Timeline |
|---|---|---|---|
| Stringent Environmental Compliance Norms | +1.8% | Global, peak enforcement in North America and Europe | Medium term (2-4 years) |
| Rising Industrial Discharge Monitoring | +1.5% | Asia Pacific core, spill-over to Middle East and Africa, South America | Short term (≤ 2 years) |
| Growing Adoption of Portable Water Analyzers | +1.2% | Global, early gains in Asia Pacific and Africa utilities | Short term (≤ 2 years) |
| Government Funding for Climate-Resilient Infrastructure | +1.0% | Africa, South Asia, Latin America | Long term (≥ 4 years) |
| Lab-on-Chip Sensors for In-Situ Analysis | +0.9% | North America and Europe, pilot sites in Asia Pacific | Medium term (2-4 years) |
| ESG-Driven Capital Allocation | +0.7% | Global, concentrated in venture hubs | Long term (≥ 4 years) |
| Source: Mordor Intelligence | |||
Stringent Environmental Compliance Norms Globally
Regulatory bodies have compressed the interval between policy release and enforcement, prompting operators to install monitoring capacity ahead of schedule. The United States Environmental Protection Agency lowered the annual PM2.5 limit from 12 μg/m³ to 9 μg/m³ in February 2024, triggering accelerated upgrades of continuous emission monitoring systems across power stations and cement kilns.[1]U.S. Environmental Protection Agency, “Final Reconsideration of the National Ambient Air Quality Standards for Particulate Matter,” epa.gov Europe followed with Industrial Emissions Directive amendments that require real-time volatile organic compound reporting rather than 24-hour averages. China expanded its automatic discharge-monitoring network to 12,000 industrial sites in 2024, mandating sensors capable of detecting heavy metals at parts-per-billion levels. Collectively, these moves favor vendors offering integrated sensor-plus-software packages because they streamline compliance reporting. The Environmental testing equipment market benefits as customers migrate from periodic grab sampling to continuous inline analysis.
Rising Industrial Discharge Monitoring Requirements
Emerging economies are tightening effluent standards while condensing implementation timelines, creating demand for turnkey solutions that bypass the need for in-house chemists. India’s Central Pollution Control Board obliged textile and pharmaceutical clusters to transmit pH, chemical oxygen demand, and total dissolved solids data every 15 minutes starting in 2024.[2]Central Pollution Control Board, “Revised Effluent Standards for Textile and Pharmaceutical Industries,” cpcb.nic.in Vietnam and Indonesia launched similar frameworks requiring portable ion-selective electrodes for ammonia and nitrate tracking. These initiatives catalyze adoption of portable analyzers and electrochemical sensors, as they cost less and deploy faster than laboratory chromatographs. Consequently, the Environmental testing equipment market is experiencing heightened sales velocity in Asia Pacific industrial corridors.
Growing Adoption of Portable Water Quality Analyzers
Utilities in water-stressed regions are equipping field crews with handheld devices that map contaminants in real time. A 2024 World Bank report showed that African utilities using portable turbidity and chlorine meters cut non-revenue water by 22% by locating leaks within 48 hours.[3]The World Bank, “Water Global Practice Report 2024,” worldbank.org Commercial launches such as Xylem’s Aqua TROLL 500 and Hach’s solar-charged spectrophotometer illustrate a product shift toward rugged, autonomous tools that operate off-grid. When sample transport jeopardizes data integrity or turnaround times, portable analyzers offer a pragmatic workaround, bolstering Environmental testing equipment market penetration among smaller municipalities.
Increasing Government Funding for Climate-Resilient Infrastructure
Development banks now embed continuous monitoring clauses into water-security loans, turning testing instruments into loan covenants rather than optional purchases. The African Development Bank allocated USD 1.2 billion in 2024 for projects that must install automated groundwater-salinity and pathogen analyzers to unlock disbursements. Similar conditional finance from the Green Climate Fund and Brazil’s National Water Agency is proliferating. Vendors that bundle hardware, calibration, and data-management services into multi-year contracts secure recurring revenue, reinforcing Environmental testing equipment market growth across emerging geographies.
Restraints Impact Analysis*
| Restraint | (~) % Impact on CAGR Forecast | Geographic Relevance | Impact Timeline |
|---|---|---|---|
| High Capital Cost of Advanced Instruments | -1.3% | Asia Pacific, Africa, South America | Short term (≤ 2 years) |
| Skills Shortage of Analytical Chemists | -0.9% | Sub-Saharan Africa, South Asia, Southeast Asia | Medium term (2-4 years) |
| Supply Chain Volatility for Optical Parts | -0.7% | Global, acute in North America and Europe | Short term (≤ 2 years) |
| Data Integrity Concerns in Cloud Devices | -0.5% | Global, highest scrutiny in Europe and North America | Medium term (2-4 years) |
| Source: Mordor Intelligence | |||
High Capital Cost of Advanced Analytical Instruments
ICP-MS and high-resolution spectrometers cost upward of USD 300,000, deterring utilities and small industries in capital-constrained markets. An International Water Association survey in 2024 found that 68% of African utilities identified price as the main barrier to adopting continuous systems. Pay-per-test and leasing models exist but often demand credit enhancements unavailable to public entities. As a result, lower-cost portable devices gain favor, yet these lack the sensitivity of premium systems, limiting analytical scope and marginally tempering Environmental testing equipment market expansion.
Shortage of Skilled Analytical Chemists in Emerging Nations
Sophisticated instrumentation proliferates faster than the workforce capable of calibrating and troubleshooting it. The World Health Organization reported in 2024 that sub-Saharan Africa employs fewer than 2 chemists per 100,000 people versus 15 in high-income regions. Under-utilization and data-quality lapses ensue, prompting regulators to question laboratory results. Though vendors add automated calibration and remote diagnostics, the added cost can offset usability gains, slowing adoption across several Environmental testing equipment market segments.
*Our forecasts treat driver/restraint impacts as directional, not additive. The impact forecasts reflect baseline growth, mix effects, and variable interactions.
Segment Analysis
By Equipment Type: Portable Analyzers Reshape Field Workflows
The Environmental testing equipment market size attributed to gas chromatographs stood at a 27.12% share in 2024, reflecting entrenched use in volatile organic compound profiling. Portable analyzers, however, are projected to record an 8.66% CAGR through 2030, underscoring a pivot toward rapid on-site decision-making. Municipal utilities and consultants value immediate readings even if sensitivity is modest, while mass spectrometers still dominate trace analysis where regulation dictates parts-per-trillion limits. Liquid chromatographs remain indispensable in pesticide residue testing, but their bulky solvent systems hamper mobility. Mass-spectrometry innovations, such as Thermo Fisher’s Orbitrap Exploris GC platform, automate sample prep and overnight runs, raising throughput.
Second-generation portable devices use modular sensor cartridges, enabling operators to swap chemistries in minutes and amortize the base unit across applications. Continuous emission monitoring systems, though mature, are being retrofitted with optical sensors to meet tightened PM2.5 thresholds in North America. This re-tooling sustains equipment upgrades even where installed bases are high, keeping the Environmental testing equipment market share of incumbent vendors relatively stable while empowering newcomers focused on mobility and ease of use.


By Sample Type: Food and Agricultural Samples Accelerate
Water and wastewater retained 42.37% of total 2024 testing volume, yet food and agricultural samples are forecast to expand at an 8.27% CAGR through 2030. Export certification now hinges on sub-parts-per-billion residue limits, compelling growers and processors to migrate toward LC-MS/MS platforms. The Environmental testing equipment market size for food testing thus grows alongside stricter Codex Alimentarius thresholds. Soil and sediment analysis is also expanding through handheld X-ray fluorescence tools that de-risk redevelopment projects by flagging heavy-metal hotspots on-site.
Subsidies and sustainability labels incentivize farmers to document nutrient management. Southeast Asian cooperatives deploy ion-selective electrodes to monitor nitrate leaching, aligning with market-access requirements from multinational buyers. Air-sample testing remains critical for industrial hygiene but grows more slowly because monitoring networks are capital intensive. Nonetheless, demands for real-time alerts in petrochemical corridors keep specialized analyzers relevant within the broader Environmental testing equipment market.
By Technology: Optical Biosensors Gain Ground
Spectroscopy commanded 34.89% of 2024 revenue, leveraging established atomic absorption and UV-Vis methods. Optical biosensors are expected to grow at an 8.32% CAGR through 2030, reflecting affinity-based detection that circumvents chromatographic separation. The Environmental testing equipment market share of chromatography remains robust where complex mixtures require peak resolution, but operator shortage and consumable costs create openings for surface plasmon resonance and fiber-optic platforms.
Molecular diagnostics are migrating from research to routine monitoring, with wastewater epidemiology validating PCR-based workflows. Agilent’s triple-quadrupole ICP-MS update enhances collision-cell performance to resolve seawater matrices without dilution. Electrochemical sensors, buoyed by nanomaterial coatings, dominate basic parameters such as pH and dissolved oxygen. Technology diversification benefits buyers who can tailor sensitivity, portability, and cost to specific risk profiles, widening the Environmental testing equipment market addressable base.
By End-Use Industry: Agriculture Emerges as Growth Leader
Municipal water utilities held a 29.67% slice of 2024 revenue, mandated to monitor turbidity, chlorine residual, and microbes continuously. Agriculture is forecast to post the fastest 8.79% CAGR as precision irrigation and sustainability certifications link subsidies to documented soil-moisture and nitrate data. The Environmental testing equipment market size related to farming applications is thus set to expand markedly. Environmental agencies maintain stable demand for inspection gear, while oil and gas operators adopt inline analyzers for produced-water treatment under stricter benzene limits.
Pharmaceutical manufacturers face new effluent thresholds for active ingredients, driving adoption of LC-MS systems. The United States Department of Agriculture broadened cost-share eligibility in 2024 for farmers installing soil probes. Such programs translate into predictable orders for sensor suppliers, ensuring that agriculture’s rising share is not a transient spike but a structural addition to the Environmental testing equipment market.
Geography Analysis
Asia Pacific accounted for 35.83% of 2024 global sales after China extended its discharge-monitoring network and India tightened consent-to-operate rules for industrial clusters. National initiatives in Vietnam, Indonesia, Japan, South Korea, and Australia continue to integrate real-time sensing into financed infrastructure, supporting steady Environmental testing equipment market growth. Early 2025 saw South Korea earmark USD 200 million for optical biosensors in the Han River, highlighting regional appetite for next-generation technologies. India’s textile and pharmaceutical corridors, meanwhile, rely on cloud-connected probes to satisfy state monitoring servers.
Africa is projected to grow at an 8.21% CAGR through 2030. Concessional funding from the African Development Bank mandates automated salinity and pathogen instruments in water-security projects. South Africa’s mining effluent standards and Egypt’s handheld nutrient-meter rollout in the Nile Delta further cement demand for rugged portable devices. Kenya’s introduction of real-time turbidity monitoring for Nairobi’s supply underscores the continent’s shift toward continuous data capture, widening the Environmental testing equipment market footprint despite budget constraints.
North America and Europe remain anchor markets, yet future revenue comes from upgrading legacy systems rather than expanding installed bases. The U.S. PM2.5 revision in 2024 obliges power generators to swap flame-ionization detectors for optical sensors. European directives now require sub-ppm volatile organic compound reporting, encouraging retrofits of continuous monitoring systems. Germany’s new groundwater protocols for per- and polyfluoroalkyl substances push demand for LC-MS/MS instruments. Simultaneously, data-management software that integrates distributed sensors is gaining traction, rewarding vendors that offer hardware-plus-platform bundles in the Environmental testing equipment market.

Competitive Landscape
The Environmental testing equipment market is moderately concentrated: the five largest vendors, Agilent Technologies, Thermo Fisher Scientific, Waters Corporation, Shimadzu Corporation, and Danaher Corporation hold roughly 45% combined share. Incumbents defend margins on laboratory-grade systems while acquiring software start-ups to enhance analytics. Xylem’s 2024 purchase of Idrica integrated real-time leak detection with predictive maintenance. Danaher’s Abcam acquisition injects proprietary antibodies into pathogen-detection workflows, strengthening biotoxin analysis. Patent filings for microfluidic modules rose 40% in 2024, signaling a race to automate sample prep.
Rivalry is intensifying over data provenance and cybersecurity. ISO/IEC 27001:2024 introduced controls covering sensor networks, pushing vendors to embed cryptographic validation in firmware. Smaller firms such as Aclima and LuminUltra differentiate through blockchain-secured audit trails that comply with sustainability-reporting frameworks. Equipment-as-a-service contracts convert capital expenditure into operating fees, lowering adoption hurdles for municipalities and small industrial players while shifting revenue from one-off sales to subscriptions. Collectively, these dynamics shape product roadmaps and dictate pricing power across the Environmental testing equipment market.
Environmental Testing Equipment Industry Leaders
Agilent Technologies, Inc.
Thermo Fisher Scientific Inc.
Waters Corporation
Shimadzu Corporation
PerkinElmer Inc.
- *Disclaimer: Major Players sorted in no particular order

Recent Industry Developments
- October 2025: Danaher’s Hach business introduced the Claros Guardian subscription service, bundling hardware upgrades, predictive maintenance analytics, and compliance reporting software into a single annual fee aimed at small municipal utilities seeking operating-expenditure solutions.
- August 2025: Thermo Fisher Scientific launched the EonView Cloudless platform, a portable spectroscopic sensor array that performs real-time volatile organic compound monitoring with on-device machine-learning analytics, eliminating the need for continuous internet connectivity in remote field sites.
- May 2025: Shimadzu Corporation opened a USD 120 million smart-manufacturing plant in Kyoto dedicated to microfluidic cartridge production for its new NexChip portable water-quality analyzers, doubling global capacity for single-use lab-on-chip consumables.
- March 2025: Agilent Technologies rolled out the 8900 Plus ICP-MS system with an integrated AI-driven interference correction engine, enabling rapid detection of trace metals in seawater at parts-per-trillion levels and cutting analysis time by 25% compared with the previous model.


Global Environmental Testing Equipment Market Report Scope
The Environmental Testing Equipment Market Report is Segmented by Equipment Type (Gas Chromatographs, Liquid Chromatographs, Mass Spectrometers, ICP-OES and ICP-MS, PCR and QPCR Systems, Continuous Emission Monitoring Systems, Portable Analyzers), Sample Type (Water and Wastewater, Air, Soil and Sediment, Food and Agricultural Samples, Industrial Effluents), Technology (Spectroscopy, Chromatography, Molecular Diagnostics, Electrochemical Sensors, Optical Biosensors), End-Use Industry (Municipal Water Treatment Utilities, Environmental Protection Agencies, Oil and Gas, Chemical and Petrochemical, Pharmaceuticals, Power Generation, Agriculture), and Geography (North America, Europe, Asia-Pacific, Middle East and Africa, South America). The Market Forecasts are Provided in Terms of Value (USD).
| Gas Chromatographs |
| Liquid Chromatographs |
| Mass Spectrometers |
| ICP-OES and ICP-MS |
| PCR and qPCR Systems |
| Continuous Emission Monitoring Systems (CEMS) |
| Portable Analyzers |
| Water and Wastewater |
| Air |
| Soil and Sediment |
| Food and Agricultural Samples |
| Industrial Effluents |
| Spectroscopy |
| Chromatography |
| Molecular Diagnostics |
| Electrochemical Sensors |
| Optical Biosensors |
| Municipal Water Treatment Utilities |
| Environmental Protection Agencies |
| Oil and Gas |
| Chemical and Petrochemical |
| Pharmaceuticals |
| Power Generation |
| Agriculture |
| North America | United States | |
| Canada | ||
| Mexico | ||
| Europe | Germany | |
| United Kingdom | ||
| France | ||
| Russia | ||
| Rest of Europe | ||
| Asia-Pacific | China | |
| Japan | ||
| India | ||
| South Korea | ||
| Australia | ||
| Rest of Asia-Pacific | ||
| Middle East and Africa | Middle East | Saudi Arabia |
| United Arab Emirates | ||
| Rest of Middle East | ||
| Africa | South Africa | |
| Egypt | ||
| Rest of Africa | ||
| South America | Brazil | |
| Argentina | ||
| Rest of South America | ||
| By Equipment Type | Gas Chromatographs | ||
| Liquid Chromatographs | |||
| Mass Spectrometers | |||
| ICP-OES and ICP-MS | |||
| PCR and qPCR Systems | |||
| Continuous Emission Monitoring Systems (CEMS) | |||
| Portable Analyzers | |||
| By Sample Type | Water and Wastewater | ||
| Air | |||
| Soil and Sediment | |||
| Food and Agricultural Samples | |||
| Industrial Effluents | |||
| By Technology | Spectroscopy | ||
| Chromatography | |||
| Molecular Diagnostics | |||
| Electrochemical Sensors | |||
| Optical Biosensors | |||
| By End-Use Industry | Municipal Water Treatment Utilities | ||
| Environmental Protection Agencies | |||
| Oil and Gas | |||
| Chemical and Petrochemical | |||
| Pharmaceuticals | |||
| Power Generation | |||
| Agriculture | |||
| By Geography | North America | United States | |
| Canada | |||
| Mexico | |||
| Europe | Germany | ||
| United Kingdom | |||
| France | |||
| Russia | |||
| Rest of Europe | |||
| Asia-Pacific | China | ||
| Japan | |||
| India | |||
| South Korea | |||
| Australia | |||
| Rest of Asia-Pacific | |||
| Middle East and Africa | Middle East | Saudi Arabia | |
| United Arab Emirates | |||
| Rest of Middle East | |||
| Africa | South Africa | ||
| Egypt | |||
| Rest of Africa | |||
| South America | Brazil | ||
| Argentina | |||
| Rest of South America | |||


Key Questions Answered in the Report
What is the projected value of the environmental testing equipment market in 2030?
The market is forecast to reach USD 1.94 billion by 2030.
Which segment is growing fastest within equipment types?
Portable analyzers are advancing at an 8.66% CAGR through 2030, the highest among equipment categories.
Why is agriculture expected to be the fastest-growing end-use?
Precision-irrigation schemes and sustainability certifications tie financial incentives to real-time soil- and water-quality data, driving an 8.79% CAGR in agricultural demand.
Which technology is poised for the highest growth?
Optical biosensors, leveraging affinity-based detection without chromatography, are projected to grow at an 8.32% CAGR.
How will new air-quality regulations affect demand?
Lower PM2.5 limits in the United States and real-time VOC reporting in Europe require upgraded optical sensors, sustaining replacement sales.
What hampers adoption in emerging markets?
High capital costs of advanced instruments and a shortage of skilled chemists slow uptake, especially in sub-Saharan Africa and South Asia.
Page last updated on:


