
Enterprise Laptop Market Size and Share
Market Overview
| Study Period | 2020 - 2031 |
|---|---|
| Market Size (2026) | USD 113.45 Billion |
| Market Size (2031) | USD 149.47 Billion |
| Growth Rate (2026 - 2031) | 5.67 % |
| Fastest Growing Market | Asia-Pacific |
| Largest Market | North America |
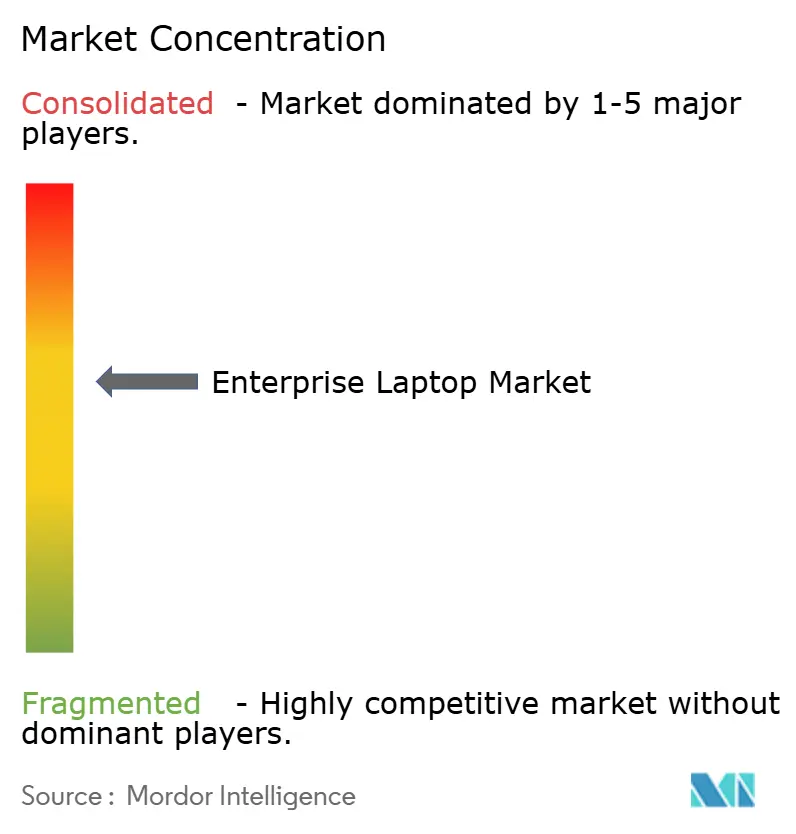
| Market Concentration | Medium |
Major Players *Disclaimer: Major Players sorted in no particular order Image © Mordor Intelligence. Reuse requires attribution under CC BY 4.0. | |
Enterprise Laptop Market Analysis by Mordor Intelligence
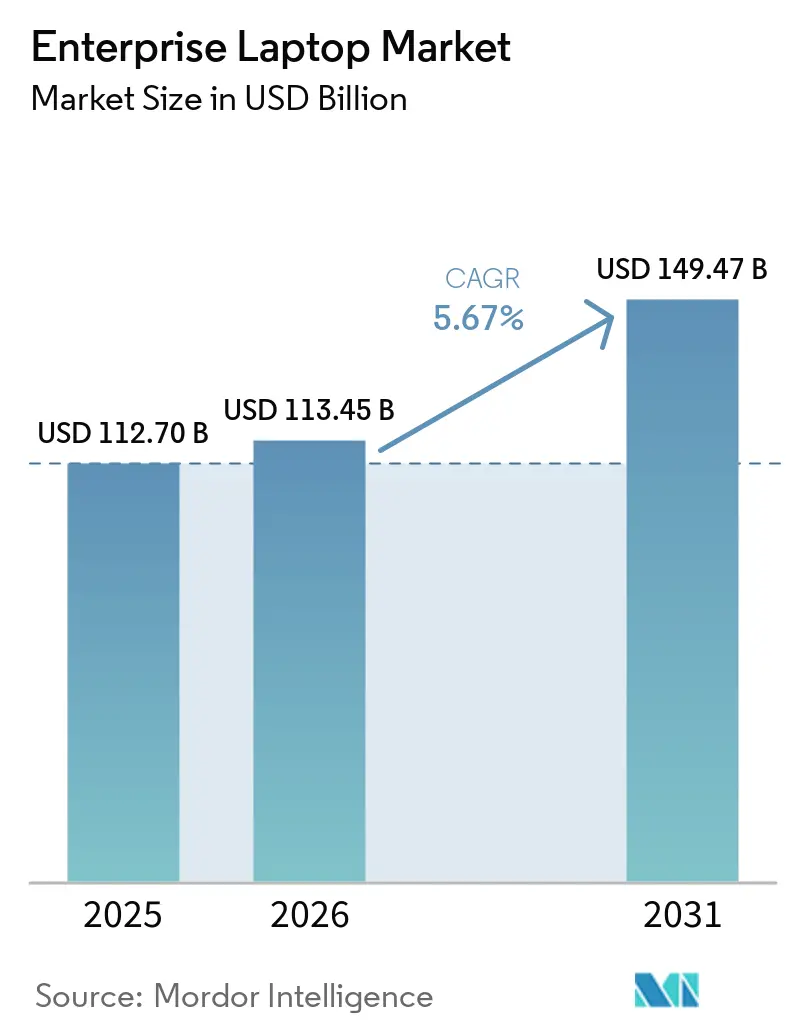
The enterprise laptop market size is expected to be USD 112.70 billion in 2025, USD 113.45 billion in 2026, and reach USD 149.47 billion by 2031, growing at a CAGR of 5.67% from 2026 to 2031. Renewed hardware demand intensified in late 2025 after Microsoft ended Windows 10 support, pulling forward refresh spending that originally sat in multiyear budgets. Pent-up interest in on-device artificial-intelligence acceleration, Wi-Fi 7 radios, and silicon-anode battery chemistries added premium configuration layers that lifted average selling prices. At the same time, data-residency mandates in Europe slowed decision cycles, while component shortages in ≤6 nm memory nodes injected pricing volatility that challenged procurement managers. Mobile workstation popularity, Chrome OS momentum, and PC-as-a-Service financing collectively signaled a structurally more diversified demand base moving into the forecast window.
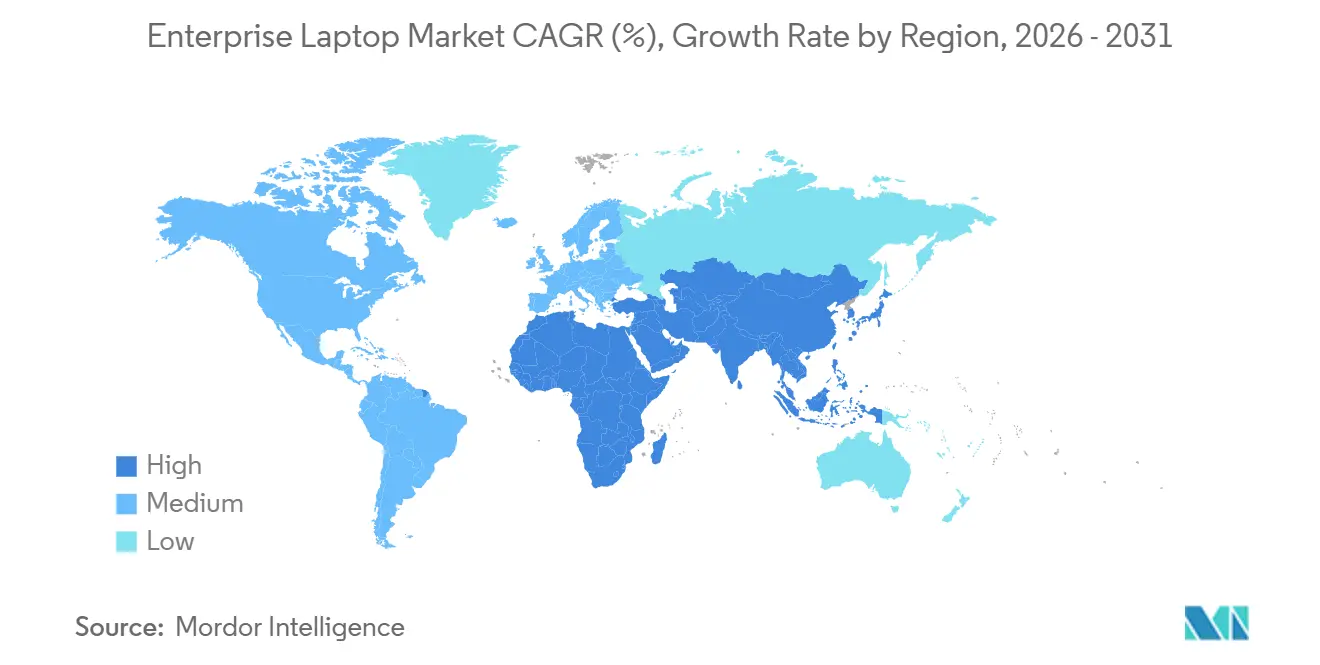
North America provided the largest revenue pool in 2025, yet Asia-Pacific is on the fastest trajectory thanks to India’s double-digit shipment growth and China’s capacity expansions. Large enterprises still dominate volumes, but small and medium enterprises are scaling faster on the back of device-as-a-service contracts that convert capital expense into predictable operating payments. Competitive intensity remains high: Dell, HP, and Lenovo hold clear scale advantages, Apple strengthens its foothold in creative and clinical workflows, and rugged specialists continue to defend their premium niches. Companies that marry hardware-embedded security, sustainability certifications, and AI-ready performance are best placed to capture the next upgrade wave.
Key Report Takeaways
- By geography, North America led with 34.20% of enterprise laptop market share in 2025, while Asia-Pacific is projected to expand at a 7.80% CAGR through 2031.
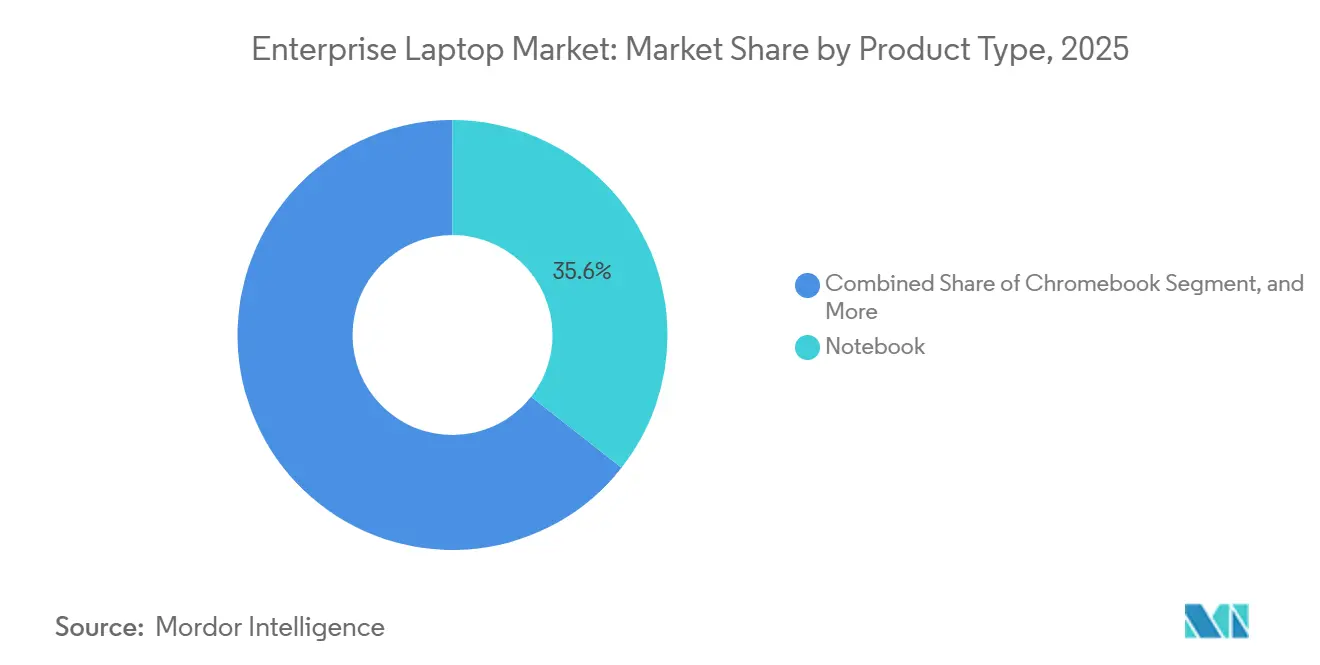
- By product type, traditional notebooks commanded 35.60% revenue share in 2025, whereas mobile workstations are forecast to grow at a 7.55% CAGR between 2026 and 2031.
- By operating system, Windows retained 75.21% share in 2025, yet Chrome OS is advancing at an 8.15% CAGR over 2026-2031.
- By organization size, large enterprises accounted for 63.45% shipment volume in 2025, but small and medium enterprises are expected to post a 9.00% CAGR through 2031.
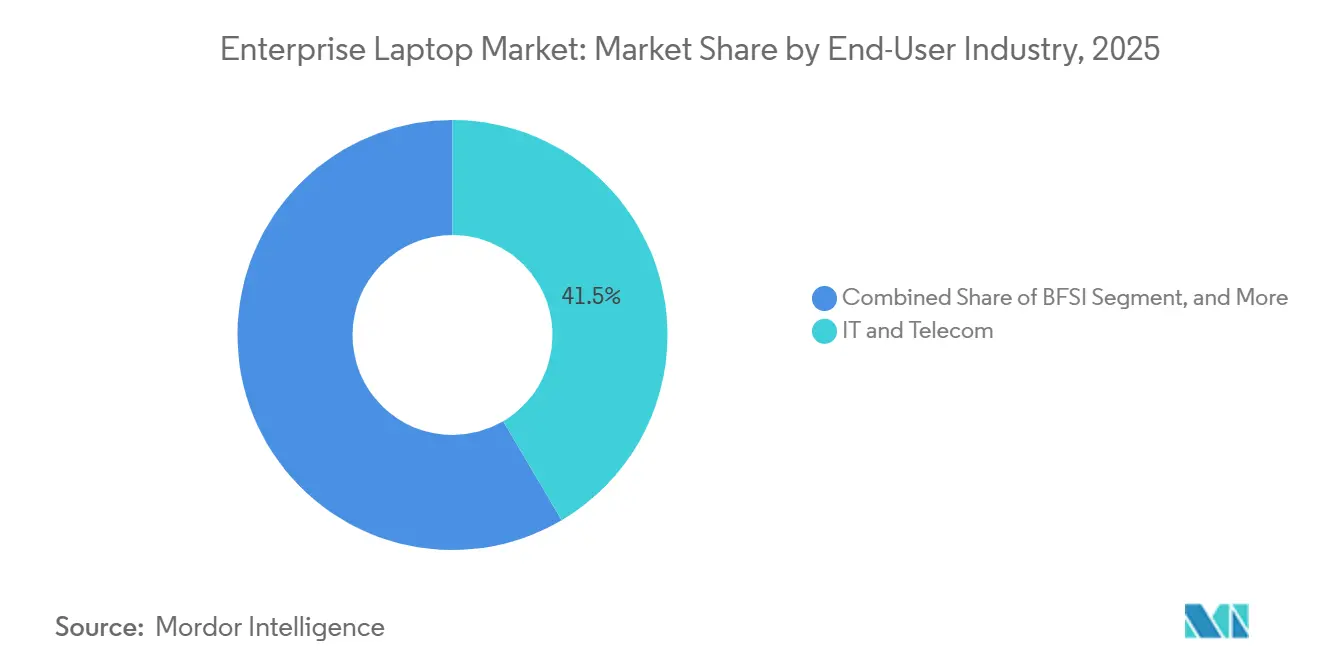
- By end-user industry, information technology and telecommunications held 41.52% share in 2025, while healthcare and life sciences are projected to rise at a 6.74% CAGR to 2031.
- By screen size, the 14-to-16-inch category captured 34.80% share in 2025, whereas displays above 16 inches are on track for an 8.50% CAGR during 2026-2031.
Note: Market size and forecast figures in this report are generated using Mordor Intelligence’s proprietary estimation framework, updated with the latest available data and insights as of January 2026.
Market Trends and Insights
Drivers Impact Analysis of Enterprise Laptop Market*
| Driver | (~) % Impact on CAGR Forecast | Geographic Relevance | Impact Timeline |
|---|---|---|---|
| Accelerating Hybrid-Work Refresh Cycles | +1.8% | Global, peak intensity in North America and Europe | Short term (≤ 2 years) |
| Growing Adoption of Hardware-Embedded Endpoint Security | +1.2% | Global, compliance strongest in Europe and North America | Medium term (2-4 years) |
| Enterprise Migration to Wi-Fi 6/6E Driving Notebook Upgrades | +0.9% | North America and Asia-Pacific core, spill-over to Europe | Medium term (2-4 years) |
| Corporate Sustainability Mandates Favoring Energy-Efficient Laptops | +0.7% | Europe and North America lead, expanding to Asia-Pacific | Long term (≥ 4 years) |
| Expansion of PC-as-a-Service Contracts Among Large Enterprises | +0.6% | North America and Europe, emerging in Asia-Pacific | Medium term (2-4 years) |
| On-Device AI Acceleration Requirements for Productivity Applications | +0.5% | Global, early adoption in IT and telecom, healthcare sectors | Long term (≥ 4 years) |
| Source: Mordor Intelligence | |||
Accelerating Hybrid-Work Refresh Cycles
Enterprises compressed replacement intervals from four-plus years to roughly three years as remote employees required lighter hardware with sustained video-conferencing endurance. Microsoft’s Windows 10 sunset channeled organizations toward Windows 11 devices because extended security updates reach USD 427 per endpoint by year three, creating a cost-avoidance incentive. Roughly 40% of incumbent Windows 10 PCs lacked Trusted Platform Module 2.0, making in-place upgrades impossible and prompting wholesale fleet swaps. Vendors bundled Windows 11 compliance with AI-ready silicon, and half of Asia-Pacific corporate orders in 2025 specified neural-processing-unit capability. The confluence of operating-system transition, hybrid-work ergonomics, and AI messaging accelerated procurement into an 18-month cycle that lifted near-term revenue but front-loaded demand otherwise spread across multiple fiscal periods.
Growing Adoption of Hardware-Embedded Endpoint Security
Ransomware penalties in finance averaged USD 6.08 million per breach, 25% above the cross-industry mean, moving board-level risk committees to mandate hardware roots of trust.[1]European NIS2 and U.S. CISA directives now require cryptographic key storage in firmware for critical infrastructure, which only Common Criteria EAL 4+ certified laptops supply. HP’s TPM Guard, launched in 2025, locks the device if the chip is removed, countering supply-chain tampering. Banking, healthcare, and public-sector buyers therefore shifted shortlists toward models that pass FIPS 140-3 validation, eliminating roughly one-third of consumer-grade SKUs from tender processes. The security driver grows in the medium term as audit frameworks tighten and cyber-insurance premiums favor hardware-based controls.
Enterprise Migration to Wi-Fi 6/6E Driving Notebook Upgrades
Companies installing Wi-Fi 6E and trialing Wi-Fi 7 discovered older laptop radios could not tap the 6-GHz band, undermining network investments. North American campus access-point deployments rose 78% in 2025, creating device mismatch that manifested as latency spikes during video collaboration. Wi-Fi 7’s multi-link operation allows sub-5 ms latency, a prerequisite for manufacturing control systems and tele-surgery use cases. Chipsets bundled Bluetooth 5.4 and ultra-wideband, enabling indoor positioning and proximity authentication but requiring fresh device silicon. Harmonized 6-GHz allocations in 70-plus nations by late 2025 convinced multinational firms to accelerate global notebook upgrades rather than wait for lease expiries.
Corporate Sustainability Mandates Favoring Energy-Efficient Laptops
Seventy-two percent of multinationals requested Scope 3 disclosure from suppliers in 2025, embedding carbon metrics into procurement scorecards. ENERGY STAR 9.0 laptops cut energy use 30% relative to prior baselines, while the European Ecodesign Regulation, effective January 2026, bans models failing 80% recyclability. UNDP’s Digital Sustainability Principles unlocked executive approval for device-take-back programs that exceed 90% verified recycling. Vendors that offer carbon-neutral shipping and recycled aluminum chassis win differentiation points in public tenders, turning environmental compliance into a long-term sales catalyst.
Restraints Impact Analysis of Enterprise Laptop Market*
| Restraint | (~) % Impact on CAGR Forecast | Geographic Relevance | Impact Timeline |
|---|---|---|---|
| Component Supply Volatility in Advanced Nodes (≤ 6 nm) | -0.8% | Global, acute in Asia-Pacific manufacturing hubs | Short term (≤ 2 years) |
| Extended Desktop Lifecycle Policies in Cost-Sensitive SMBs | -0.5% | South America, Africa, price-elastic Asia-Pacific | Medium term (2-4 years) |
| Data-Residency Rules Hindering Global Device Fleet Standardization | -0.3% | Europe, Middle East, emerging Asia-Pacific | Long term (≥ 4 years) |
| Intensifying Competition From Enterprise Chromebooks and Tablets | -0.2% | Education and government sectors globally | Medium term (2-4 years) |
| Source: Mordor Intelligence | |||
Component Supply Volatility in Advanced Nodes (≤ 6 nm)
Memory fabs prioritized high-margin AI accelerators, starving commodity DRAM and NAND lines and lifting contract prices 10-15% in H2 2025. Original equipment manufacturers watched lead times double to 8-12 weeks, forcing phased rollouts that misaligned with fiscal-year funding. India’s 2026 shipment forecast fell from 15.9 million to 14.3 million units as the shortage overrode vibrant demand. Contract-based price locks partially hedged exposure but limited discount flexibility in competitive bids. Although foundry expansions are scheduled, geopolitical friction around semiconductor export controls sustains short-term uncertainty.
Extended Desktop Lifecycle Policies in Cost-Sensitive SMBs
Inflation and currency depreciation stretched desktop lifespans beyond five years in South America and Africa, postponing laptop migration. The Brazilian real slid 12% against the U.S. dollar, inflating import costs and widening the ownership gap between desktops and mobile PCs. Repair-service scarcity further tilts buyers toward keep-using-what-works logic. Cloud-based software lightens processing loads, making older hardware serviceable for email and spreadsheet tasks, so willingness to pay for premium mobility remains muted. As long as macro-economic headwinds persist, refresh budgets in small and medium businesses will lag enterprise demand by up to two years.
*Our forecasts treat driver/restraint impacts as directional, not additive. The impact forecasts reflect baseline growth, mix effects, and variable interactions.
Enterprise Laptop Market Segment Analysis
By Product Type:
Mobile Workstations Set the Premium PaceMobile workstations are projected to grow at a 7.55% CAGR through 2031, outstripping the broader enterprise laptop market. These platforms pair discrete GPUs pushing 672 tera-operations per second with 128 GB DDR5 memory, addressing engineering and healthcare imaging workloads that previously tethered users to fixed towers. Lenovo’s ThinkPad P Series illustrates how silicon-anode batteries now deliver 1,000 Wh L in sub-2 kg chassis, stacking run-time gains atop performance density. Traditional notebooks held 35.60% enterprise laptop market share in 2025, but commoditization erodes margins as integrated-graphics capability meets mainstream productivity needs. Ultrabooks win executive mindshare through sub-1 kg form factors and 15-hour batteries, while two-in-one convertibles capture stylus-oriented field tasks despite ongoing hinge durability debates. Rugged laptops retain loyal verticals willing to pay 30-50% premiums for MIL-STD-810H and IP65 credentials, and Chromebooks hold cost-optimized education and government footprints justified by total economic impact studies that cite USD 500 per-device savings.
Performance needs are no longer limited to graphics rendering. Microsoft Copilot+ specifies neural-processing-unit floors near 45 TOPS, steering workstation procurement toward AI-ready silicon.[2]Independent software vendor certifications from Autodesk and Siemens remain procurement gatekeepers, and EPEAT Gold plus ENERGY STAR 9.0 labels increasingly tip RFP scores in tight races. As more industries push simulation to the edge, the enterprise laptop market size tied to mobile workstations should continue outpacing the aggregate curve, albeit with component-price sensitivity due to premium bill-of-materials inputs.

By Operating System:
Chrome OS Carves a Growth NicheWindows preserved a 75.21% grip in 2025, anchored by Active Directory integration and legacy software stacks. Yet Chrome OS is expanding at an 8.15% CAGR as zero-ransomware track records and USD 500 per-device cost avoidance resonate with chief information officers. Korean Air, Wayfair, and Telus each scaled fleets above 10,000 units after Forrester calculated a 208% three-year ROI. Chrome OS Flex converts retired Windows boxes into secure endpoints, extending hardware life without capex. macOS remains a high-satisfaction niche, fortified by M4 battery-life gains and sub-1% failure rates reported by UCLA Health. Linux maintains relevance in software engineering and cybersecurity labs that value open kernels over commercial support.
Data-residency rules complicate homogeneous OS rollouts. Sixty-one percent of Western European CIOs pivoted toward sovereign clouds in 2025, requiring local management instances and adding compliance paperwork. As policy divergence grows, multi-OS endpoint management becomes table stakes, subtly lifting management overhead even as the enterprise laptop market benefits from diversified platform innovation.
By Organization Size:
Service-Based Financing Elevates SME UptakeLarge enterprises represented 63.45% of enterprise laptop market size in 2025, leveraging volume pricing and standardized images. Their multiyear leases and depreciation cycles create predictable demand but also lengthen decision gates. Small and medium enterprises, however, are forecast to advance at a 9.00% CAGR through 2031, riding PC-as-a-Service contracts that bundle hardware, security, and support into monthly operating lines. The model removes upfront sticker shock and simplifies lifecycle budgeting. SMEs in Asia-Pacific and South America gravitate toward balanced configurations—16 GB memory, 512 GB SSDs—while eschewing ultra-thin price premiums. Cloud SaaS adoption reduces local compute requirements, letting SMEs stretch refreshes until hardware fails rather than slows, yet an inflection is forming as AI workloads demand on-device inference even for small teams. Enterprises with 10,000-plus seats are piloting zero-trust stacks that embed hardware attestation, but SMEs value provider-managed security wrappers that de-risk limited in-house expertise.
By End-User Industry:
Healthcare Accelerates Mobile Digital CareInformation technology and telecommunications commanded 41.52% enterprise laptop market share in 2025, but healthcare and life sciences carry the strongest forward vector at a 6.74% CAGR. Electronic medical record rollouts and telemedicine require antimicrobial, fanless laptops that last an entire 12-hour shift. UCLA Health standardized on MacBook Air M4 and Dell Latitude Pro 16 Plus, citing field-failure rates under 1% and 20-40% longer batteries that reduce nurse handoffs for charging. Dynabook models report similar reliability, a non-negotiable in surgical theaters where downtime impairs clinical outcomes. Finance, meanwhile, invests in Trusted Platform Module 2.0 and firmware attestation to curb breach costs topping USD 6 million. Education segments migrate toward Chrome OS to trim help-desk tickets and ransomware exposure, whereas government procurement hinges on FIPS 140-3 and Common Criteria EAL 4+ compliance that many consumer SKUs lack.
By Screen Size:
Large Panels Meet Mobile Workstation NeedsPanels above 16 inches are projected to expand at an 8.50% CAGR, driven by engineers and content creators who desire desktop-like canvases without tethered monitors. Mini-LED and organic light-emitting diode technologies deliver high dynamic range, though command 15-25% premiums. The mainstream 14-to-16-inch group held 34.80% share in 2025, balancing carry weight with usable workspace. Below-12-inch devices cling to ultra-mobility and education niches but face price pressure from tablets sporting detachable keyboards. Bezel slimming and 3:2 aspect ratios now give 14-inch chassis the vertical pixels once reserved for 15-inch designs, blurring categorical lines. High-refresh 120 Hz screens appeal to traders and simulation engineers, and USB-C docks offset smaller internal displays by enabling dual external monitors at a single-cable desk setup, expanding enterprise laptop market adoption even where screen space is a daily pain point.
Geography Analysis
APAC Enterprise Laptop Market
Asia-Pacific anchors the growth trajectory, with the enterprise laptop market size in the region advancing at a projected 7.80% CAGR through 2031. India set a shipment record of 15.9 million notebooks in 2025 after hybrid work normalized, although memory shortages trimmed the 2026 outlook to 14.3 million units. Chinese production volumes crossed 35 million units for domestic demand and 67 million for export, reflecting contract manufacturer scale that feeds global brands. Southeast Asian countries such as Vietnam and Indonesia posted double-digit notebook growth alongside foreign direct investment in new manufacturing corridors.
North America and Europe Enterprise Laptop Market
North America maintained 34.20% share in 2025, buoyed by high per-capita IT budgets and stringent security rules that nudge buyers toward hardware-embedded protections. The Windows 10 support deadline forced budget pulls into a tight 18-month window, and CFOs embraced PC-as-a-Service to match payments with usage periods. Europe’s IT spend hit EUR 1.5 trillion (USD 1.59 trillion) in 2026, devices segment up 10.1% year-over-year, driven by sovereign cloud and generative AI rollouts. Yet data-sovereignty laws fragmented procurement, as compliance teams validated country-specific certifications before releasing purchase orders.
MEA and South America Enterprise Laptop Market
South America experienced a favorable trend in 2023, but currency depreciation complicated 2025-2026 laptop imports. Brazil’s government-backed AI notebook tenders illustrate latent demand despite macro strain.[3]Middle East and Africa IT spending climbed to USD 169 billion in 2026, with Gulf Cooperation Council initiatives driving sovereign-cloud deployments that in turn require locally managed laptop fleets. Overall, regional differences hinge on economic stability, regulatory posture, and domestic manufacturing incentives, but hybrid work and AI initiatives cut across borders as universal catalysts for enterprise laptop upgrades.
Competitive Landscape
Dell, HP, and Lenovo collectively command roughly 60-65% of global revenue, reflecting economies of scale in sourcing, global service networks, and PC-as-a-Service contracts that bundle financing with lifecycle support. Each vendor touts silicon-anode batteries that achieve 1,000 Wh L, Wi-Fi 7 radios capable of multi-band aggregation, and Trusted Platform Module 2.0 chips now mandatory for Windows 11. Lenovo and NVIDIA co-developed mobile workstations featuring RTX PRO Blackwell GPUs, shipping with Autodesk and Siemens certifications that eliminate driver uncertainty for design engineers. HP differentiates through TPM Guard tamper detection aligned to CISA supply-chain directives, appealing to defense and critical-infrastructure accounts.
Apple expands in enterprise via prolonged battery life and low failure rates of its M4 portfolio, attributes that clinched UCLA Health’s standardization. Chrome OS vendors, notably Google’s own Pixel line and Acer’s TravelMate P6, disrupt education and certain government deployments by boasting zero ransomware incidents and simplified central management. Rugged specialists Getac and Panasonic defend field-service and military segments underpinned by MIL-STD-810H and IP65 requirements that offset smaller volumes with 30-50% price premiums. With Microsoft Copilot+ setting new AI silicon baselines, competitors race to integrate neural-processing units exceeding 40 TOPS, staking future share on their ability to meet emerging AI workflows without sacrificing battery endurance or thermal headroom. Sustainability certifications such as EPEAT Gold and ENERGY STAR 9.0 increasingly serve as deal breakers in public tenders, further differentiating vendors that prioritize recycled materials and verified take-back schemes.
Enterprise Laptop Industry Leaders
-
Dell Inc.
-
HP Inc.
-
Lenovo Group Limited
-
Apple Inc.
-
ASUSTeK Computer Inc.
- *Disclaimer: Major Players sorted in no particular order
Enterprise Laptop Market Companies Covered in this Report
- Dell Inc.
- HP Inc.
- Lenovo Group Limited
- Apple Inc.
- ASUSTeK Computer Inc.
- Acer Inc.
- Samsung Electronics Co., Ltd.
- Microsoft Corporation
- LG Electronics Inc.
- Panasonic Holdings Corporation
- Dynabook Inc.
- Fujitsu Limited
- Micro-Star International Co., Ltd.
- Huawei Technologies Co., Ltd.
- Razer Inc.
- Getac Technology Corporation
- Clevo Co., Ltd.
- Tongfang Co., Ltd.
- Chuwi Innovation Limited
- Xiaomi Corporation
Recent Industry Developments in Enterprise Laptop Market
- April 2026: Dynabook earned ENERGY STAR 9.0 certification for Portégé X40, cutting energy use 30% and meeting European recyclability mandates.
- March 2026: Lenovo unveiled AI-ready ThinkPad P Series mobile workstations with RTX PRO Blackwell GPUs and silicon-anode batteries.
- January 2026: Dell began local assembly of AI servers in Hortolândia, Brazil, reducing import duties and lead times for Latin American clients.
- November 2025: Apple launched MacBook Pro with M4 Pro and M4 Max chips, enabling 24-hour enterprise workloads; UCLA Health adopted MacBook Air M4 fleetwide.
Global Enterprise Laptop Market Report Scope
The Enterprise Laptop Market features portable devices that organizations deploy for business across corporate, government, and institutional settings. This market encompasses business notebooks, ultrabooks, mobile workstations, rugged laptops, and enterprise-grade convertibles. Shaped by workforce mobility, security needs, device management, and hybrid work trends, procurement often involves large-scale purchases, long-term contracts, managed services, and stringent IT governance.
The Enterprise Laptop Market Report is Segmented by Product Type (Ultrabook, Notebook, 2-in-1 Convertible, Rugged Laptop, Mobile Workstation, and Chromebook), Operating System (Windows, macOS, Chrome OS, and Linux), Organization Size (Large Enterprises, and Small and Medium Enterprises), End-User Industry (Government and Public Sector, Education, Healthcare and Life Sciences, BFSI, IT and Telecom, and Other End-User Industries), Screen Size (Below 12 Inches, 12 to 14 Inches, 14 to 16 Inches, and Above 16 Inches), and Geography (North America, South America, Europe, Asia-Pacific, Middle East, and Africa). The Market Forecasts are Provided in Terms of Value (USD).
Segmentation Overview
| Ultrabook |
| Notebook |
| 2-in-1 Convertible |
| Rugged Laptop |
| Mobile Workstation |
| Chromebook |
| Windows |
| macOS |
| Chrome OS |
| Linux |
| Large Enterprises |
| Small and Medium Enterprises |
| Government and Public Sector |
| Education |
| Healthcare and Life Sciences |
| BFSI |
| IT and Telecom |
| Other End-User Industries |
| Below 12 Inches |
| 12 to 14 Inches |
| 14 to 16 Inches |
| Above 16 Inches |
| North America | United States |
| Canada | |
| Mexico | |
| South America | Brazil |
| Argentina | |
| Rest of South America | |
| Europe | Germany |
| France | |
| United Kingdom | |
| Italy | |
| Spain | |
| Russia | |
| Rest of Europe | |
| Asia-Pacific | China |
| Japan | |
| India | |
| South Korea | |
| Australia and New Zealand | |
| Rest of Asia-Pacific | |
| Middle East | Saudi Arabia |
| United Arab Emirates | |
| Turkey | |
| Rest of Middle East | |
| Africa | South Africa |
| Nigeria | |
| Rest of Africa |
| By Product Type | Ultrabook | |
| Notebook | ||
| 2-in-1 Convertible | ||
| Rugged Laptop | ||
| Mobile Workstation | ||
| Chromebook | ||
| By Operating System | Windows | |
| macOS | ||
| Chrome OS | ||
| Linux | ||
| By Organization Size | Large Enterprises | |
| Small and Medium Enterprises | ||
| By End-User Industry | Government and Public Sector | |
| Education | ||
| Healthcare and Life Sciences | ||
| BFSI | ||
| IT and Telecom | ||
| Other End-User Industries | ||
| By Screen Size | Below 12 Inches | |
| 12 to 14 Inches | ||
| 14 to 16 Inches | ||
| Above 16 Inches | ||
| By Geography | North America | United States |
| Canada | ||
| Mexico | ||
| South America | Brazil | |
| Argentina | ||
| Rest of South America | ||
| Europe | Germany | |
| France | ||
| United Kingdom | ||
| Italy | ||
| Spain | ||
| Russia | ||
| Rest of Europe | ||
| Asia-Pacific | China | |
| Japan | ||
| India | ||
| South Korea | ||
| Australia and New Zealand | ||
| Rest of Asia-Pacific | ||
| Middle East | Saudi Arabia | |
| United Arab Emirates | ||
| Turkey | ||
| Rest of Middle East | ||
| Africa | South Africa | |
| Nigeria | ||
| Rest of Africa | ||
Key Questions Answered in the Report
What is the current enterprise laptop market size and projected growth?
The enterprise laptop market size stands at USD 113.45 billion in 2026 and is forecast to reach USD 149.47 billion by 2031, reflecting a CAGR of 5.67%.
Which region will grow the fastest through 2031?
Asia-Pacific is expected to record the highest CAGR at 7.80%, buoyed by India’s expanding notebook demand and manufacturing scale-ups across Southeast Asia.
Why are enterprises accelerating refresh cycles after 2025?
Microsoft’s Windows 10 end-of-support increased extended security costs and, combined with hybrid-work demands, pulled hardware replacements into an 18-month window.
How are sustainability mandates shaping procurement?
ENERGY STAR 9.0, EPEAT Gold, and Europe’s Ecodesign Regulation now factor into most RFPs, pushing buyers toward energy-efficient, recyclable laptops while favoring vendors offering carbon-neutral shipping.
Which operating system shows the highest growth potential?
Chrome OS leads in growth at an 8.15% CAGR through 2031, driven by documented USD 500 per-device savings and a 208% ROI over three years.