Energy Cloud Market Size and Share
Market Overview
| Study Period | 2019 - 2030 |
|---|---|
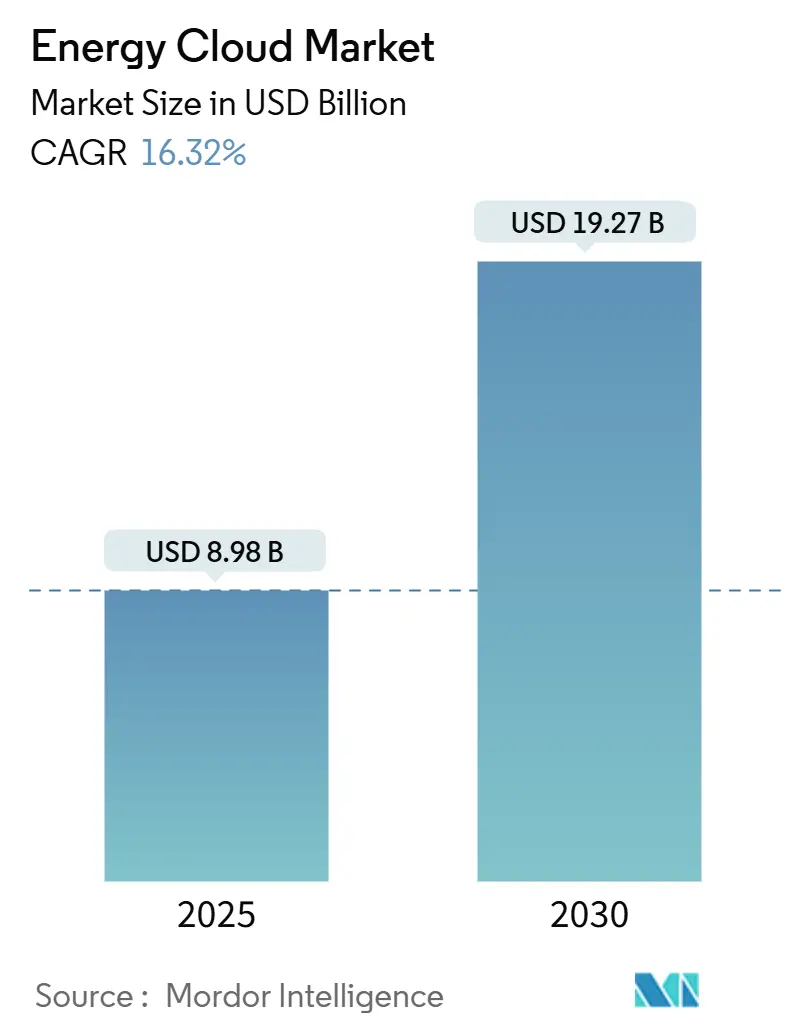
| Market Size (2025) | USD 8.98 Billion |
| Market Size (2030) | USD 19.27 Billion |
| Growth Rate (2025 - 2030) | 16.32% CAGR |
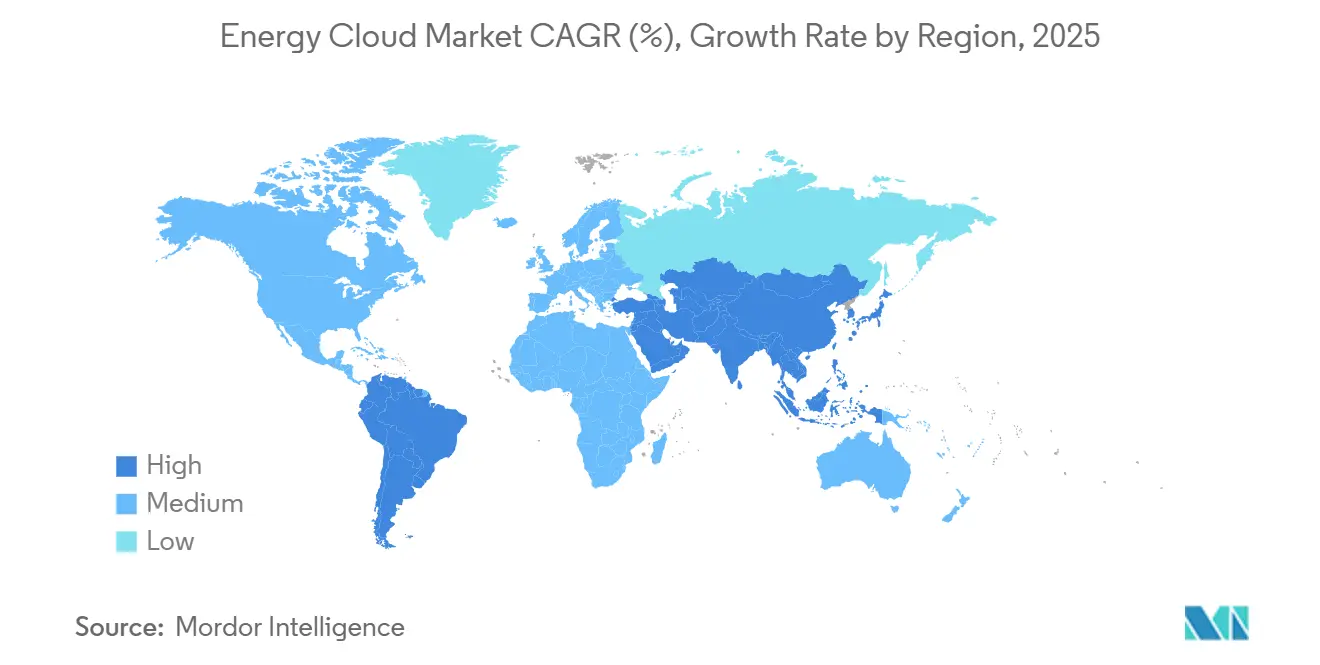
| Fastest Growing Market | Asia Pacific |
| Largest Market | North America |
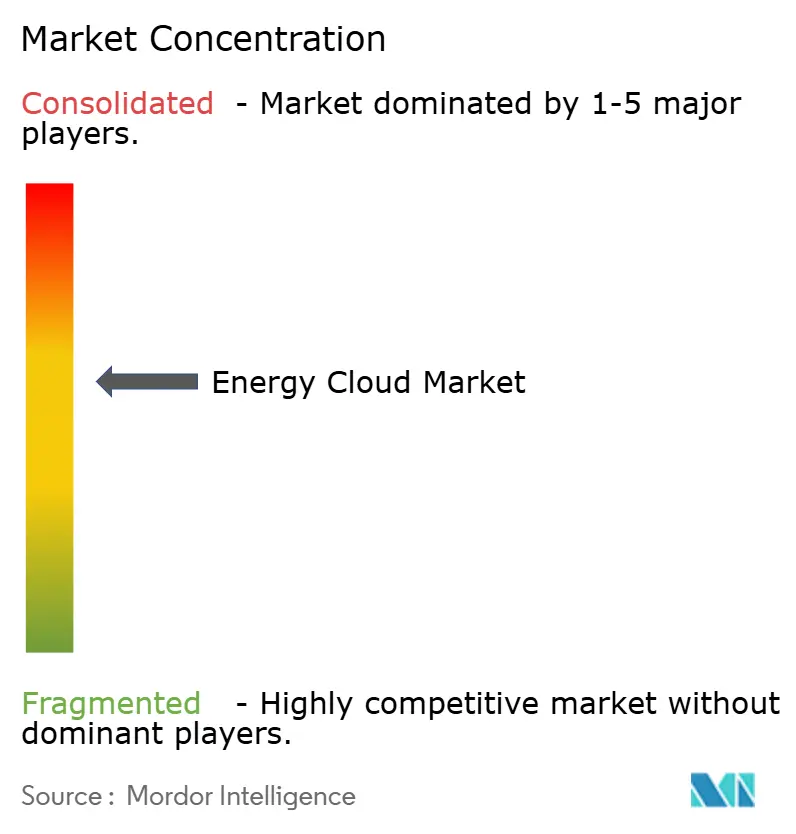
| Market Concentration | Medium |
Major Players *Disclaimer: Major Players sorted in no particular order Image © Mordor Intelligence. Reuse requires attribution under CC BY 4.0. | |
Energy Cloud Market Analysis by Mordor Intelligence
The energy cloud market size stands at USD 8.98 billion in 2025 and is projected to reach USD 19.27 billion by 2030, reflecting a CAGR of 16.32%. Rapid smart-grid rollouts, cloud cost advantages, and regulatory demands for net-zero compliance underpin this expansion. Utilities and renewable generators are deploying cloud platforms to orchestrate real-time grid operations, predictive maintenance, and customer engagement services. Edge devices across distributed energy resources and electric-vehicle chargers are generating unprecedented data volumes, accelerating demand for scalable analytics in the energy cloud market. Meanwhile, sector-specific generative-AI accelerators and hybrid deployment models are broadening the competitive landscape, enabling vendors to align digital capabilities with complex operational and regulatory requirements.
Key Report Takeaways
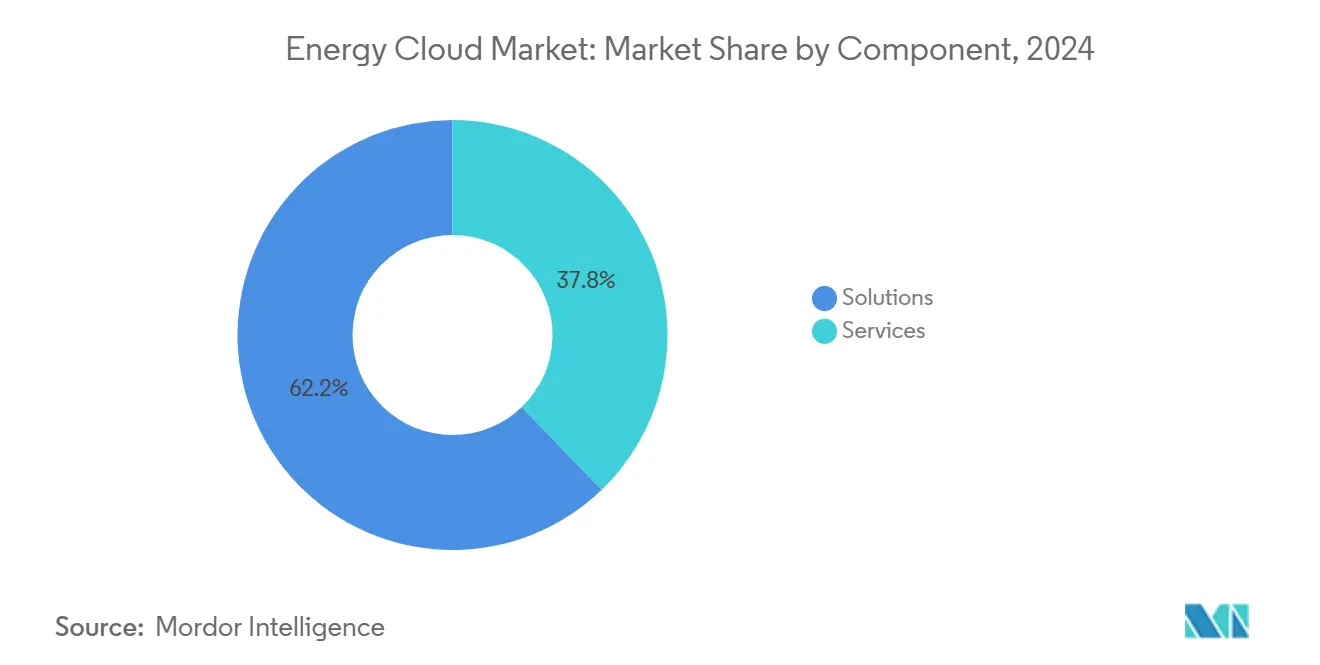
- By component, solutions accounted for 62.2% of the energy cloud market share in 2024; services are advancing at a 17.1% CAGR through 2030.
- By deployment model, the public-cloud segment led with 47.0% revenue share in 2024, whereas hybrid cloud is forecast to expand at a 17.5% CAGR to 2030.
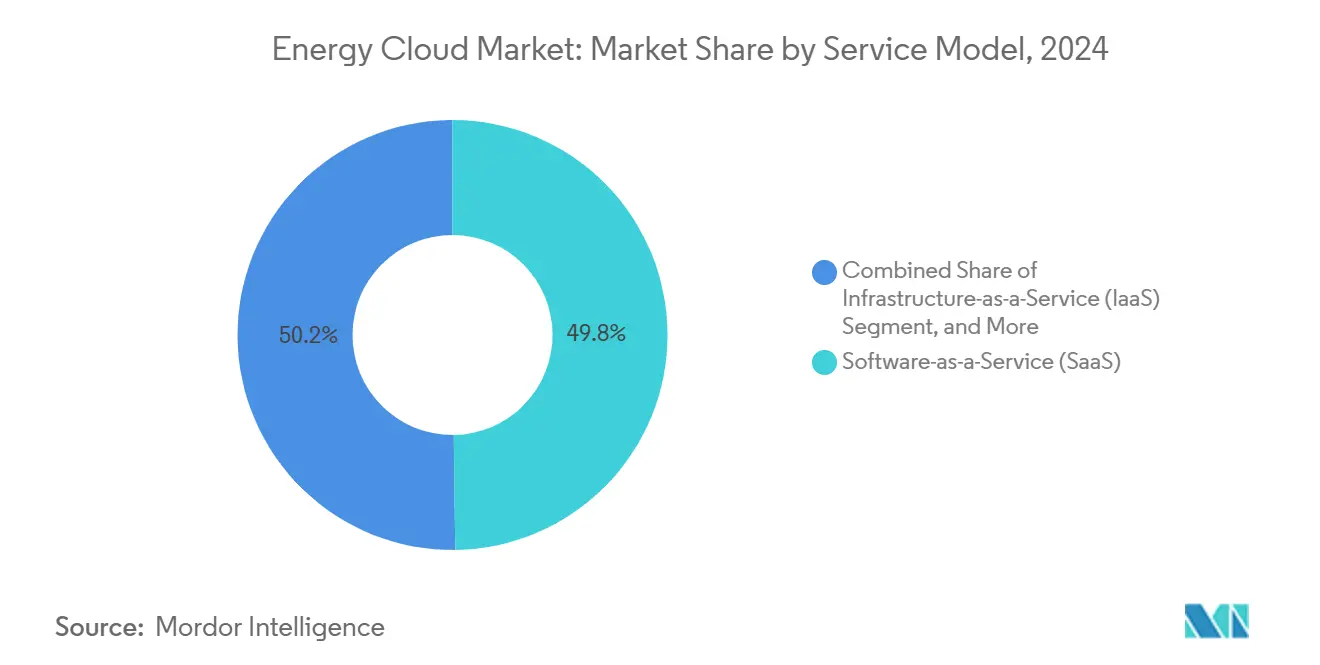
- By service model, software-as-a-service held 49.8% of the energy cloud market size in 2024; platform-as-a-service is set to grow at an 18.0% CAGR over the same horizon.
- By end-user industry, electric utilities captured 42.1% of the energy cloud market size in 2024, while renewable power producers are projected to post an 18.5% CAGR through 2030.
- By geography, the North America segment led with 39.8% revenue share in 2024, whereas the Asia-Pacific is forecast to expand at a 17.8% CAGR to 2030.
Note: Market size and forecast figures in this report are generated using Mordor Intelligence’s proprietary estimation framework, updated with the latest available data and insights as of January 2026.
Global Energy Cloud Market Trends and Insights
Drivers Impact Analysis*
| Driver | (~) % Impact on CAGR Forecast | Geographic Relevance | Impact Timeline |
|---|---|---|---|
| Rapid roll-out of smart grids and AMI | +2.8% | Global, with Asia-Pacific leading deployment | Medium term (2-4 years) |
| Cloud cost advantages vs. on-prem IT in utilities | +2.1% | North America and Europe primary | Short term (≤ 2 years) |
| Regulatory push for data transparency and net-zero | +1.9% | Global, EU and North America leading | Long term (≥ 4 years) |
| Utilities' shift to X-as-a-Service revenue models | +1.6% | Developed markets initially | Medium term (2-4 years) |
| Explosion of edge data from DER and EV charging | +2.3% | Global, urban centers first | Medium term (2-4 years) |
| Emergence of sector-specific GenAI accelerators | +1.4% | North America and Europe early adoption | Long term (≥ 4 years) |
| Source: Mordor Intelligence | |||
Rapid Roll-out of Smart Grids and Advanced Metering Infrastructure
Smart-grid and AMI deployments are the strongest catalysts for the energy cloud market. Utilities in Asia-Pacific are moving from basic digital meters to AMI 2.0 networks that embed edge computing for real-time asset visibility, creating vast data flows that must be processed in the cloud. Vendors such as Honeywell now integrate 5G to push sub-second meter data into analytics engines [1]Honeywell Press Office, “Honeywell Modernizes Energy Grid and Utility Management With Verizon 5G Connectivity,” honeywell.com. These implementations extend beyond meter-data management toward unified digital-utility platforms covering asset health, outage management, and customer portals. As national energy-transition programs escalate renewable and storage penetration, the need for cloud-based orchestration of intermittent resources intensifies, reinforcing this growth driver.
Cloud Cost Advantages Versus On-Premises IT in Utilities
Utilities adopting cloud architectures are recording steep reductions in capital expenditure. Cost benefits span infrastructure, operations, and ongoing upgrades, allowing smaller utilities to tap enterprise-grade capabilities without costly hardware refreshes. The economics are especially compelling when modernizing SAP or similar enterprise applications. Hybrid-cloud frameworks are emerging to balance savings with sovereignty and compliance obligations, ensuring that sensitive operational data remains under strict control while analytics workloads shift to scalable public clouds.
Regulatory Push for Data Transparency and Net-Zero Commitments
Rules such as NERC CIP-015-1 that require continuous network visibility, and Europe’s GDPR and decarbonization mandates, are accelerating adoption of cloud-native compliance platforms [2]Nozomi Research Team, “Preparing for NERC CIP-015-1: Internal Network Security Monitoring for Electric Utilities,” nozominetworks.com. Cloud providers offer automated auditing, encryption, and granular access controls that ease evidence gathering for regulators. Inverter-based resource standards outlined in FERC Order 901 further elevate monitoring requirements, steering utilities toward elastic cloud services capable of tracking new data points in near real time. The result is sustained long-term demand for secure, auditable, and update-friendly energy cloud market solutions.
Utilities’ Shift to Everything-as-a-Service Revenue Models
Utilities are turning infrastructure investments into recurring revenue streams by offering bundled services that span electric-vehicle charging, rooftop solar, and home-energy management. Greece’s Public Power Corporation achieved an 80% uplift in renewables capacity while rolling out digital products that rely on cloud-native billing, CRM, and analytics layers. Platforms that enable multi-tenant monetization, dynamic pricing, and rapid service innovation are becoming essential. This shift alters competitive dynamics, placing traditional utilities in direct competition with technology firms and start-ups and reinforcing demand for adaptable cloud stacks.
Restraints Impact Analysis*
| Restraint | (~) % Impact on CAGR Forecast | Geographic Relevance | Impact Timeline |
|---|---|---|---|
| Legacy OT/IT integration complexity | -1.8% | Global, mature markets most affected | Medium term (2-4 years) |
| Cyber-security and data-sovereignty concerns | -2.1% | Global, heightened in critical infrastructure | Long term (≥ 4 years) |
| Cloud-skills talent gap inside utilities | -1.3% | Developed markets primarily | Short term (≤ 2 years) |
| Volatile cloud-compute pricing for AI workloads | -0.9% | Global, AI-intensive applications | Medium term (2-4 years) |
| Source: Mordor Intelligence | |||
Legacy Operational-Technology and IT Integration Complexity
Many power-generation and transmission assets run proprietary control systems that lack modern APIs. Integrating these with cloud platforms entails custom middleware, phased migration, and substantial testing to avoid downtime. Utilities often split projects into low-risk pilots, extending timelines and budgets. Edge gateways that translate legacy protocols to secure IP traffic are mitigating barriers, yet the intricacy of real-time control integration remains a brake on the energy cloud market expansion.
Cyber-Security and Data-Sovereignty Concerns
The energy sector is classified as critical infrastructure, subject to strict regulations that restrict off-premises data handling. Certain NERC CIP provisions effectively keep high-impact bulk-electric-system data out of public-cloud environments, unless controls are rigorously proven. Cross-border data storage introduces additional legal exposure, particularly in multi-jurisdiction grids [3]ISACA Editorial, “Cloud Data Sovereignty: Governance and Risk Implications of Cross-Border Cloud Storage,” isaca.org. While cloud providers have built sector-specific compliance blueprints, many utilities adopt hybrid architectures and dedicated sovereign regions to reduce perceived risk, slowing universal adoption.
*Our forecasts treat driver/restraint impacts as directional, not additive. The impact forecasts reflect baseline growth, mix effects, and variable interactions.
Segment Analysis
By Component: Solutions Drive Core Digitization, Services Accelerate Implementation
Solutions held 62.2% of the energy cloud market share in 2024, underscoring utilities’ need for integrated platforms that manage assets, customers, and market participation. The category spans meter-data management, DER orchestration, and digital-twin applications that decrease outage minutes and improve renewable dispatch. Services are growing faster at 17.1% CAGR as utilities seek implementation support, cyber-security hardening, and managed operations. Demand for legacy-system migration and compliance mapping fuels consulting and integration engagements, with vendors bundling lifecycle services into subscriptions.
A rising services-led approach aligns with workforce realities: 70% of energy executives are prioritizing cloud and AI reskilling programs, amplifying the value of expert partners. Managed service agreements lower technology-refresh risk and keep platforms current with evolving regulations. As more utilities outsource platform administration, vendors are embedding AI-guided support and automated governance to scale quality. This interplay keeps both components strategically indispensable to the energy cloud market.


By Deployment Model: Hybrid Cloud Emerges as the Pragmatic Path
Although public cloud controlled 47.0% revenue in 2024, hybrid models are climbing at a 17.5% CAGR, allowing utilities to segregate critical SCADA data while leveraging scalable analytics for non-critical workloads. Hybrid architecture unites on-premises or private-cloud resources with public environments via secure APIs, enabling dynamic workload placement based on latency, compliance, or cost. Utilities are increasingly adopting multi-cloud orchestration tools to avoid vendor lock-in and optimize performance.
Private cloud remains necessary for the most sensitive data, yet its growth is tempered by infrastructure overhead. Edge-computing nodes embedded at substations feed low-latency control loops, with summary data funneled to central clouds for fleet-wide optimization. This layered topology supports high availability and sovereignty, reinforcing hybrid as the mainstream trajectory for the energy cloud market.
By Service Model: Platform-as-a-Service Spurs Customized Innovation
Software-as-a-Service retained 49.8% of total revenue in 2024, capitalizing on utilities’ preference for turnkey billing, outage, and customer apps. However, platform-as-a-service is delivering the fastest 18.0% CAGR, giving energy companies a canvas to build bespoke solutions atop cloud-native micro-services without managing underlying infrastructure. Energy Platform-as-a-Service offerings integrate DER management, energy-trading modules, and AI toolkits, streamlining development cycles.
Infrastructure-as-a-Service persists for workloads that demand fine-grained control or specialized hardware such as GPUs for AI inference. Utilities are adopting layered strategies, combining SaaS for commoditized functions, PaaS for differentiation, and IaaS for high-performance niche tasks, creating an interwoven model that fosters flexibility and continuous innovation in the energy cloud market.

By End-User Industry: Utilities Lead, Renewables Expand Rapidly
Electric utilities commanded 42.1% of revenue in 2024, driven by multi-year grid-modernization mandates, outage-reduction targets, and evolving customer-experience expectations. Utilities rely on cloud analytics to balance distributed solar, storage, and demand response resources in real time, ensuring reliability. Meanwhile, renewable-power producers register the strongest 18.5% CAGR, leveraging cloud platforms for asset-performance analytics, market bidding, and integrated forecasting.
Oil and gas firms are harnessing cloud-driven digital twins to streamline upstream operations and curb emissions, while industrial and manufacturing players employ demand-side management modules to shave peak loads and optimize tariffs. Commercial and residential aggregators are emerging as a pivotal segment as virtual-power-plant models scale. Collectively, these trends diversify demand for vectors and broaden the scope of the energy cloud market.
Geography Analysis
North America led with a 39.8% revenue share in 2024, propelled by sophisticated digital infrastructure and supportive regulatory regimes. Utilities are executing end-to-end cloud migrations, exemplified by New York Power Authority’s unified asset-management platform that underpins its VISION2030 roadmap [4]IBM Case Study Team, “New York Power Authority: VISION2030,” ibm.com. Virtual power-plant rollouts across multiple independent system operators further fuel service uptake, as thermostats and behind-the-meter batteries participate in demand response programs.
Asia-Pacific is the fastest-growing region, posting a 17.8% CAGR through 2030. China is infusing AI into gas-distribution and storage operations, while Southeast Asia’s forecast 45% demand rise between 2023 and 2050 triggers large-scale smart-meter and IoT deployments. Massive renewables investments, topping USD 1.6 trillion over the next decade, reinforce the need for cloud-native asset-performance and energy-trading platforms, accelerating energy cloud market adoption.
Europe maintains a robust position anchored by progressive sustainability statutes and data-sovereignty initiatives. Programs such as Gaia-X and the European Energy Data Space are nurturing interoperable cloud frameworks, while utilities like EDF migrate core workloads to AWS-aligned environments to improve agility and support net-zero strategies. Investments in public-service digitalization bolster regional momentum, even as strict privacy rules encourage hybrid and sovereign-cloud deployments that meet GDPR and national-security requirements.

Competitive Landscape
The energy cloud market is moderately consolidated yet intensely innovative. Amazon Web Services leverages its infrastructure scale and partnerships with GE Vernova to embed asset-performance analytics across utility fleets. Microsoft capitalizes on enterprise relationships to integrate Azure with incumbent SAP landscapes, easing modernization. Google Cloud differentiates through specialized AI and ML toolsets that help utilities forecast load and optimize renewable dispatch.
Traditional equipment suppliers are repositioning as platform orchestrators. Hitachi Energy collaborates with AWS to deliver AI-based vegetation-management systems that pre-empt outages. Schneider Electric’s Zeigo Hub supports supply-chain decarbonization and grid-edge intelligence, co-developed with partners such as Itron [5] Itron Communications, “Itron and Schneider Electric Collaborate to Tackle Grid Complexity,” itron.com. Cybersecurity specialists and integration firms capture expanding service revenues by bridging legacy OT environments with cloud platforms, ensuring compliance and resilience.
Start-ups play a catalytic role in niche domains. CPower dominates commercial and industrial virtual power-plant aggregation, providing flexible capacity to system operators. Software vendors focused on DER orchestration, energy trading, and AI-driven forecasting attract venture capital, enriching the ecosystem. Strategic alliances, acquisitions, and co-innovation programs define competitive moves, ensuring platform capabilities keep pace with sector-specific demands and regulations.
Energy Cloud Industry Leaders
IBM Corporation
SAP SE
Microsoft Corporation
Google LLC (Alphabet, Inc.)
Amazon.com, Inc.
- *Disclaimer: Major Players sorted in no particular order

Recent Industry Developments
- March 2025: Hitachi Energy entered a multi-year collaboration with AWS to accelerate cloud-enabled innovation, debuting AI vegetation-management solutions.
- January 2025: Schneider Electric introduced the Zeigo Hub cloud platform to help companies track and cut supply-chain emissions.
- January 2025: GE Vernova confirmed its acquisition of Alteia to deepen AI-powered analytics for utilities, expanding its cloud-based digital-grid portfolio.
- December 2024: Infosys partnered with RheinEnergie to drive energy-savings programs via the Infosys Energy Cloud platform.


Global Energy Cloud Market Report Scope
| Solutions |
| Services |
| Public Cloud |
| Private Cloud |
| Hybrid Cloud |
| Infrastructure-as-a-Service (IaaS) |
| Platform-as-a-Service (PaaS) |
| Software-as-a-Service (SaaS) |
| Electric Utilities |
| Renewable Power Producers |
| Oil and Gas Companies |
| Industrial and Manufacturing |
| Commercial and Residential Aggregators |
| North America | United States | |
| Canada | ||
| Mexico | ||
| South America | Brazil | |
| Argentina | ||
| Rest of South America | ||
| Europe | Germany | |
| United Kingdom | ||
| France | ||
| Italy | ||
| Spain | ||
| Russia | ||
| Rest of Europe | ||
| Asia-Pacific | China | |
| Japan | ||
| India | ||
| South Korea | ||
| Australia and New Zealand | ||
| Rest of Asia-Pacific | ||
| Middle East and Africa | Middle East | Saudi Arabia |
| United Arab Emirates | ||
| Turkey | ||
| Rest of Middle East | ||
| Africa | South Africa | |
| Nigeria | ||
| Egypt | ||
| Rest of Africa | ||
| By Component | Solutions | ||
| Services | |||
| By Deployment Model | Public Cloud | ||
| Private Cloud | |||
| Hybrid Cloud | |||
| By Service Model | Infrastructure-as-a-Service (IaaS) | ||
| Platform-as-a-Service (PaaS) | |||
| Software-as-a-Service (SaaS) | |||
| By End-User Industry | Electric Utilities | ||
| Renewable Power Producers | |||
| Oil and Gas Companies | |||
| Industrial and Manufacturing | |||
| Commercial and Residential Aggregators | |||
| By Geography | North America | United States | |
| Canada | |||
| Mexico | |||
| South America | Brazil | ||
| Argentina | |||
| Rest of South America | |||
| Europe | Germany | ||
| United Kingdom | |||
| France | |||
| Italy | |||
| Spain | |||
| Russia | |||
| Rest of Europe | |||
| Asia-Pacific | China | ||
| Japan | |||
| India | |||
| South Korea | |||
| Australia and New Zealand | |||
| Rest of Asia-Pacific | |||
| Middle East and Africa | Middle East | Saudi Arabia | |
| United Arab Emirates | |||
| Turkey | |||
| Rest of Middle East | |||
| Africa | South Africa | ||
| Nigeria | |||
| Egypt | |||
| Rest of Africa | |||


Key Questions Answered in the Report
What is the current energy cloud market size and growth outlook?
The energy cloud market size is USD 8.98 billion in 2025 and is forecast to reach USD 19.27 billion by 2030, supported by a 16.32% CAGR.
Which component segment leads the energy cloud market?
Solutions lead, holding 62.2% revenue share in 2024, driven by integrated platforms for grid, asset, and customer management.
Why are hybrid-cloud models gaining traction in the energy sector?
Hybrid architecture lets utilities keep sensitive operational data on-premises while using public-cloud analytics, balancing sovereignty, cost, and scalability.
Which end-user group is expected to grow fastest?
Renewable-power producers are projected to expand at an 18.5% CAGR through 2030 as they adopt cloud platforms for asset optimization and trading.
Page last updated on:


