Endoscopy Visualization Systems Market Size and Share
Market Overview
| Study Period | 2020 - 2031 |
|---|---|
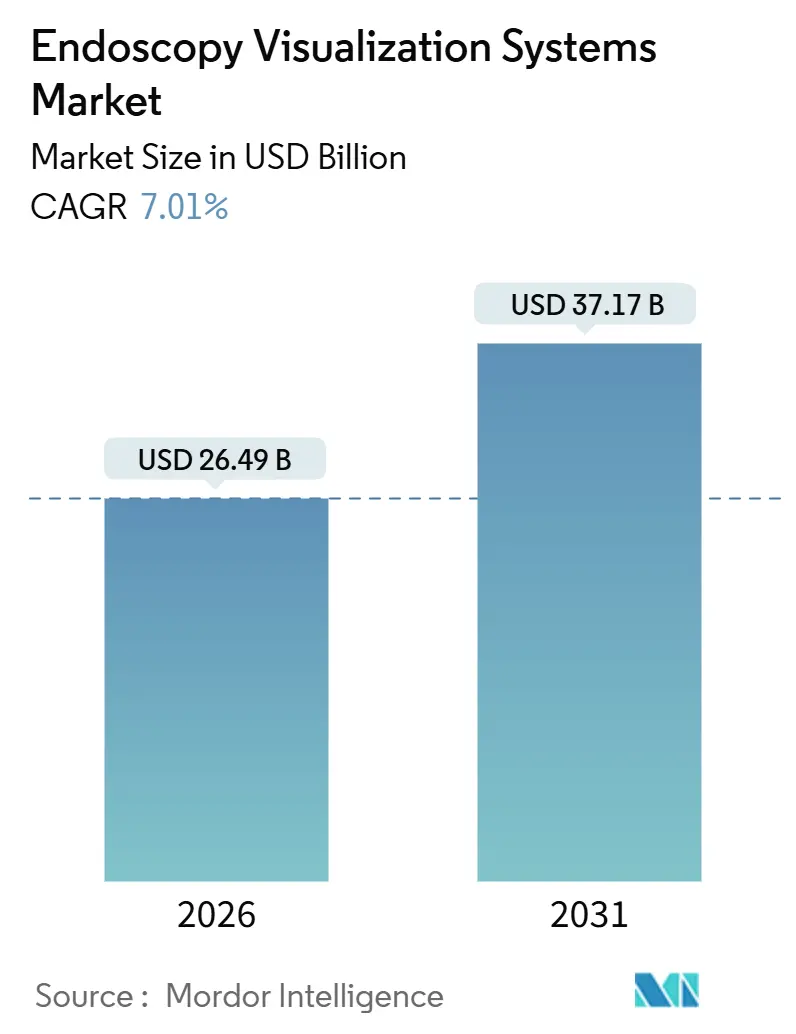
| Market Size (2026) | USD 26.49 Billion |
| Market Size (2031) | USD 37.17 Billion |
| Growth Rate (2026 - 2031) | 7.01% CAGR |
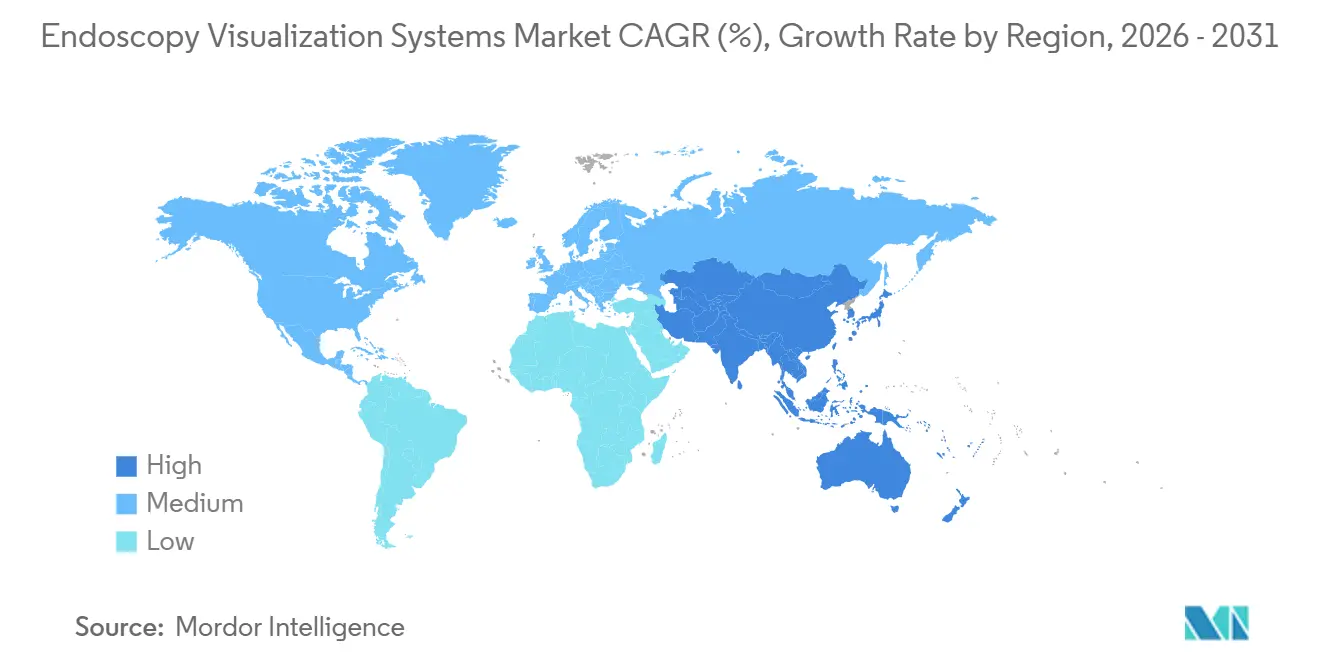
| Fastest Growing Market | Asia Pacific |
| Largest Market | North America |
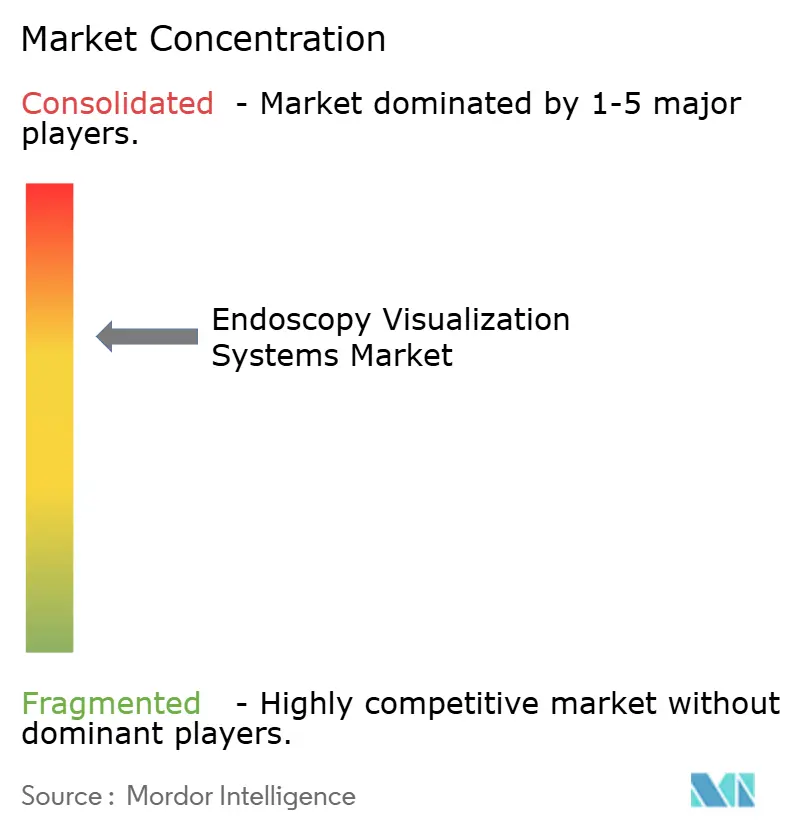
| Market Concentration | Medium |
Major Players *Disclaimer: Major Players sorted in no particular order Image © Mordor Intelligence. Reuse requires attribution under CC BY 4.0. | |
Endoscopy Visualization Systems Market Analysis by Mordor Intelligence
The Endoscopy Visualization Systems Market size is estimated at USD 26.49 billion in 2026, and is expected to reach USD 37.17 billion by 2031, at a CAGR of 7.01% during the forecast period (2026-2031).
Growth is propelled by rising incidence of gastrointestinal and respiratory diseases, wider adoption of minimally invasive care pathways, and the rapid infusion of artificial intelligence into imaging workflows. Hospitals continued to generate most revenue, yet ambulatory centers captured share as payers pressed for lower-cost outpatient models. High-definition platforms remained the incumbent standard, but 4K and AI-enabled systems advanced fastest as clinicians demanded sharper tissue differentiation and automated polyp detection. North America contributed the largest regional revenue, while Asia-Pacific recorded the strongest growth, driven by large-scale health infrastructure programs in Japan, China, and India.
Key Report Takeaways
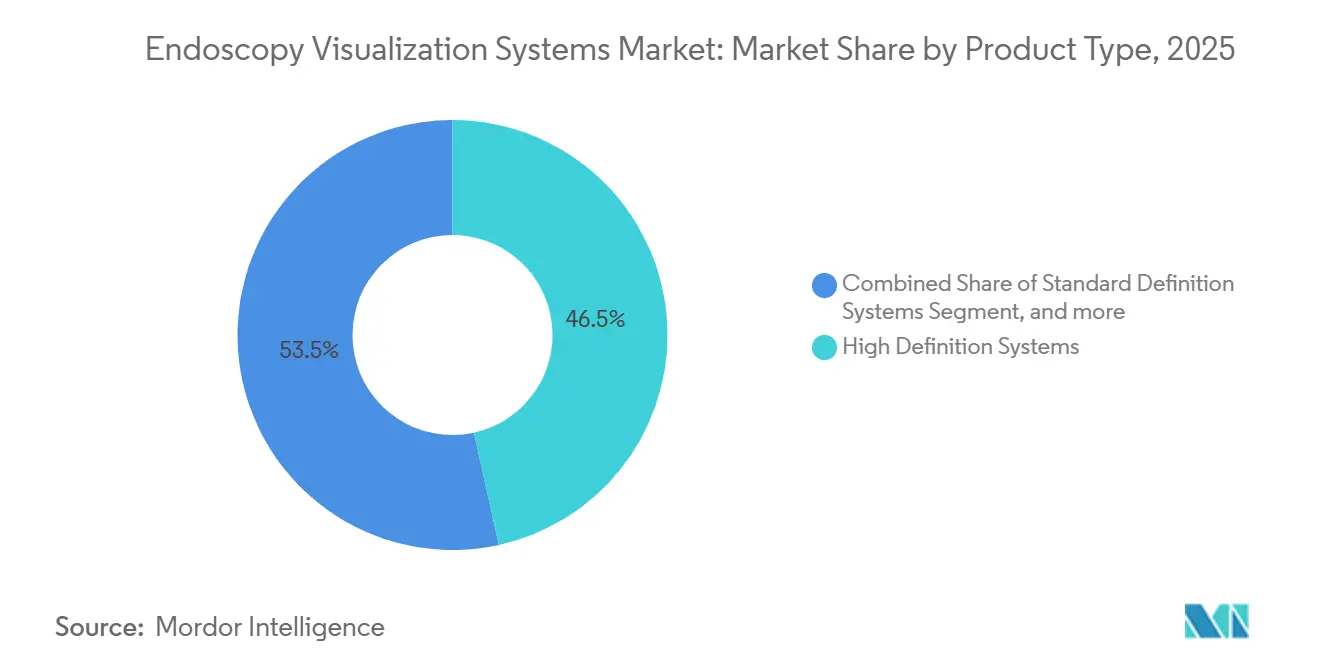
- By product type, high-definition systems captured 46.54% of revenue in 2025, while AI-enabled platforms are forecast to grow at 9.54% CAGR through 2031.
- By end user, hospitals accounted for 58.65% of revenue share in 2025, yet ambulatory surgery centers are projected to expand at a 10.32% CAGR through 2031.
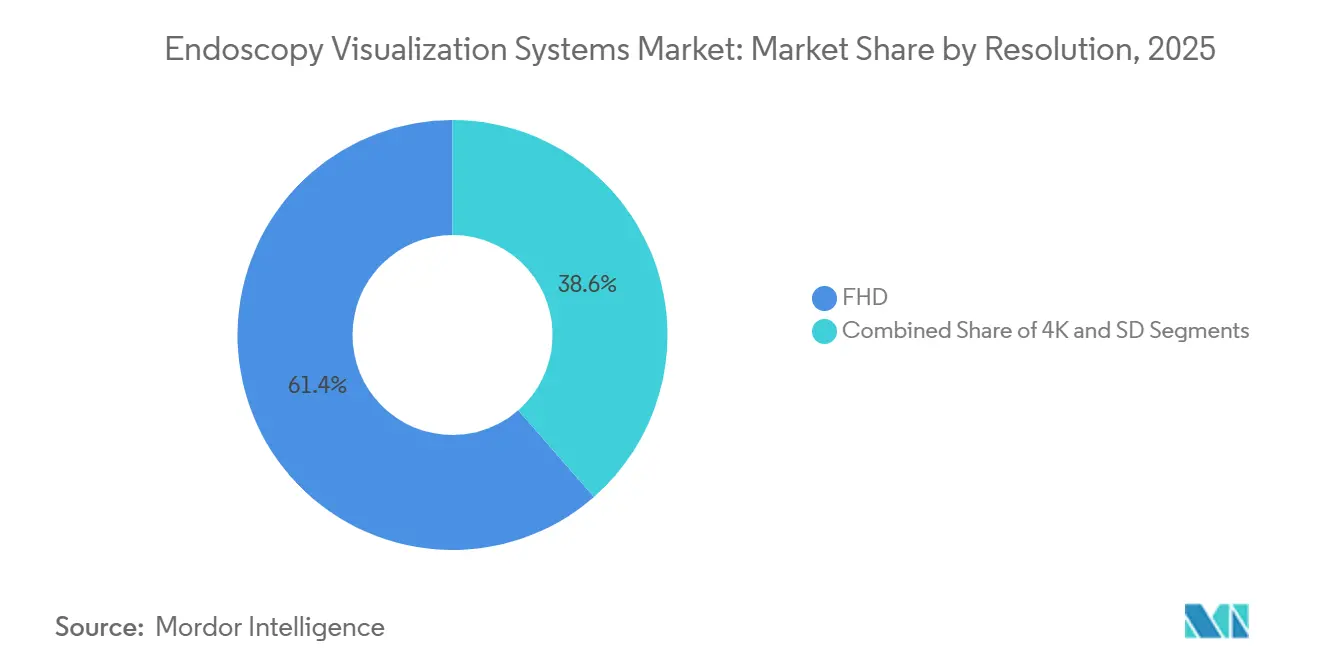
- By resolution, full HD accounted for 61.43% of installed units in 2025, whereas 4K systems are poised to rise at 9.65% CAGR.
- By technology, 2D imaging retained 64.67% share in 2025 and AI-assisted imaging will climb at 10.11% CAGR through 2031.
- By geography, North America commanded 43.45% of 2025 revenue, while Asia-Pacific is expected to advance at 8.43% CAGR to 2031.
Note: Market size and forecast figures in this report are generated using Mordor Intelligence’s proprietary estimation framework, updated with the latest available data and insights as of January 2026.
Global Endoscopy Visualization Systems Market Trends and Insights
Drivers Impact Analysis*
| Driver | (~) % Impact on CAGR Forecast | Geographic Relevance | Impact Timeline |
|---|---|---|---|
| Rising Burden of Digestive and Respiratory Disorders | +1.3% | Global, strongest in North America and Europe | Long term (≥ 4 years) |
| Growing Preference for Minimally Invasive Procedures | +1.5% | North America, Europe, Asia-Pacific | Medium term (2-4 years) |
| Continuous Advancements in Endoscopic Imaging Technologies | +1.4% | Global, early gains in North America and Japan | Medium term (2-4 years) |
| Expansion of Healthcare Infrastructure and Expenditure | +1.2% | Asia-Pacific core, extending to Middle East and South America | Long term (≥ 4 years) |
| Increasing Adoption of Single-Use Visualization Solutions | +0.9% | North America and Europe, emerging in Asia-Pacific | Short term (≤ 2 years) |
| Integration of Artificial Intelligence and Cloud Analytics | +1.1% | North America, Europe, Japan | Medium term (2-4 years) |
| Source: Mordor Intelligence | |||
Rising Burden of Digestive and Respiratory Disorders
Colorectal cancer screening guidelines in the United States moved the starting age from 50 to 45, instantly enlarging the screening cohort and lifting procedure volumes[1]American Cancer Society, “Colorectal Cancer Screening Guidelines,” cancer.org. Chronic lower respiratory diseases held their position as the sixth leading cause of U.S. deaths in 2024, sustaining demand for diagnostic and therapeutic bronchoscopy. Incidence of inflammatory bowel disease in Japan and South Korea approached Western rates, raising long-term demand for colonoscopic surveillance. Gastroesophageal reflux disease affects around 20% of adults in developed economies, underscoring the need for upper endoscopy for Barrett’s esophagus monitoring. Public-health screening campaigns for Helicobacter pylori in China and India boosted endoscopy utilization, particularly in tier-2 cities where installed capacity lagged.
Growing Preference for Minimally Invasive Procedures
Ambulatory centers in the United States performed 28 million procedures in 2024 and benefited from a 2.9% CMS payment increase for 2025 services. Robotic-assisted surgery cases grew 15% year over year, and flexible endoscopy platforms began incorporating robotic steering to replicate laparoscopic precision. Single-incision and natural-orifice trials demonstrated feasibility for cholecystectomy and appendectomy, pushing vendors toward slimmer 4K scopes with articulating tips. Enhanced-recovery programs mandated same-day discharge for many gastrointestinal interventions, placing a premium value on AI-based polyp-detection modules that reduce miss rates. The European Society of Gastrointestinal Endoscopy issued 2025 guidelines endorsing AI for colonoscopy quality assurance, accelerating capital purchase cycles[2]European Society of Gastrointestinal Endoscopy, “AI-Supported Colonoscopy Guidelines 2025,” esge.eu.
Continuous Advancements in Endoscopic Imaging Technologies
Olympus introduced the EVIS X1 system in 2024, featuring extended depth-of-field optics that maintain sharp focus over a broader working distance. Fujifilm’s CAD EYE, Medtronic’s GI Genius, and Olympus’s CADDIE all gained FDA clearance and improved adenoma detection rates by roughly 13–14 percentage points. Eight-kilopixel prototypes entered feasibility studies in Japan, though bandwidth and monitor costs still impede commercialization. Boston Scientific’s SpyGlass DS Elite, cleared in 2024, widened its working channel and upgraded irrigation to sharpen visualization during cholangioscopy. Stryker blended native 4K capture with HDR processing, helping surgeons detect subtle mucosal changes under narrow-band imaging in early gastric cancer programs.
Expansion of Healthcare Infrastructure and Expenditure
India set a target to grow its medtech market from USD 12 billion in 2024 to USD 50 billion by 2030, with endoscopy equipment a priority import segment. Japan’s medical device market hit USD 32.6 billion in 2024 and is advancing at 4.4% CAGR through 2029 on the back of an aging population. China’s Healthy China 2030 strategy earmarked CNY 2 trillion (USD 280 billion) for hospital upgrades, including visualization towers for secondary cities. Gulf Cooperation Council members invested USD 40 billion in healthcare projects from 2024 to 2026 to attract medical tourism. Brazil boosted endoscopy capacity by 12% in 2024, yet still faced lengthy screening backlogs in public facilities.
Restraints Impact Analysis*
| Restraint | (~) % Impact on CAGR Forecast | Geographic Relevance | Impact Timeline |
|---|---|---|---|
| High Capital and Operating Costs of Advanced Systems | -0.8% | Global, acute in emerging markets | Medium term (2-4 years) |
| Shortage of Skilled Endoscopy Professionals | -0.6% | North America, Europe, Asia-Pacific | Long term (≥ 4 years) |
| Stringent Regulatory and Reimbursement Barriers | -0.5% | North America, Europe | Short term (≤ 2 years) |
| Environmental and Supply-Chain Challenges | -0.4% | Global, pronounced in import-dependent regions | Medium term (2-4 years) |
| Source: Mordor Intelligence | |||
High Capital and Operating Costs of Advanced Systems
A complete 4K tower can exceed USD 150,000 and often requires a 7-year amortization period, delaying refresh cycles for cash-constrained hospitals. European facilities spend EUR 100–150 per reprocessing run, translating to EUR 10,000–15,000 in annual operating costs for a scope used 100 times. Water use of 40–60 liters per cycle challenges hospitals in arid regions. AI modules priced at USD 20,000–30,000 per year face adoption hurdles where CMS reimbursement is bundled. Currency depreciation in Brazil and South Africa increased the prices of imported equipment by the same amount, forcing some facilities to procure refurbished systems.
Shortage of Skilled Endoscopy Professionals
Only 10% of United Kingdom gastroenterology trainees felt able to complete standard training on schedule, and just 36.1% secured provisional colonoscopy accreditation in 2024. U.S. fellowship programs offered 79 advanced-endoscopy positions in 2024, short of the estimated annual need for 150. Japan’s physician workforce is aging; 30% of gastroenterologists were over 60 in 2024, and rural prefectures reported endoscopist densities below 5 per 100,000 residents. Video-based competency tools and AI feedback systems entered pilot use in 2025 but require integration with learning management platforms to scale. Rising labor costs—often USD 500,000–600,000 salaries plus six-figure sign-on bonuses—tightened hospital budgets for equipment upgrades.
*Our forecasts treat driver/restraint impacts as directional, not additive. The impact forecasts reflect baseline growth, mix effects, and variable interactions.
Segment Analysis
By Product Type: High-Definition Systems Anchor Revenue, AI Platforms Accelerate
High-definition systems accounted for 46.54% of the endoscopy visualization systems market in 2025 and remain the backbone of tertiary and ambulatory workflows. Their reliability, familiarity, and mature supply chain support wide deployment in both diagnostic and therapeutic procedures. Standard-definition units linger in mobile and rural programs but shrink as refurbished HD towers become affordable. Single-use solutions and camera-head upgrades allow hospitals to optimize infection control without full tower replacement.
AI-enabled visualization platforms will expand at 9.54% CAGR to 2031 as more algorithms gain regulatory clearance and clinical guidelines endorse their use. Improved adenoma detection and real-time quality metrics address payer and malpractice concerns, justifying subscription fees despite bundled reimbursement. Component manufacturers target lightweight processors capable of running convolutional networks at the edge, reducing latency within existing video streams. The competitive field includes both large OEMs and software-only entrants that license algorithms to incumbents.


By End User: Hospitals Dominate, Ambulatory Centers Accelerate
Hospitals accounted for 58.65% of 2025 revenue, reflecting high case complexity and the need for anesthesia support, intensive care backup, and overnight beds. They maintain multi-tower installations to handle therapeutic ERCP, EUS-guided biopsy, and advanced mucosal dissection, protecting share even as routine colonoscopy shifts outward. National procurement programs in Japan, China, and Germany continue to favor hospital deployments of high-resolution towers.
Ambulatory surgery centers are projected to expand at 10.32% CAGR through 2031 as insurers shift elective procedures toward lower-cost venues. CMS pass-through codes for single-use scopes improved ASC economics, and shorter turnover allows 20% more daily colonoscopies than hospital outpatient departments. Private-equity roll-ups of gastroenterology practices have increased ASC bargaining power with vendors, fostering standardization on modular, cloud-connected towers that minimize on-site IT overhead.
By Resolution: Full HD Leads, 4K Gains Momentum
Full high-definition systems accounted for 61.43% of installed units in 2025, underscoring their balance of clarity, bandwidth, and cost. Mature component supply compressed prices by 15% between 2020 and 2024, enabling broad upgrades in community hospitals. For routine screening colonoscopy, full HD still meets detection targets, dampening immediate 4K conversion outside high-acuity centers.
Four-kilopixel systems are forecast to rise at 9.65% CAGR because complex polyp resection and early cancer staging demand clearer visualization of microvasculature and mucosal texture. Teaching hospitals that perform more than 500 submucosal dissections annually are upgrading twice as fast as low-volume facilities. Vendors emphasize HDR processing and extended depth-of-field optics to justify capital premiums while ensuring backward compatibility with existing scopes.
By Technology: 2D Imaging Prevails, AI-Assisted Imaging Accelerates
Two-dimensional imaging accounted for 64.67% of 2025 revenue, supported by a global base of more than 500,000 towers. Decades of clinical validation and universal scope compatibility sustain demand, especially in emerging markets where cost is paramount. Three-dimensional systems remain confined to complex therapeutic centers due to acquisition costs above USD 200,000 and the need for dedicated monitors.
AI-assisted imaging will climb at 10.11% CAGR, driven by clear clinical benefit. Hospital quality officers highlight 8–10% declines in interval colorectal cancer where AI modules are active. Vendor pricing algorithms on subscription models ease capital constraints but expose hospitals to annual fee reviews. Regulatory scrutiny under the EU AI Act and forthcoming FDA guidance elevates compliance cost but provides long-term confidence for payers and malpractice carriers.
Geography Analysis
North America contributed 43.45% of global revenue in 2025, buoyed by roughly 15 million annual colonoscopies and early adoption of FDA-cleared AI modules. CMS payment updates favored outpatient sites and introduced pass-through codes for single-use scopes, spurring procurement in ambulatory chains. Canada earmarked CAD 1.2 billion (USD 880 million) for imaging capacity in 2024 to reduce pandemic backlogs. Mexico’s private hospitals expanded 9% in 2024, catering to cross-border patients and installing bilingual AI interfaces to attract international clientele.
Asia-Pacific is projected to record the fastest growth at 8.43% CAGR to 2031, supported by Japan’s sizeable USD 32.6 billion device market and India’s goal of reaching USD 50 billion by 2030. Aging demographics in Japan and South Korea double per-capita endoscopy use compared with younger cohorts. China’s CNY 2 trillion hospital-upgrade plan focuses on tier-2 cities where endoscopy penetration trails coastal benchmarks. India’s tariff on finished devices tries to stimulate local assembly, yet most critical optics are still imported, preserving premium pricing.
Europe captured around 28% of revenue in 2025, but reimbursement diversity slows uniform adoption of AI and 4K platforms. Germany performs close to 6 million screening colonoscopies each year, yet public hospitals face flat capital budgets. The United Kingdom allocated GBP 500 million (USD 635 million) for diagnostic hubs with mobile endoscopy units to cut six-month wait lists. Southern Europe shows slower AI uptake amid cautious reimbursement deliberations. The European AI Act standardizes surveillance and transparency, potentially harmonizing payer decisions over time.
The Middle East and Africa and South America together represented about 8% of 2025 revenue. Gulf Cooperation Council states invested USD 40 billion in health facilities through 2026, aiming to attract medical tourists needing complex gastroenterology care. Brazil expanded public endoscopy capacity 12% in 2024, though six-month waits persist. Currency swings and import duties keep advanced towers pricey, leaving refurbished HD systems as stepping-stones until fiscal conditions improve.

Competitive Landscape
The endoscopy visualization systems market remains moderately concentrated; the five largest vendors—Olympus, Karl Storz, Stryker, Medtronic, and Fujifilm—control roughly half of installed revenue. Olympus partnered with Swan EndoSurgical in 2025 to meld its EVIS X1 platform with articulated robotics for complex submucosal work. Karl Storz acquired Asensus Surgical in 2024 to integrate robotics into its product line and compete with Intuitive Surgical in flexible environments. Ambu leads the single-use trend, targeting DKK 5 billion (USD 725 million) revenue by FY2028 on the strength of its aScope line.
Strategic moves orbit vertical integration, AI licensing, and outpatient expansion. Medtronic licensed GI Genius from Cosmo Pharmaceuticals, creating recurring software revenue without replacing hardware. Fujifilm, Olympus, and Iterative Scopes chase algorithm differentiation in the growing AI stack. Cardinal Health’s USD 3.9 billion purchase of GI Alliance in 2024 gives the distributor direct influence over device selection across 140 centers. Start-ups such as Magentiq Eye pursue software-only approaches, renting AI-as-a-service to hardware incumbents.
The regulatory climate favors iterative over breakthrough innovation; the FDA’s average 164-day 510(k) review acts as a barrier to new entrants but also enables quick code updates for approved algorithms. Environmental concerns spur interest in hybrid systems that balance infection control with sustainability, opening lanes for joint ventures between polymer specialists and scope OEMs. Price competition remains muted in advanced 4K and AI tiers, safeguarding R&D budgets but leaving emerging-market segments open to lower-cost Asian challengers.
Endoscopy Visualization Systems Industry Leaders
Olympus Corporation
Karl Storz SE & Co. KG
Fujifilm Holdings Corporation
Stryker Corporation
Boston Scientific Corporation
- *Disclaimer: Major Players sorted in no particular order

Recent Industry Developments
- July 2025: Olympus co-founds Swan EndoSurgical with an initial USD 65 million investment and a funding ceiling of USD 458 million to develop robotic-assisted flexible endoscopy integrating EVIS X1
- November 2024: Cardinal Health acquires GI Alliance for roughly USD 3.9 billion, bringing 400 gastroenterologists and 140 sites under a unified procurement umbrella
- August 2024: Karl Storz finalizes the purchase of Asensus Surgical for USD 0.35 per share, gaining the Senhance robotic platform for flexible-scope procedures


Global Endoscopy Visualization Systems Market Report Scope
As per the scope of the report, endoscopy visualization systems are medical devices that enhance the visualization of internal body structures during endoscopic procedures. They include monitors, cameras, and imaging software that provide real-time images and videos. These systems improve diagnostic accuracy and guide surgical interventions.
The Endoscopy Visualization Systems Market is segmented by Product Type (Standard Definition Systems, High Definition Systems, Endoscopy Visualization Components, Single-Use Visualization Systems, and AI-Enabled Visualization Platforms), by End User (Hospitals, Ambulatory Surgery Centers, Specialty Clinics, Diagnostic Imaging Centers, and Other End Users), By Resolution (4K, FHD, and SD), By Technology (2D Imaging, 3D Imaging, 4K / Ultra-HD Imaging, and AI-Assisted Imaging), and Geography (North America, Europe, Asia-Pacific, Middle East and Africa, and South America). The market report also covers the estimated market sizes and trends for 17 countries across major regions globally. The report offers the value (in USD million) for the above segments.
| Standard Definition Systems | 2D Systems |
| 3D Systems | |
| High Definition Systems | 2D Systems |
| 3D Systems | |
| Endoscopy Visualization Components | Camera Heads |
| Insufflators | |
| Light Sources | |
| High-Definition Monitors | |
| Suction Pumps | |
| Video Processors | |
| Single-Use Visualization Systems | |
| AI-Enabled Visualization Platforms |
| Hospitals |
| Ambulatory Surgery Centers |
| Specialty Clinics |
| Diagnostic Imaging Centers |
| Other End Users |
| 4K | UHD Resolution |
| DCI Resolution | |
| FHD | |
| SD |
| 2D Imaging |
| 3D Imaging |
| 4K / Ultra-HD Imaging |
| AI-Assisted Imaging |
| North America | United States |
| Canada | |
| Mexico | |
| Europe | Germany |
| United Kingdom | |
| France | |
| Italy | |
| Spain | |
| Rest Of Europe | |
| Asia-Pacific | China |
| Japan | |
| India | |
| Australia | |
| South Korea | |
| Rest Of Asia-Pacific | |
| Middle East & Africa | GCC |
| South Africa | |
| Rest Of Middle East & Africa | |
| South America | Brazil |
| Argentina | |
| Rest Of South America |
| By Product Type | Standard Definition Systems | 2D Systems |
| 3D Systems | ||
| High Definition Systems | 2D Systems | |
| 3D Systems | ||
| Endoscopy Visualization Components | Camera Heads | |
| Insufflators | ||
| Light Sources | ||
| High-Definition Monitors | ||
| Suction Pumps | ||
| Video Processors | ||
| Single-Use Visualization Systems | ||
| AI-Enabled Visualization Platforms | ||
| By End User | Hospitals | |
| Ambulatory Surgery Centers | ||
| Specialty Clinics | ||
| Diagnostic Imaging Centers | ||
| Other End Users | ||
| By Resolution | 4K | UHD Resolution |
| DCI Resolution | ||
| FHD | ||
| SD | ||
| By Technology | 2D Imaging | |
| 3D Imaging | ||
| 4K / Ultra-HD Imaging | ||
| AI-Assisted Imaging | ||
| Geography | North America | United States |
| Canada | ||
| Mexico | ||
| Europe | Germany | |
| United Kingdom | ||
| France | ||
| Italy | ||
| Spain | ||
| Rest Of Europe | ||
| Asia-Pacific | China | |
| Japan | ||
| India | ||
| Australia | ||
| South Korea | ||
| Rest Of Asia-Pacific | ||
| Middle East & Africa | GCC | |
| South Africa | ||
| Rest Of Middle East & Africa | ||
| South America | Brazil | |
| Argentina | ||
| Rest Of South America | ||


Key Questions Answered in the Report
How large is the endoscopy visualization systems market in 2026?
It stands at USD 26.49 billion in 2026 and is projected to reach USD 37.17 billion by 2031 at a 7.01% CAGR.
Which product category dominates current installations?
Full high-definition towers account for 61.43% of installed systems, balancing clarity and cost.
What segment is growing fastest by end user?
Ambulatory surgery centers are forecast to grow at 10.32% CAGR through 2031 as payers steer routine procedures to outpatient venues.
How is artificial intelligence impacting detection rates?
FDA-cleared AI modules improve adenoma detection by 13-14 percentage points over baseline performance.
Which region will exhibit the highest growth?
Asia-Pacific is expected to expand at 8.43% CAGR thanks to infrastructure programs in Japan, China, and India.
What is the main restraint to wider adoption of 4K and AI towers?
High capital cost—often beyond USD 150,000 per tower—and bundled reimbursement delay return on investment, particularly in emerging markets.
Page last updated on:


