Electronic Contract Assembly Market Size and Share
Market Overview
| Study Period | 2019 - 2030 |
|---|---|
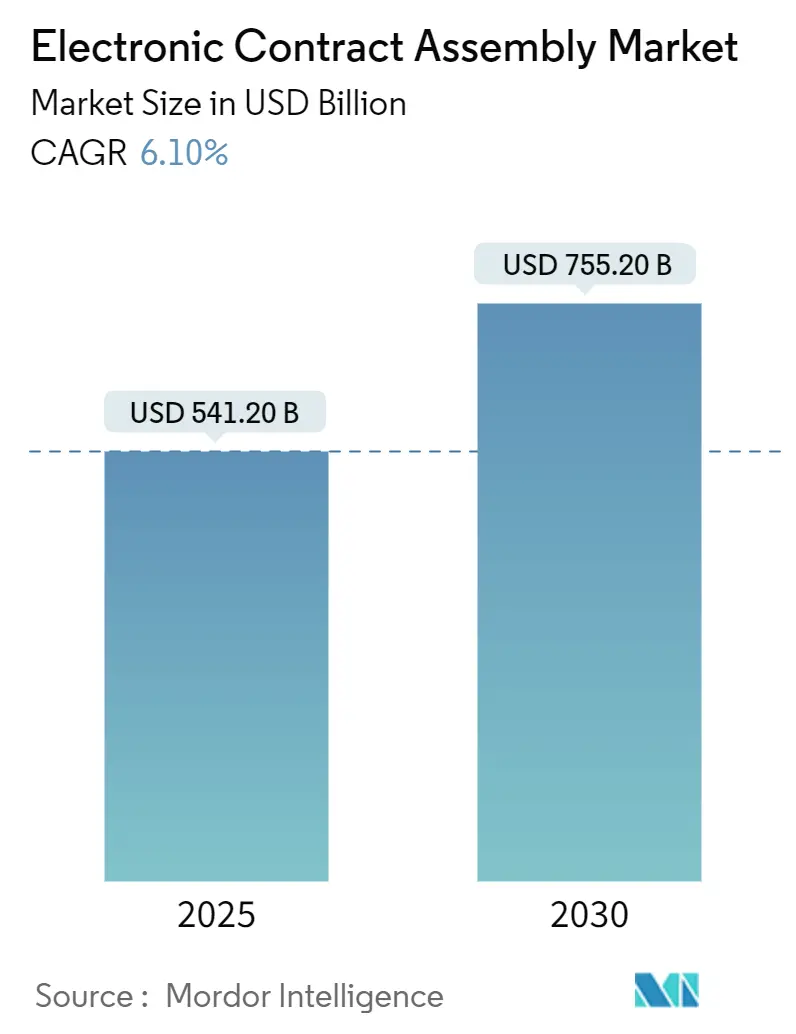
| Market Size (2025) | USD 541.20 Billion |
| Market Size (2030) | USD 755.20 Billion |
| Growth Rate (2025 - 2030) | 6.10% CAGR |
| Fastest Growing Market | Middle East |
| Largest Market | Asia Pacific |
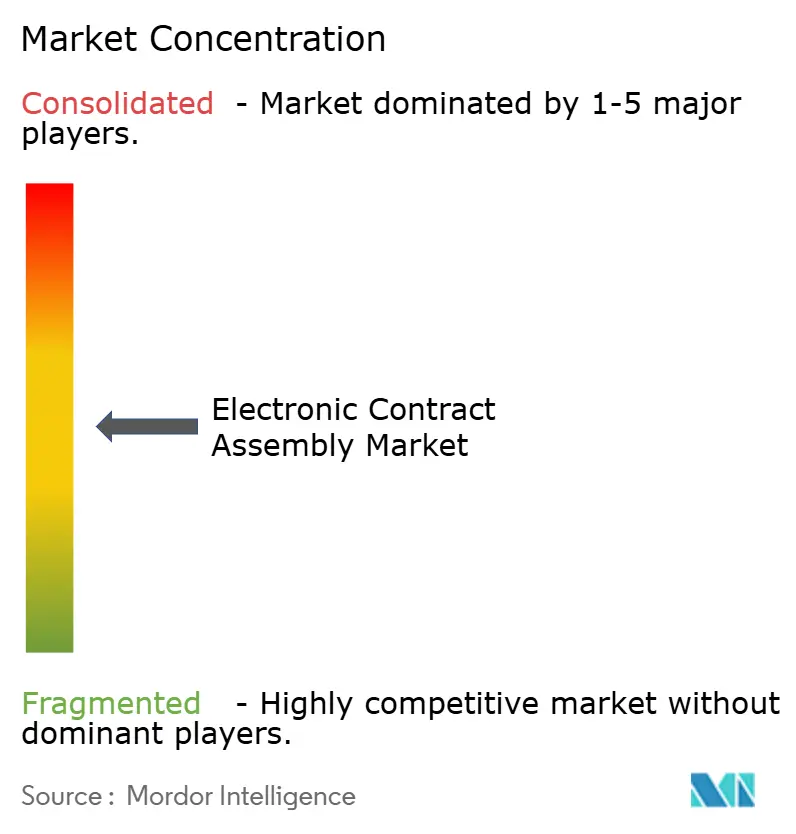
| Market Concentration | Medium |
Major Players *Disclaimer: Major Players sorted in no particular order Image © Mordor Intelligence. Reuse requires attribution under CC BY 4.0. | |
Electronic Contract Assembly Market Analysis by Mordor Intelligence
The electronic contract assembly market size stands at USD 541.2 billion in 2025 and is projected to reach USD 755.2 billion by 2030, registering a 6.1% CAGR. This momentum stems from original equipment manufacturers shifting from cost-arbitrage sourcing to value-added partnerships that span board-level population, box-build integration, joint design, and rapid prototyping. On-shoring incentives in the United States and European Union redirect capital toward domestic factories, while edge-AI inference chips and ultra-small wearable sensors demand tighter tolerances that only the most advanced surface-mount lines can achieve. Digitalized supply-chain visibility, rising miniaturization requirements, and rapid new-product-introduction (NPI) centers further accelerate outsourcing decisions. Meanwhile, lead-time volatility, wage inflation in legacy hubs, and stringent environmental rules test margins, fueling investment in automation and compliance expertise.
Key Report Takeaways
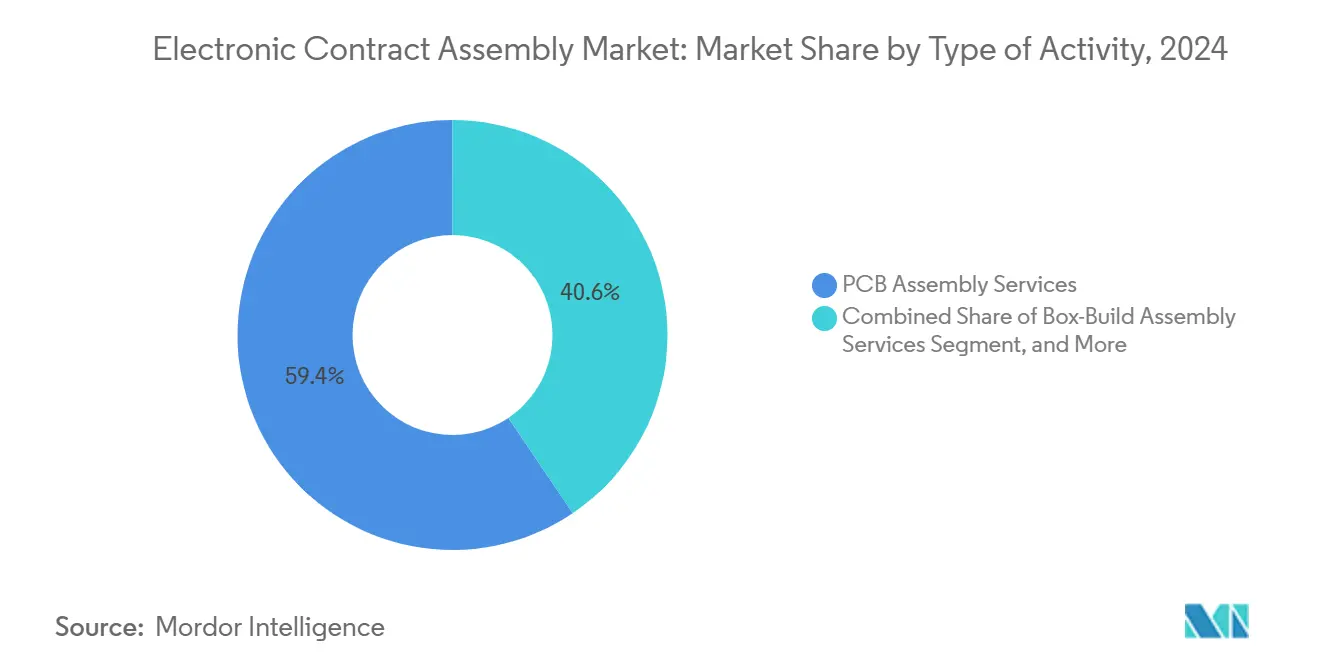
- By type of activity, printed circuit board assembly held 59.44% of the electronic contract assembly market share in 2024, while box-build services are expanding at a 7.22% CAGR through 2030.
- By application, industrial electronics led with 32.78% revenue share in 2024; healthcare is advancing at an 8.42% CAGR through 2030.
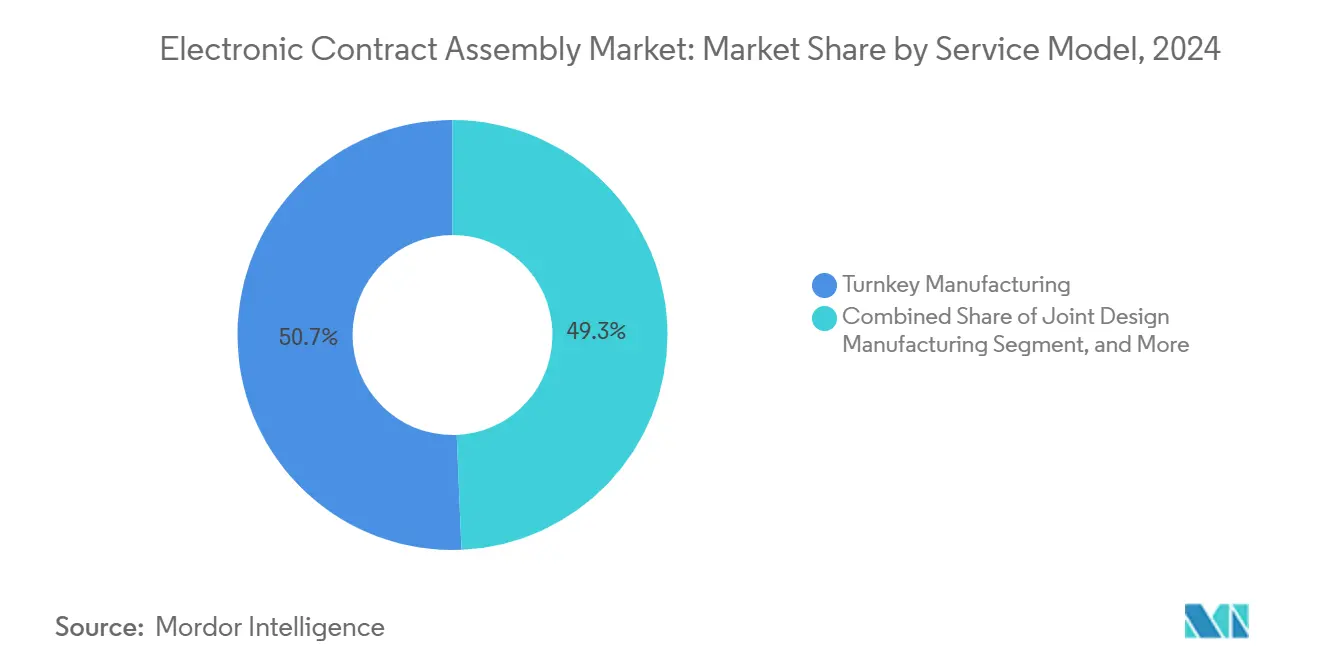
- By service model, turnkey manufacturing captured 50.67% of the electronic contract assembly market size in 2024, whereas joint design manufacturing is forecast to grow at 7.56% between 2025-2030.
- By manufacturing technology, surface-mount technology accounted for a 75.55% share in 2024, while mixed-technology lines are set to rise at an 8.54% CAGR to 2030.
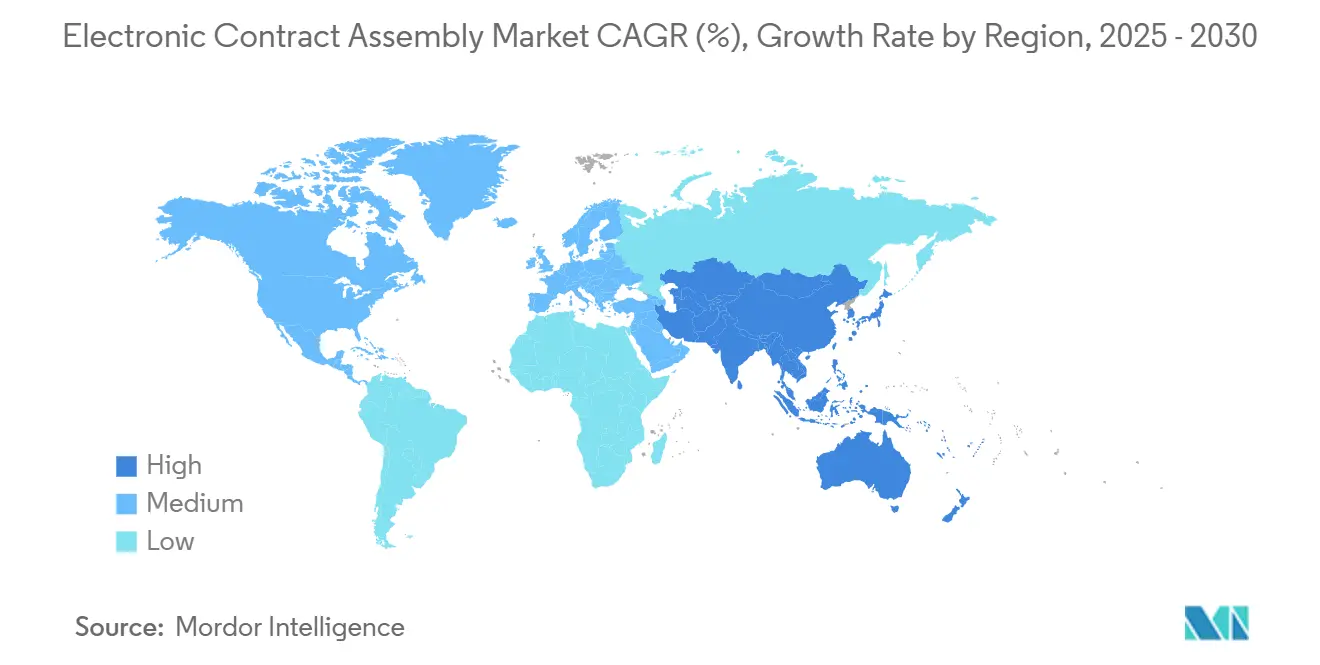
- By geography, Asia-Pacific commanded 47.89% of global revenue in 2024, and the Middle East is poised for a 9.22% CAGR through 2030.
Global Electronic Contract Assembly Market Trends and Insights
Drivers Impact Analysis*
| Driver | (~) % Impact on CAGR Forecast | Geographic Relevance | Impact Timeline |
|---|---|---|---|
| Digitalization of manufacturing supply chains | +1.2% | Global, early adoption in North America and Western Europe | Medium term (2-4 years) |
| Edge-AI hardware proliferation in industrial automation | +1.1% | Global, APAC manufacturing and North American deployment | Long term (≥ 4 years) |
| Increasing outsourcing by high-mix low-volume OEMs | +1.0% | North America, Europe, select APAC markets | Short term (≤ 2 years) |
| On-shoring initiatives accelerating in North America | +1.0% | North America, spillover to Mexico and the European Union | Medium term (2-4 years) |
| Miniaturization demands in wearables and IoT devices | +0.9% | Global, led by APAC hubs and North American design centers | Medium term (2-4 years) |
| Rising demand for rapid prototyping and NPI services | +0.8% | North America, Europe, emerging APAC clusters | Short term (≤ 2 years) |
| Source: Mordor Intelligence | |||
Digitalization Of Manufacturing Supply Chains
Cloud traceability platforms now synchronize enterprise resource planning, manufacturing execution, and supplier portals, granting real-time visibility across multi-site operations. Blockchain pilots in aerospace and defense protect against counterfeit components, while Industrial Internet of Things standards published in 2024 lower integration costs for mid-tier providers. Digital twins simulate process tweaks before physical rollout, cutting NPI cycle times by 20-30% and reducing scrap. Collectively, these tools tighten delivery performance and free working capital formerly locked in expedite fees, reinforcing the electronic contract assembly market’s shift toward data-driven operations.
Edge-AI Hardware Proliferation In Industrial Automation
Demand for factory-edge analytics drives orders for inference modules that blend ball-grid-array processors with through-hole power connectors. IEEE 1149.10, issued in 2024, enables automated boundary-scan testing on these mixed-signal boards, trimming debug time.[1]Institute of Electrical and Electronics Engineers, “IEEE 1149.10 Standard for Boundary-Scan Testing of Mixed-Signal Boards,” ieee.org Contract assemblers with hybrid surface-mount and selective-solder lines capture premium pricing for such builds. As predictive-maintenance algorithms spread across manufacturing and energy sites, OEMs turn to partners that can co-engineer thermal solutions, ensuring sustained growth for the electronic contract assembly market.
Increasing Outsourcing By High-Mix Low-Volume OEMs
Industrial automation and medical diagnostics brands divest in-house lines to focus cash on R&D. Modular cells and quick-change fixtures now make lot sizes of 50 units economically feasible, a capability out of reach just a decade ago. A 2024 Institute for Supply Management survey found 62% of North American electronics OEMs plan to raise outsourcing levels over the next three years.[2]Institute for Supply Management, “Electronics Manufacturing Outsourcing Trends Survey,” ismworld.org This pivot enlarges the electronic contract assembly market as vendors skilled in weekly engineering changes command higher margins.
On-Shoring Initiatives Accelerating In North America
The CHIPS and Science Act releases USD 52 billion in subsidies that pull semiconductor back-end packaging and final board assembly closer to U.S. fabs. Tariff exposure and logistics risk decline, while customers appreciate reduced lead-times and simplified export-control compliance. Tier-one contract assemblers are adding capacity in Arizona, Texas, and Guadalajara to capture redirected programs, lifting regional demand within the electronic contract assembly market.
Restraints Impact Analysis*
| Restraint | (~) % Impact on CAGR Forecast | Geographic Relevance | Impact Timeline |
|---|---|---|---|
| Volatility in electronic component lead times | -0.7% | Global, acute in APAC and North America | Short term (≤ 2 years) |
| Rising labor costs in traditional EMS hubs | -0.5% | APAC core (China, Malaysia, Thailand), spillover Mexico | Medium term (2-4 years) |
| Supply-chain cybersecurity vulnerabilities | -0.3% | Global, heightened in North America and Europe | Long term (≥ 4 years) |
| Stricter environmental regulations on solder and e-waste | -0.4% | Europe, North America, select APAC markets | Medium term (2-4 years) |
| Source: Mordor Intelligence | |||
Volatility In Electronic Component Lead Times
Allocation of power-management ICs, automotive-grade microcontrollers, and multilayer ceramic capacitors pushes delivery windows out to 16-24 weeks. Assemblers carry 12-16 weeks of safety stock, tying up capital and raising obsolescence risk. Distributors enforce non-cancellable terms, transferring inventory exposure to providers with thinner balance sheets. Line stoppages, cited by 38% of manufacturers in 2024, delay revenue and trigger penalty clauses, weighing on the electronic contract assembly market.
Rising Labor Costs In Traditional EMS Hubs
Wages in China’s coastal provinces climbed 8-10% annually from 2020-2024, and Malaysia’s minimum wage hit MYR 1,500 (USD 340) in 2024. Mexico and Thailand report similar increases, squeezing margins on labor-intensive tasks. Assemblers invest USD 500,000-2 million per line in automation to offset payroll pressure, but financing such upgrades challenges mid-tier firms. As Southeast Asian wages approach Eastern European levels by 2028, competitive advantage shifts from low labor cost to engineering value, reshaping the electronic contract assembly market.
*Our forecasts treat driver/restraint impacts as directional, not additive. The impact forecasts reflect baseline growth, mix effects, and variable interactions.
Segment Analysis
By Type of Activity: Box-Build Services Gain Share
Box-build assembly is forecast to grow at 7.22% from 2025-2030, surpassing the overall electronic contract assembly market CAGR. PCB assembly retained 59.44% of revenue in 2024, underscoring its role as the foundation of outsourced production. However, the electronic contract assembly market size for integrated system builds is expanding as brands transfer enclosure integration, firmware loading, and final test to external partners. The value proposition lies in 15-25% higher pricing and end-to-end accountability.
Providers continue to announce capacity for higher-level assembly. Flex opened a 200,000-square-foot hub in Guadalajara, while Jabil expanded healthcare integration in Florida. Sanmina disclosed 18% year-over-year box-build revenue growth in 2024. Investments in environmental stress screening, cleanrooms, and automated functional test validate the electronic contract assembly market’s migration toward integrated services.


By Application: Healthcare Leads Growth
Healthcare electronics are projected to advance at 8.42% between 2025-2030. The segment benefits from aging populations and chronic-disease monitoring devices that require ISO 13485-certified production. Industrial electronics held the greatest electronic contract assembly market share at 32.78% in 2024, powered by factory-automation hardware.
FDA cybersecurity guidance issued in 2024 drives demand for secure firmware and traceability in medical devices. Continuous glucose monitors and wearable cardiac sensors necessitate hermetic sealing and biocompatible materials, capabilities concentrated among specialized assemblers. These dynamics expand the electronic contract assembly market size for healthcare while balancing cyclical exposure from other verticals.
By Service Model: Joint Design Manufacturing Gains Momentum
Joint design manufacturing (JDM) is forecast to rise at 7.56% through 2030 as OEMs seek co-development partners. Turnkey programs still represented 50.67% of the electronic contract assembly market in 2024, favored by brands wanting single-point accountability for sourcing and logistics.
Plexus reports that JDM engagements generate 40% higher gross margins due to shared intellectual property and longer program lifecycles. Automotive tier-one suppliers adopt JDM for battery-management and ADAS modules to accelerate innovation. These multi-year agreements secure recurring revenue streams within the electronic contract assembly market.
By Manufacturing Technology: Mixed Technology Accelerates
Mixed-technology lines are projected to post an 8.54% CAGR to 2030, outpacing pure surface-mount growth. Surface-mount assemblies captured 75.55% of revenue in 2024, reflecting high-density consumer devices. However, embedded AI gateways and automotive domain controllers blend fine-pitch ASICs with through-hole connectors, pushing demand for hybrid processes.
The electronic contract assembly market size for mixed technology is rising as providers install laser selective-solder systems and dual-process inspection. IEEE 1149.10 simplifies test coverage for such boards, reducing debug cost and time. Assemblers offering seamless hybrid capability differentiate from commodity providers.
Geography Analysis
Asia-Pacific remained the anchor, holding 47.89% of 2024 revenue, underpinned by China’s scale and Vietnam’s cost advantage. Yet wage escalation and geopolitical risk prompt OEMs to dual-source. India’s Production-Linked Incentive scheme incentivizes smartphone and wearables assembly, while Indonesia and the Philippines lure low-complexity programs with 30-40% lower labor costs. These adjustments diversify the electronic contract assembly market and safeguard supply-chain continuity.
North America’s share rises as the CHIPS and Science Act subsidizes domestic back-end packaging and board integration. Tier-one providers add sites in Arizona, Texas, and Mexico, slashing trans-Pacific transit times and tariffs. Customers value shorter design-feedback loops and easier export-control compliance, strengthening the regional electronic contract assembly market size. European demand stays steady, propelled by automotive electronics in Germany and medical assembly in Ireland, although high energy prices temper margin expansion.
The Middle East is the fastest-growing region at 9.22% between 2025-2030. The United Arab Emirates launched a USD 10 billion electronics fund, and Flex opened a 150,000-square-foot site in Dubai in 2025. Saudi Arabia’s Vision 2030 targets local content in defense and telecom procurements, creating captive demand for domestic assembly. Africa appears on the horizon: Kenya and South Africa leverage labor costs 50% below Southeast Asia to court consumer-electronics and solar-inverter programs, hinting at future additions to the electronic contract assembly market.

Competitive Landscape
The top 10 providers account for roughly 35% of global revenue, indicating moderate fragmentation. Foxconn, Flex, and Jabil leverage economies of scale, global logistics, and after-sales services to win high-volume programs, while mid-tier specialists such as Plexus and Benchmark focus on engineering-intensive, low-volume builds. Regional challengers in Vietnam and India offer 20-30% cost savings but must improve quality and supply-chain maturity to capture more electronic contract assembly market share.
Technology investment differentiates winners. Celestica’s machine-learning algorithm predicts solder-joint failures, cutting scrap by 12% during pilot runs.[3]“Patent Application US20240123456: Machine Learning for Solder Joint Quality Prediction,” uspto.gov Automated optical and X-ray inspection bolster first-pass yields, and digital twins simulate process variability before tooling. Strategic alliances with component distributors secure allocation-constrained parts, a crucial edge when launching AI accelerators. As labor arbitrage wanes, design collaboration, supply-chain risk management, and regulatory compliance drive margin expansion, reinforcing the evolution of the electronic contract assembly industry.
Electronic Contract Assembly Industry Leaders
ATL Technology
Compulink Cable Assemblies Inc.
Connect Group NV
Leoni Special Cables Ltd
Amphenol Interconnect Products Corp. (AIPC)
- *Disclaimer: Major Players sorted in no particular order

Recent Industry Developments
- January 2025: Foxconn announced a USD 1.5 billion expansion in Tamil Nadu, India, adding 2 million square feet for smartphone and automotive electronics production.
- January 2025: Flex completed the USD 350 million acquisition of Anord Mardix, extending capabilities in hyperscale data-center power infrastructure.
- November 2024: Jabil opened a 120,000-square-foot ISO 13485 facility in Penang for insulin pumps and surgical robotics components.
- November 2024: Sanmina secured a five-year, USD 800 million contract to assemble next-generation radar modules for a U.S. defense prime contractor.


Global Electronic Contract Assembly Market Report Scope
The electronic contract manufacturing (ECM) services primarily refer to various services that include engineering design, PCB fabrication, subassembly manufacturing, functional testing, various assembly services, distribution, and order fulfillment on behalf of the OEMs (Original Electronic Manufacturers). These electronic contract service providers are primarily utilized as either a supplement or a replacement to the company-owned manufacturing operations.
The Electronic Contract Assembly Market Report is Segmented by Type of Activity (PCB Assembly, Cable/Harness Assembly, Membrane/Keypad Switch Assembly, Box-Build Assembly, System-on-Module Assembly), Application (Healthcare, Automotive, Industrial, IT and Telecom, Other Applications), Service Model (Turnkey, Consignment, Joint Design, Design and Build), Manufacturing Technology (SMT, Through-Hole, Mixed), and Geography (North America, South America, Europe, Asia-Pacific, Middle East and Africa). Market Forecasts are Provided in Terms of Value (USD).
| PCB Assembly Services |
| Cable/Harness Assembly Services |
| Membrane/Keypad Switch Assembly Services |
| Box-Build Assembly Services |
| System-on-Module Assembly Services |
| Healthcare |
| Automotive |
| Industrial |
| IT and Telecom |
| Other Applications |
| Turnkey Manufacturing |
| Consignment Manufacturing |
| Joint Design Manufacturing |
| Design and Build |
| Surface-Mount Technology Assembly |
| Through-Hole Technology Assembly |
| Mixed Technology Assembly |
| North America | United States | |
| Canada | ||
| Mexico | ||
| South America | Brazil | |
| Argentina | ||
| Chile | ||
| Rest of South America | ||
| Europe | United Kingdom | |
| Germany | ||
| France | ||
| Italy | ||
| Spain | ||
| Rest of Europe | ||
| Asia-Pacific | China | |
| Japan | ||
| India | ||
| South Korea | ||
| Australia and New Zealand | ||
| Rest of Asia-Pacific | ||
| Middle East and Africa | Middle East | United Arab Emirates |
| Saudi Arabia | ||
| Turkey | ||
| Rest of Middle East | ||
| Africa | South Africa | |
| Kenya | ||
| Nigeria | ||
| Rest of Africa | ||
| By Type of Activity | PCB Assembly Services | ||
| Cable/Harness Assembly Services | |||
| Membrane/Keypad Switch Assembly Services | |||
| Box-Build Assembly Services | |||
| System-on-Module Assembly Services | |||
| By Application | Healthcare | ||
| Automotive | |||
| Industrial | |||
| IT and Telecom | |||
| Other Applications | |||
| By Service Model | Turnkey Manufacturing | ||
| Consignment Manufacturing | |||
| Joint Design Manufacturing | |||
| Design and Build | |||
| By Manufacturing Technology | Surface-Mount Technology Assembly | ||
| Through-Hole Technology Assembly | |||
| Mixed Technology Assembly | |||
| By Geography | North America | United States | |
| Canada | |||
| Mexico | |||
| South America | Brazil | ||
| Argentina | |||
| Chile | |||
| Rest of South America | |||
| Europe | United Kingdom | ||
| Germany | |||
| France | |||
| Italy | |||
| Spain | |||
| Rest of Europe | |||
| Asia-Pacific | China | ||
| Japan | |||
| India | |||
| South Korea | |||
| Australia and New Zealand | |||
| Rest of Asia-Pacific | |||
| Middle East and Africa | Middle East | United Arab Emirates | |
| Saudi Arabia | |||
| Turkey | |||
| Rest of Middle East | |||
| Africa | South Africa | ||
| Kenya | |||
| Nigeria | |||
| Rest of Africa | |||


Key Questions Answered in the Report
How large is the electronic contract assembly market in 2025?
It is valued at USD 541.2 billion and is set to reach USD 755.2 billion by 2030.
What is driving faster growth in healthcare assemblies?
Regulatory tailwinds and demand for portable diagnostics, continuous glucose monitors, and secure firmware lift healthcare to an 8.42% CAGR.
Why are mixed-technology lines gaining traction?
Edge-AI gateways and automotive domain controllers mix fine-pitch ASICs with through-hole connectors, pushing mixed-technology assembly to an 8.54% CAGR.
Which region is expanding the fastest through 2030?
The Middle East is forecast to log a 9.22% CAGR as the UAE and Saudi Arabia invest in sovereign electronics capacity.
How do on-shoring incentives affect North America?
Subsidies under the CHIPS and Science Act relocate semiconductor packaging and board assembly domestically, raising regional market share.
What challenges do contract assemblers face with component supply?
Power-management ICs and automotive-grade microcontrollers still experience 16-24 week lead times, forcing higher safety stocks and eroding margins.
Page last updated on:


