Electro Optics Market Size and Share
Market Overview
| Study Period | 2020 - 2031 |
|---|---|
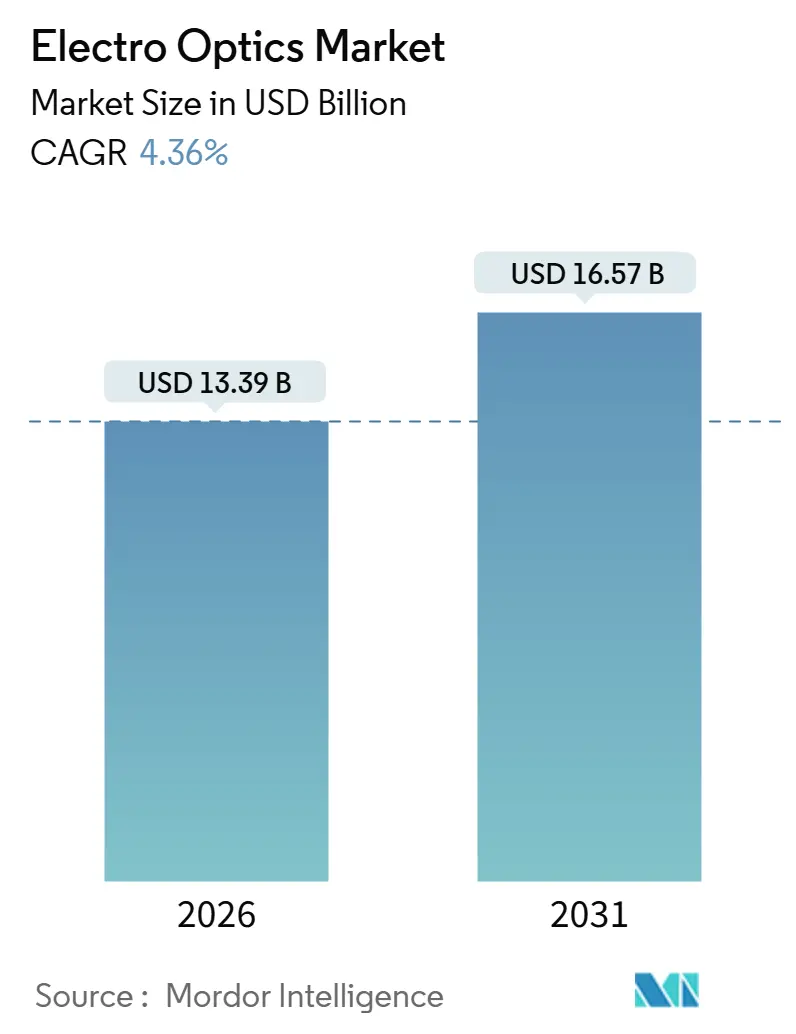
| Market Size (2026) | USD 13.39 Billion |
| Market Size (2031) | USD 16.57 Billion |
| Growth Rate (2026 - 2031) | 4.36% CAGR |
| Fastest Growing Market | Asia Pacific |
| Largest Market | North America |
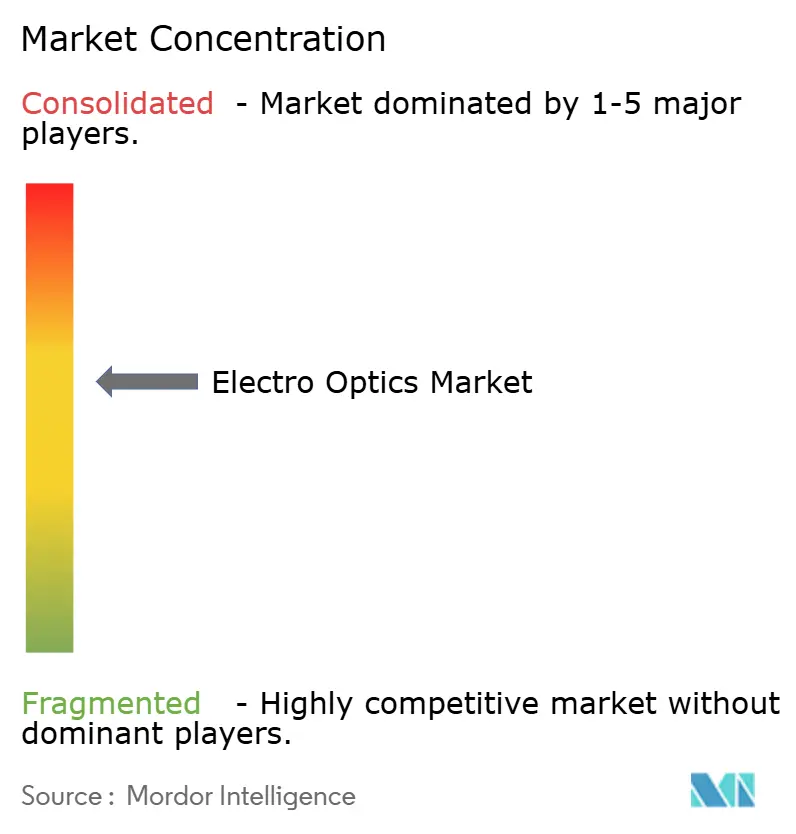
| Market Concentration | Medium |
Major Players *Disclaimer: Major Players sorted in no particular order Image © Mordor Intelligence. Reuse requires attribution under CC BY 4.0. | |
Electro Optics Market Analysis by Mordor Intelligence
The electro optics market size is USD 13.39 billion in 2026 and is projected to reach USD 16.57 billion by 2031, registering a CAGR of 4.36% during the forecast period. Defense modernization, hyperscale data-center photonics, and Level 3 autonomous-vehicle rollouts are reshaping the competitive landscape while sustaining steady aggregate growth. Procurement of multi-spectral targeting pods, silicon photonics modulators that support 800 Gbps traffic, and short-wave infrared cameras for advanced driver-assistance systems together create a diversified demand base that cushions cyclical swings. Suppliers that can combine optics, electronics, and embedded software into tightly integrated products capture higher margins than component-only vendors. Regulatory moves such as the European Union AI Act, tighter export-control rules, and automotive safety mandates tilt purchasing toward vertically integrated players with proven compliance records. Meanwhile, material bottlenecks in germanium, gallium, and high-grade chalcogenide glass give entrenched optics fabricators pricing power.
Key Report Takeaways
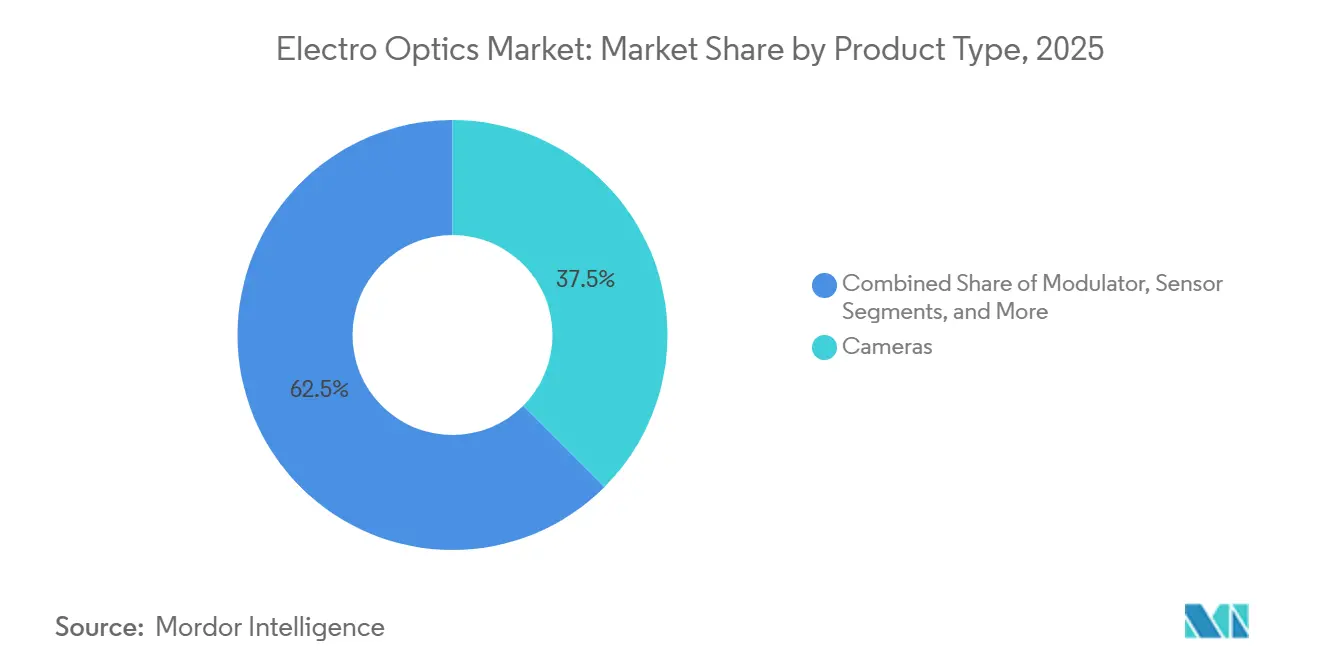
- By product type, cameras commanded 37.51% of the electro optics market share in 2025; modulators are forecast to expand at a 5.56% CAGR through 2031.
- By application, defense and security led with 45.37% revenue share in 2025, while automotive ADAS is advancing at a 5.73% CAGR to 2031.
- By wavelength, mid-wave infrared accounted for 31.18% of the electro optics market in 2025; short-wave infrared is projected to grow at a 5.61% CAGR through 2031.
- By end user, military agencies accounted for 51.18% share of the electro optics market size in 2025 and automotive OEMs are expanding at a 6.73% CAGR through 2031.
- By geography, North America captured 34.17% of the revenue share in 2025, whereas Asia-Pacific is projected to record the highest CAGR at 5.39% through 2031.
Note: Market size and forecast figures in this report are generated using Mordor Intelligence’s proprietary estimation framework, updated with the latest available data and insights as of January 2026.
Global Electro Optics Market Trends and Insights
Drivers Impact Analysis*
| Driver | (~) % Impact on CAGR Forecast | Geographic Relevance | Impact Timeline |
|---|---|---|---|
| Growing Defense Spending on EO Targeting Systems | +1.2% | Global, concentrated in North America, Europe, and Asia-Pacific | Medium term (2-4 years) |
| Rising Demand for UAV Payloads | +0.9% | Global, with early adoption in North America and Middle East | Short term (≤ 2 years) |
| Increasing Adoption in Autonomous Vehicles | +1.1% | North America, Europe, and Asia-Pacific core markets | Long term (≥ 4 years) |
| Quantum Cascade Infrared Sensors for Emissions Monitoring | +0.6% | Europe and North America, spillover to Asia-Pacific industrial zones | Medium term (2-4 years) |
| Silicon Photonics EO Modulators for 400 Gbps Data Centers | +0.7% | Global, concentrated in North America and Asia-Pacific hyperscale regions | Short term (≤ 2 years) |
| Swarm Drone Mesh Networks with Low-SWaP EO Transceivers | +0.4% | North America and select Asia-Pacific defense programs | Long term (≥ 4 years) |
| Source: Mordor Intelligence | |||
Growing Defense Spending on EO Targeting Systems
United States and allied defense budgets for fiscal 2026 allocate larger shares to multi-spectral pods, shipboard electro-optical trackers, and soldier night-vision goggles, locking in multi-year demand for high-value sensors.[1]U.S. Department of Defense, “Fiscal Year 2026 Budget Request,” comptroller.defense.gov The U.S. Army alone issued contracts worth more than USD 500 million in 2025 for goggle-binocular systems that fuse visible, near-infrared, and thermal channels in a single eyepiece, a capability now viewed as standard for infantry units. Parallel naval programs added infrared cameras to surface-combatant photonics suites to counter swarm drones in littoral zones. Because procurement cycles for pods and sights often exceed 15 years, incumbents with facility security clearances enjoy predictable retrofit revenue and high switching costs. The sustained flow of classified orders underpins stable top-line growth even when new-start weapons programs pause.
Rising Demand for UAV Payloads
Tactical and commercial drone builders are standardizing on gimbals that combine thermal, visible, and laser-rangefinder channels while weighing less than 1 kilogram, enabling rapid sensor swaps between missions. The U.S. Army boosted its 2026 unmanned-aircraft budget by 15%, specifying EO payloads that detect humans at 3 kilometers, a performance threshold now echoed by Middle Eastern buyers. Civil operators are adopting dual-band cameras for crop-stress mapping and solar-panel inspection, expanding shipment volumes that help amortize defense-grade development costs. At the same time, counter-drone systems that use EO trackers and laser designators stimulate demand for coatings and adaptive optics able to reduce sensor signatures. These overlapping military and commercial programs create a virtuous cycle that keeps payload innovation on a fast annual cadence.
Increasing Adoption of Autonomous Vehicles
Automakers are adding short-wave infrared cameras to Level 2 and Level 3 driver-assistance stacks to outperform visible sensors in fog, rain, and nighttime conditions, a capability highlighted in the U.S. New Car Assessment Program roadmap that phases in tougher low-light tests by 2029.[2]NHTSA, “New Car Assessment Program Final Decision Notice,” nhtsa.gov Silicon-based SWIR arrays entered high-volume production at Asian foundries in 2025, cutting component costs by 40% compared with indium-gallium-arsenide detectors and accelerating design wins for 2027 vehicle launches. European regulations that require explainable perception algorithms lead OEMs to favor suppliers offering end-to-end electro-optic and software stacks, narrowing the vendor field. Battery-electric platforms free thermal budget for additional cameras, and some models slated for 2030 will carry four to six infrared units to enable hands-free highway driving. The short refresh cycle of automotive infotainment and safety modules, typically three years, ensures recurring revenue for sensor makers that keep pace with software upgrades.
Quantum Cascade Infrared Sensors for Emissions Monitoring
Mid-infrared quantum cascade lasers measure methane, nitrous oxide, and volatile organic compounds with parts-per-billion sensitivity, providing plant operators with real-time compliance data rather than periodic grab samples.[3]IEEE Sensors Journal, “Quantum Cascade Laser-Based Methane Sensor,” ieeexplore.ieee.org Revised European Industrial Emissions rules mandate continuous monitoring for large combustion sources, pushing utilities and refiners to adopt laser-based gas analyzers beginning in 2025. In the United States, Environmental Protection Agency incentives cover up to 60% of the cost of optical methane detection equipment, widening the addressable market for handheld and drone-mounted kits. Silicon-photonics packaging has reduced system power draw below 10 watts, enabling battery-operated field units that technicians can carry on extended surveys. Although research-grade systems still cost more than USD 50,000, roadmap pricing shows sub-USD 10,000 offerings by 2028, opening municipal wastewater and landfill applications.
Restraints Impact Analysis*
| Restraint | (~) % Impact on CAGR Forecast | Geographic Relevance | Impact Timeline |
|---|---|---|---|
| High Procurement Cost of Precision Optics | -0.5% | Global, acute in cost-sensitive industrial and commercial segments | Short term (≤ 2 years) |
| Export Control Regulations on Dual-Use EO Components | -0.6% | Global, most restrictive in North America and Europe exports to non-allied nations | Medium term (2-4 years) |
| Limited Supply of Germanium and Gallium for Infrared Detector Fabs | -0.4% | Global, concentrated impact on North America and Europe fab operations | Medium term (2-4 years) |
| Thermal Lens Distortion in High-Power Lasers (Above 100 kW) | -0.3% | North America and Europe high-energy laser programs | Long term (≥ 4 years) |
| Source: Mordor Intelligence | |||
High Procurement Cost of Precision Optics
Germanium and zinc selenide substrates, aspheric grinding, and ion-beam coatings now make up 30-40% of electro-optic bill-of-materials, and germanium spot prices climbed 18% after China imposed export licensing in mid-2024. Global refined germanium output was only 155 metric tons in 2024, with China supplying about 60%, leaving Western fabs exposed to single-source risk. Long lead times approaching 24 weeks force buyers to place early commitments at premium rates, squeezing margins in industrial machine-vision and consumer electronics. Alternative chalcogenide glasses absorb more strongly in mid-wave infrared, limiting their use to non-critical commercial gear and preserving pricing power for legacy substrates. Capital equipment for diamond turning and metrology exceeds USD 2 million per line, raising barriers to entry that entrench the current optics oligopoly.
Export Control Regulations on Dual-Use EO Components
The Wassenaar Arrangement 2025 update added uncooled microbolometers with a pitch below 17 micrometers and high-performance indium-antimonide arrays to the controlled lists, extending export-license reviews to 90 days for shipments to non-allied buyers. U.S. International Traffic in Arms Regulations classify laser designators and advanced sensor-fusion software as defense articles, effectively blocking many civil-security tenders in emerging regions. Compliance overhead discourages smaller firms from bidding on overseas projects, consolidating share among incumbents that maintain dedicated trade-control teams. Meanwhile, China and other non-aligned countries have accelerated investment in domestic infrared fabs, fragmenting the market into parallel ecosystems with limited interoperability. These rules curb near-term shipment volumes for Western vendors and add cost uncertainty that complicates multi-year planning.
*Our forecasts treat driver/restraint impacts as directional, not additive. The impact forecasts reflect baseline growth, mix effects, and variable interactions.
Segment Analysis
By Product Type: Modulators Accelerate Amid Data-Center Bandwidth Boom
Modulators rank as the fastest-growing category with a 5.56% CAGR forecast as cloud operators adopt 400 Gbps and 800 Gbps coherent optical links. This shift places electro-optic modulators beside switch silicon, shrinking interconnect latency and cutting rack power consumption by 30%. Cameras retained a 37.51% revenue share in 2025, buoyed by defense-forward-looking infrared upgrades and industrial machine vision. Sensors, lasers, and ancillary optics round out the mix, each riding distinct end-use tailwinds.
Rising modulator shipments boost the electro optics market by expanding the total addressable value per server rack while lowering dollar/bit costs enough to push photonics deeper into enterprise campuses. Pluggable transceivers cede ground to co-packaged optics, tightening the supply web around foundries capable of fabricating high-yield lithium-niobate and silicon-photonic chips. Camera demand remains stable in military and safety applications but is growing more slowly than modulators, reflecting entrenched base saturation and longer replacement cycles.


By Application: Automotive ADAS Surges Past Legacy Defense Growth
Defense and security accounted for 45.37% of 2025 revenue, but automotive ADAS posted the highest CAGR at 5.73% as global safety standards reward multi-sensor redundancy. Automakers expand sensor suites from three to six EO modules per vehicle while software updates monetize added data channels. Industrial automation and healthcare imaging deliver mid-single-digit growth, whereas consumer electronics stay subdued by commoditized hardware pricing.
As the electro optics market pivots toward mobility, suppliers diversify away from cyclical defense budgets and tap the volume potential of 80 million new passenger cars per year. Regulatory timetables are clear, funding streams are private, and technology refresh intervals align with three-year model cycles, producing an attractive growth flywheel. Defense programs remain lucrative but are growing more slowly, focusing on incremental upgrades rather than greenfield buys.
By Wavelength: Short-Wave Infrared Gains Mainstream Acceptance
Mid-wave infrared contributed 31.18% of 2025 revenue, yet short-wave infrared is on track for a 5.61% CAGR, thanks to room-temperature silicon detectors that approach the cost points of visible cameras. Visible and near-infrared channels service consumer and biometric applications, while long-wave infrared remains essential for perimeter security and firefighting. Ultraviolet and terahertz niches continue to serve semiconductor metrology and non-destructive testing.
Advances in silicon-germanium photodetectors unlock 1-3 micrometer sensitivity on mature complementary metal-oxide-semiconductor lines, spurring automotive and industrial uptake. At the same time, mid-wave infrared retains battlefield dominance where thermal contrast is highest. The electro optics market therefore supports a dual-track wavelength roadmap, with cooled mid-wave arrays for mission-critical systems and uncooled short-wave sensors for mass-market platforms.

By End User: Automotive OEMs Emerge as Fastest-Growing Customers
In 2025, military agencies held a dominant 51.18% share of the electro optics market, but automotive OEMs outpaced all other customer groups with a 6.73% CAGR. Space agencies are expanding their reach, driven by high-profile telescope and lunar-lander programs aimed at advancing space exploration and scientific research. Meanwhile, industrial firms, hospitals, and consumer-device manufacturers are enjoying stable, moderate growth, supported by consistent demand and technological advancements.
Automotive procurement teams increasingly insource EO engineering talent, compressing design cycles and pushing tier-one suppliers to offer reference designs rather than black-box modules. Military buyers keep budgets intact yet focus on lifecycle support contracts. Industrial enterprises continue to roll out predictive-maintenance cameras that feed subscription analytics, fostering sticky software revenue streams beyond initial hardware sales.
Geography Analysis
North America accounted for 34.17% of 2025 revenue, energized by Department of Defense platform upgrades and National Aeronautics and Space Administration space telescope funding. Asia-Pacific is the fastest-growing region, with a 5.39% CAGR, as China scales germanium refining and South Korea ramps up 5-nanometer silicon photonics fabs. Europe tallies 22% share but leads regulatory policy, compelling suppliers to provide algorithm-explainable sensor stacks that meet forthcoming AI Act rules. In North America, defense acquisitions lock in multi-year demand for targeting pods, missile-warning sensors, and soldier systems. Commercial cloud operators center photonics R&D clusters around Silicon Valley and Oregon, nurturing modulator startups that feed hyperscale procurement roadmaps.
Asia-Pacific's growth is fueled by robust automotive production, supported by high-volume manufacturing capabilities and government-backed foundry investments, which play a critical role in driving down component costs and enhancing regional competitiveness. In China and South Korea, local sensor manufacturers are strategically targeting markets restricted by export controls, significantly altering global pricing dynamics and reshaping the competitive landscape. Meanwhile, Japanese vendors in precision optics are actively safeguarding their market share by leveraging advanced technologies to produce high-end scientific cameras and micro-optics for semiconductor lithography, ensuring their continued dominance in the sector.
Europe’s fragmented defense budgets slow regional revenue expansion, yet its stringent automotive and AI regulations position the bloc as a key standards-setter. Suppliers that align early with explainability, privacy, and sustainability clauses gain preferred-vendor status across the continent. The Middle East and Africa, as well as South America, remain smaller markets, though border surveillance and wildfire-detection projects offer specialist growth niches.


Competitive Landscape
The electro optics market displays moderate concentration; the top five suppliers control 42% of aggregate revenue, leaving a sizeable runway for mid-tier specialists. Teledyne FLIR and L3Harris Technologies leverage deep histories of platform integration and cleared facilities to anchor defense programs. Leonardo capitalizes on European fighter-jet upgrades, while Hamamatsu Photonics focuses on scientific imaging and short-wave infrared innovations. Coherent exited defense optics in August 2025, selling its unit for USD 400 million to Advent International and reallocating capital toward industrial lasers.
Silicon photonics disrupts incumbent pricing as fabless startups deliver modulators at 40% lower cost using commercial complementary metal-oxide-semiconductor lines. Yet export-control compliance and platform-qualification hurdles slow their entry into classified programs, preserving incumbent share for now. Chinese challengers such as Guangzhou SAT Infrared Technology are expanding into non-aligned regions, having set up indigenous cooled detector lines that bypass Western licensing regimes.
Strategic moves center on vertical integration, patent filings on sensor-fusion algorithms, and selective M&A to acquire specialty coating or chalcogenide-glass assets. With defense margins under pressure, several firms are pursuing commercial diversification into data-center optics, automotive safety, and industrial gas analysis markets. The resulting portfolio balancing tempers cyclicality and positions leaders for long-run growth.
Electro Optics Industry Leaders
L3Harris Technologies Inc.
Leonardo S.p.A.
Excelitas Technologies Corp.
Coherent Corp.
Hamamatsu Photonics K.K.
- *Disclaimer: Major Players sorted in no particular order

Recent Industry Developments
- December 2025: L3Harris Technologies won a U.S. Army contract for night-vision infrared and visible-light target illuminators that integrate laser designation with fused electro-optic imaging.
- October 2025: FLIR launched the M460 and M560 AI maritime cameras featuring onboard neural-network target tracking and multi-sensor payloads.
- September 2025: Hamamatsu Photonics unveiled the ORCA-Quest IQ single-photon qCMOS camera for quantum communications and biophotonics research.
- August 2025: Coherent closed the sale of its aerospace and defense electro-optics unit to Advent International for USD 400 million.


Global Electro Optics Market Report Scope
The Electro Optics Market Report is Segmented by Product Type (Cameras, Sensors, Modulators, Lasers, Other Product Type), Application (Defense and Security, Industrial Automation, Automotive ADAS, Healthcare Imaging, Consumer Electronics, Space Exploration), Wavelength (Visible Spectrum, Near-Infrared, Short-Wave Infrared, Mid-Wave Infrared, Long-Wave Infrared, Ultraviolet and Terahertz), End User (Military Agencies, Industrial Enterprises, Automotive OEMs, Hospitals and Diagnostic Centers, Consumer Product Manufacturers, Space Agencies), and Geography (North America, South America, Europe, Asia-Pacific, Middle East and Africa). The Market Forecasts are Provided in Terms of Value (USD).
| Cameras |
| Sensors |
| Modulators |
| Lasers |
| Other Product Types |
| Defense and Security |
| Industrial Automation |
| Automotive ADAS |
| Healthcare Imaging |
| Consumer Electronics |
| Space Exploration |
| Visible Spectrum |
| Near-Infrared |
| Short-Wave Infrared |
| Mid-Wave Infrared |
| Long-Wave Infrared |
| Ultraviolet and Terahertz |
| Military Agencies |
| Industrial Enterprises |
| Automotive OEMs |
| Hospitals and Diagnostic Centers |
| Consumer Product Manufacturers |
| Space Agencies |
| North America | United States | |
| Canada | ||
| Mexico | ||
| South America | Brazil | |
| Argentina | ||
| Rest of South America | ||
| Europe | United Kingdom | |
| Norway | ||
| Germany | ||
| Rest of Europe | ||
| Asia-Pacific | China | |
| India | ||
| Japan | ||
| South Korea | ||
| Rest of Asia-Pacific | ||
| Middle East and Africa | Middle East | Saudi Arabia |
| United Arab Emirates | ||
| Rest of Middle East | ||
| Africa | South Africa | |
| Egypt | ||
| Rest of Africa | ||
| By Product Type | Cameras | ||
| Sensors | |||
| Modulators | |||
| Lasers | |||
| Other Product Types | |||
| By Application | Defense and Security | ||
| Industrial Automation | |||
| Automotive ADAS | |||
| Healthcare Imaging | |||
| Consumer Electronics | |||
| Space Exploration | |||
| By Wavelength | Visible Spectrum | ||
| Near-Infrared | |||
| Short-Wave Infrared | |||
| Mid-Wave Infrared | |||
| Long-Wave Infrared | |||
| Ultraviolet and Terahertz | |||
| By End User | Military Agencies | ||
| Industrial Enterprises | |||
| Automotive OEMs | |||
| Hospitals and Diagnostic Centers | |||
| Consumer Product Manufacturers | |||
| Space Agencies | |||
| By Geography | North America | United States | |
| Canada | |||
| Mexico | |||
| South America | Brazil | ||
| Argentina | |||
| Rest of South America | |||
| Europe | United Kingdom | ||
| Norway | |||
| Germany | |||
| Rest of Europe | |||
| Asia-Pacific | China | ||
| India | |||
| Japan | |||
| South Korea | |||
| Rest of Asia-Pacific | |||
| Middle East and Africa | Middle East | Saudi Arabia | |
| United Arab Emirates | |||
| Rest of Middle East | |||
| Africa | South Africa | ||
| Egypt | |||
| Rest of Africa | |||


Key Questions Answered in the Report
What is the current size of the electro optics market?
The electro optics market size is USD 13.39 billion in 2026 and is expected to reach USD 16.57 billion by 2031.
Which product category will grow fastest through 2031?
Modulators will post the strongest growth, advancing at a 5.56% CAGR as data centers shift to 400 Gbps and 800 Gbps optical links.
Why is short-wave infrared attracting attention?
Room-temperature silicon-based SWIR sensors are approaching visible-camera price points, promoting adoption in automotive, industrial, and machine-vision applications.
Which region is projected to grow the quickest?
Asia-Pacific leads regional growth with a 5.39% CAGR, supported by foundry investments in China and South Korea and high automotive production volumes.
How concentrated is supplier power in this market?
The top five vendors hold roughly 42% of revenue, indicating moderate concentration and room for niche specialists to thrive.
What is driving automotive demand for electro-optic sensors?
Regulatory roadmaps in the United States and Europe mandate advanced driver-assistance safety features, pushing OEMs to embed multiple infrared cameras for robust perception under all lighting conditions.
Page last updated on:


