Ecotoxicological Studies Market Size and Share
Market Overview
| Study Period | 2020 - 2031 |
|---|---|
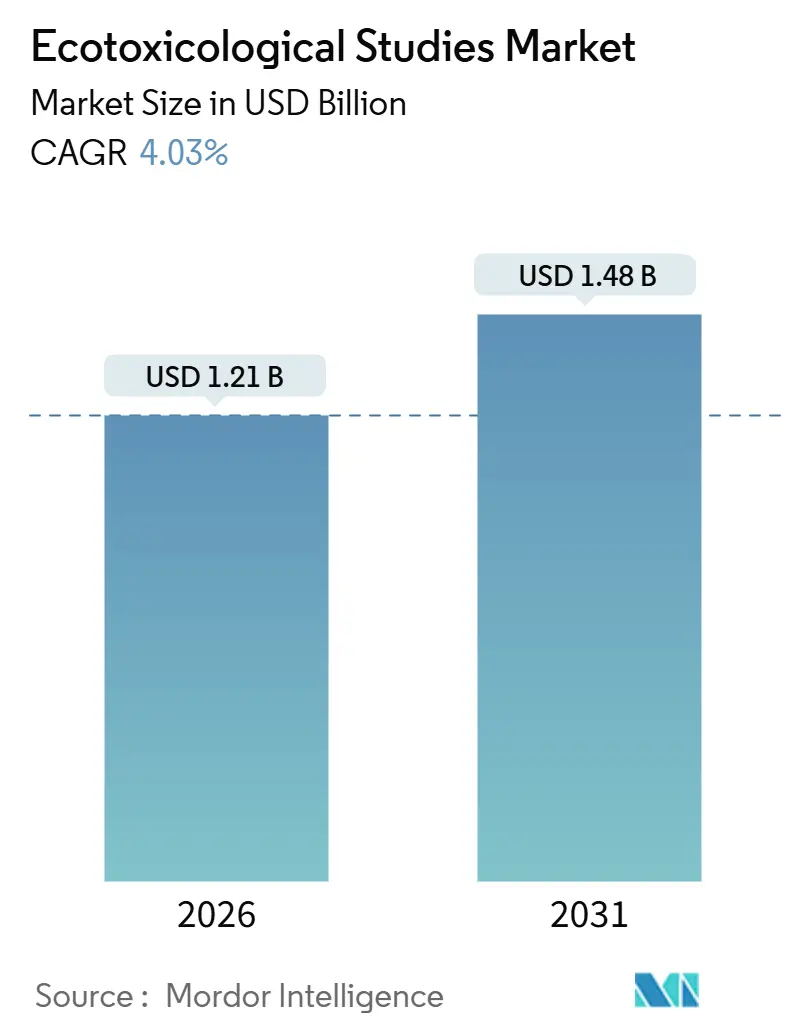
| Market Size (2026) | USD 1.21 Billion |
| Market Size (2031) | USD 1.48 Billion |
| Growth Rate (2026 - 2031) | 4.03% CAGR |
| Fastest Growing Market | Asia Pacific |
| Largest Market | Europe |
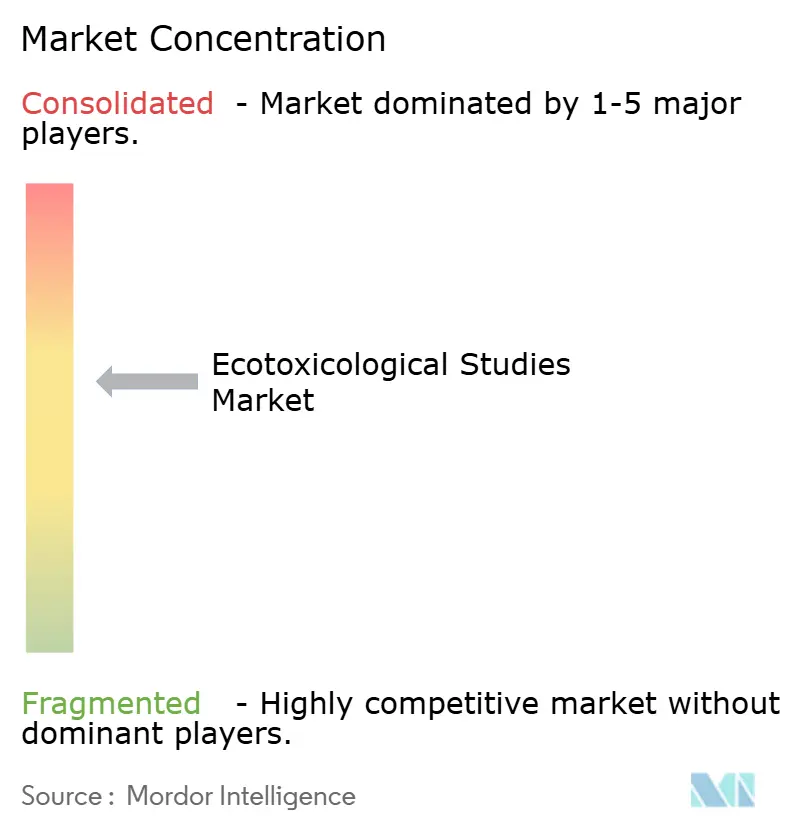
| Market Concentration | Medium |
Major Players *Disclaimer: Major Players sorted in no particular order Image © Mordor Intelligence. Reuse requires attribution under CC BY 4.0. | |
Ecotoxicological Studies Market Analysis by Mordor Intelligence
The Ecotoxicological Studies Market size is estimated at USD 1.21 billion in 2026, and is expected to reach USD 1.48 billion by 2031, at a CAGR of 4.03% during the forecast period (2026-2031).
Growing regulatory scrutiny and expanding ESG reporting are widening the testing funnel, yet capacity shortages at Good Laboratory Practice (GLP) hatcheries and the high cost of chronic multi-trophic protocols are holding back throughput. Europe’s tighter REACH rules, the United States Environmental Protection Agency’s (EPA) broader Toxic Substances Control Act (TSCA) inventory, and Japan’s sediment-toxicity mandate are driving steady demand, while municipal utilities and polymer makers accelerate orders ahead of 2026 drinking-water microplastic limits. Contract research organizations (CROs) are therefore juggling a rising volume of short-cycle screening assays with a backlog of vertebrate studies that can take 18 months or longer. Competitive differentiation is shifting toward automated analytics, artificial-intelligence (AI) platforms, and organism-type specialization, allowing mid-sized laboratories to win share despite the presence of global leaders. Sponsors view the market as nondiscretionary spend, insulating revenues from broader industrial slowdowns.
Key Report Takeaways
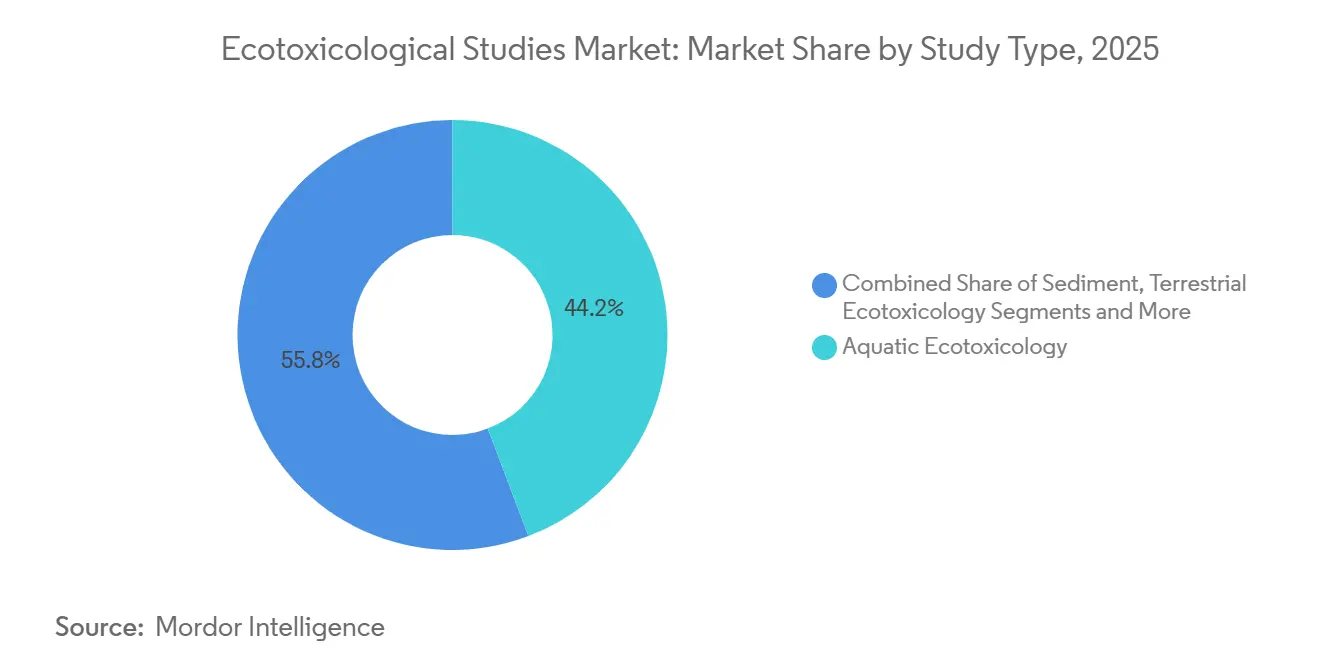
- By Study Type, Aquatic protocols captured 44.25% of the ecotoxicological studies market share in 2025, and pollinator assays are forecast to expand at a 6.26% CAGR through 2031.
- By Test Method, In vivo testing generated 55.14% of 2025 revenue, while in-silico modeling is projected to grow at a 7.77% CAGR to 2031.
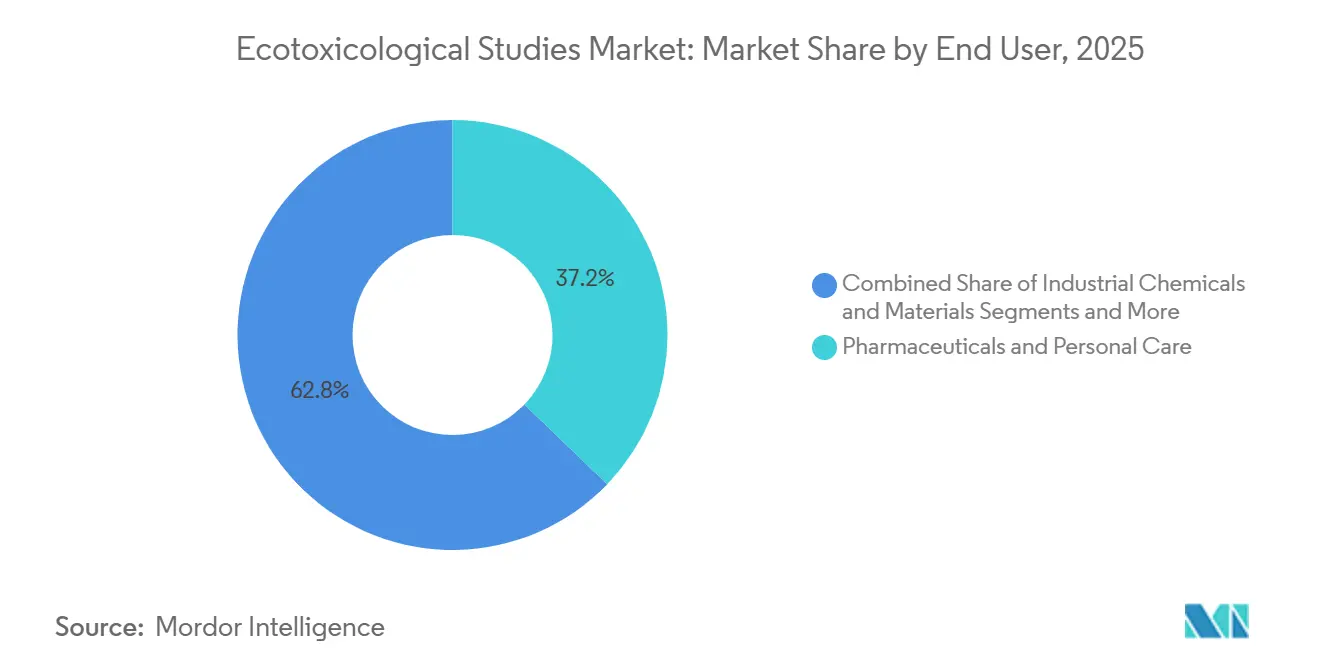
- By end-user industry, Pharmaceutical and personal-care companies accounted for 37.22% of 2025 revenue; wastewater agencies represent the fastest-growing end-use at an 8.63% CAGR.
- By organism Type, Fish studies held 41.67% of 2025 revenue, yet terrestrial invertebrates and pollinators are rising at a 6.13% CAGR to 2031.
- By region, Europe led with 31.44% of 2025 value; Asia-Pacific is set for the quickest regional expansion at a 6.82% CAGR through 2031.
Note: Market size and forecast figures in this report are generated using Mordor Intelligence’s proprietary estimation framework, updated with the latest available data and insights as of January 2026.
Global Ecotoxicological Studies Market Trends and Insights
Drivers Impact Analysis*
| Driver | (~) % Impact on CAGR Forecast | Geographic Relevance | Impact Timeline |
|---|---|---|---|
| Stricter Global Environmental Regulations | +0.9% | Global, with EU and North America leading | Long term (≥ 4 years) |
| Rising Chemical Production in Emerging Economies | +0.7% | Asia-Pacific core, spillover to Middle East & Africa | Medium term (2-4 years) |
| Shift Toward Non-Animal Alternative Test Methods | +0.6% | North America & EU, early adoption in Japan | Medium term (2-4 years) |
| Corporate ESG & Sustainability Disclosure Mandates | +0.5% | Global, concentrated in OECD markets | Short term (≤ 2 years) |
| Microplastic-Specific Monitoring Rules | +0.4% | EU and North America, emerging in Asia-Pacific | Long term (≥ 4 years) |
| AI-Driven Eco-Toxicogenomics Adoption in Early R&D | +0.3% | North America & EU pharmaceutical hubs | Medium term (2-4 years) |
| Source: Mordor Intelligence | |||
Stricter Global Environmental Regulations
The European Chemicals Agency (ECHA) lowered the REACH tonnage threshold for aquatic-toxicity data from 10 tonnes to 1 tonne in 2025, effectively doubling the number of required dossiers.[1]European Chemicals Agency, “REACH Annexes VII–X Update 2025,” ECHA, echa.europa.euEPA expanded the TSCA priority list by 1,200 chemicals in 2024, compelling Tier 1 aquatic and terrestrial screens for each substance.[2]U.S. Environmental Protection Agency, “TSCA Priority Substances Expansion,” EPA, epa.gov Japan imposed sediment-toxicity tests on persistent organic pollutants starting April 2025. These overlapping rules create a baseline of mandatory testing and keep CRO order books full even during economic slowdowns. However, they also magnify capacity constraints because many protocols still require live vertebrates and GLP hatchery supply.
Rising Chemical Production in Emerging Economies
Asia-Pacific chemical output grew 8.2% year-on-year in 2025, more than twice the global rate.[3]Organisation for Economic Co-operation and Development, “Global Chemical Outlook,” OECD, oecd.org China’s Ministry of Ecology and Environment now obliges full aquatic and terrestrial data for every new notification, while India’s draft effluent rules call for chronic Daphnia and algae tests. South Korea’s K-REACH added 350 priority substances in 2025 with a 24-month testing deadline. Local labs are scaling GLP capacity, yet many multigeneration studies still move to Europe or North America, redirecting a sizeable slice of emerging-market demand to established global CROs.
Shift Toward Non-Animal Alternative Test Methods
OECD Test Guideline 249 for fish embryo toxicity and the U.S. FDA Modernization Act 2.0 collectively opened the door to cell-based assays, organ-on-chip systems, and computational models. Charles River Laboratories teamed up with Toxys in 2025 to offer the ReproTracker in-vitro platform, sidestepping the 21-day fish reproduction study and cutting cost per substance from roughly USD 80,000 to USD 50,000. Sponsors are increasingly filing hybrid dossiers that blend quantitative structure–activity relationship (QSAR) outputs with targeted in-vitro confirmation, trimming study timelines by around 40%. Regulatory ambiguity remains, but the direction of travel clearly favors reductions in vertebrate use.
Corporate ESG & Sustainability Disclosure Mandates
The European Union’s Corporate Sustainability Reporting Directive brings about 50,000 companies into mandatory pollution disclosure from fiscal 2024 onwards. BASF’s 2025 report showed ecotoxicity tests for 92% of new agrochemical formulations, up from 68% two years earlier. Unilever lifted third-party ecotoxicology spend by 15% in 2024 to track microplastic alternatives in personal-care products. Early-stage screening assays are therefore rising faster than full chronic studies, compressing average revenue per project but widening the overall volume of booked work.
Restraints Impact Analysis*
| Restraint | (~) % Impact on CAGR Forecast | Geographic Relevance | Impact Timeline |
|---|---|---|---|
| High Cost & Long Duration of Chronic Multi-Trophic Studies | -0.5% | Global, acute in North America & EU | Long term (≥ 4 years) |
| Regulatory Ambiguity Around Vertebrate Testing Reductions | -0.3% | North America & EU | Medium term (2-4 years) |
| Climate-Driven Shortage of GLP Fish-Hatchery Supply | -0.3% | North America & EU, emerging in Asia-Pacific | Short term (≤ 2 years) |
| Data-Sharing Limits on Proprietary Omics Datasets | -0.2% | Global, concentrated in pharmaceutical hubs | Medium term (2-4 years) |
| Source: Mordor Intelligence | |||
High Cost & Long Duration of Chronic Multi-Trophic Studies
Protocols such as OECD 210 for fish early-life-stage toxicity can exceed USD 150,000 and require 12–18 months to finish, straining R&D budgets. Labcorp reports that chronic Daphnia studies form 22% of its volume but only 14% of revenue because of fixed labor costs and continuous organism husbandry. Sponsors respond by running tiered strategies that start with QSAR screens and only proceed to definitive tests if early indicators show concern, reducing the pool of full-battery studies and eroding CRO margins for these labor-intensive projects.
Regulatory Ambiguity Around Vertebrate Testing Reductions
ECHA’s 2024 integrated-testing guidance says alternative data “may” replace in-vivo endpoints if reliability is equivalent, yet offers no numeric benchmark. EPA still calls for fish acute-toxicity tests (OECD 203) on every new pesticide active ingredient. Multinationals therefore fund parallel in-vivo and in-vitro work as regulatory insurance, duplicating cost and diluting the savings promised by non-animal methods.
*Our forecasts treat driver/restraint impacts as directional, not additive. The impact forecasts reflect baseline growth, mix effects, and variable interactions.
Segment Analysis
By Study Type: Aquatic Protocols Dominate, Pollinator Assays Accelerate
Aquatic protocols commanded 44.25% of the ecotoxicological studies market share in 2025, underpinned by the universal use of OECD 201, 202, and 203 in chemical registrations. Pollinator testing is climbing at a 6.26% CAGR because the European Food Safety Authority now requires bumble- and solitary-bee chronic data for all new insecticides. The aquatic tranche will remain the largest through 2031, yet its growth is converging toward the market average as sponsors switch adult fish tests for embryo assays.
Sediment studies are also rising, thanks to European sediment-quality targets and microplastic rules that emphasize benthic endpoints. In contrast, avian work is stable to declining because validated in-vitro screens now cover many developmental endpoints once reserved for bird studies. CROs that specialize in pollinator colonies or sediment organisms are winning niche projects that larger labs often pass over, widening the ecosystem of mid-tier providers.


By Test Method: In-Silico Uptake Outpaces, In-Vivo Still Dominates
In-vivo assays delivered 55.14% of 2025 revenue, yet in-silico models are advancing at a 7.77% CAGR and represent the fastest-growing method segment. EPA’s March 2025 update of the CompTox Dashboard added predictive models for algal growth inhibition and fish embryo endpoints, achieving 85% concordance with live-organism results. In-vitro systems, such as fish gill cell-line assays, offer 72-hour turnarounds at roughly one-tenth of in-vivo costs, supporting steady adoption.
Field and mesocosm studies remain a high-value niche for post-registration monitoring. Sponsors like Bayer now screen 40% of early-stage molecules exclusively through in-silico filters before any laboratory exposure, trimming pipelines early and lowering downstream demand. Regulatory acceptance remains the main brake on wider in-silico use, yet once decision rules crystalize, annual growth could push into double digits.
By End-Use Industry: Wastewater Agencies Lead Growth, Pharma Holds Share
Pharmaceutical and personal-care companies controlled 37.22% of 2025 revenue, reflecting mandatory environmental-risk assessments for active ingredients in Europe and the United States. Wastewater utilities are growing fastest at an 8.63% CAGR, prompted by PFAS, microplastic, and drug-residue monitoring under upcoming 2026 standards. Agrochemical demand is solid but slowing as new active-ingredient pipelines shrink.
Industrial-chemical volumes continue to edge up, driven by REACH deadlines and China’s enlarged substance inventory. Academic institutes contribute only a small slice, focused on method development rather than routine screening. Over the forecast, wastewater obligations will shift the revenue mix toward municipalities and polymer manufacturers even as pharmaceuticals keep their leading share.
By Organism Type: Fish Still Lead, Invertebrates Gain Momentum
Fish retained 41.67% of 2025 revenue, anchored by OECD 203, 210, and 229 protocols. Terrestrial invertebrates and pollinators are expanding at a 6.13% CAGR, propelled by new European bee guidance. Aquatic invertebrates remain essential for Tier 1 screens, while algae and aquatic plants, though vital for hazard classification, contribute modest value because their tests are inexpensive and quick.
Climate-driven hatchery shortages are nudging sponsors toward fish embryo assays that need fewer live adults, easing ethical pressure and mitigating supply bottlenecks. Birds continue to lose share as in-vitro replacements mature. By 2031, fish will still command the single-largest slice, but the growth rate gap with invertebrates will keep narrowing.
Geography Analysis
Europe generated 31.44% of 2025 market value, underpinned by dense GLP infrastructure and REACH’s expanding data requirements. Germany, France, and the United Kingdom host roughly 60% of regional capacity. The Corporate Sustainability Reporting Directive is boosting demand for rapid screening assays as companies embed ecotoxicity earlier in product design. Southern-European labs are scaling up, leveraging lower labor costs and proximity to Mediterranean pharma clusters.
Asia-Pacific is poised for a 6.82% CAGR through 2031, the quickest regional pace. China’s updated chemical-management measures and India’s draft effluent rules have multiplied testing obligations and sparked local capacity builds. Japan and South Korea retain mature GLP networks but still outsource complex multigeneration studies to Europe or North America. Australia aligns closely with OECD guidelines and serves as a testing hub for Southeast Asia.
North America remains a major revenue pool, fueled by the expanded TSCA inventory and FDA environmental-risk directives. Canada mirrors REACH-style needs but works on shorter timetables. Mexico is harmonizing with U.S. standards, lifting demand among maquiladora chemical producers. South America and the Middle East together comprise less than 15% of value, constrained by scarce accredited labs and heavy reliance on imported testing services.


Competitive Landscape
The key players includes Eurofins Scientific, Charles River Laboratories, SGS, Bureau Veritas, and Labcorp, giving the ecotoxicological studies market a moderate concentration profile. Charles River’s 2025 portfolio review signaled a pivot toward in-vitro and computational offerings, aiming to exit high-cost vertebrate assays. Eurofins reported 4.8% growth in environmental testing for the first nine months of 2024 but cited weakness in agro-science orders.
Niche players thrive through specialization. Ibacon maintains the largest GLP earthworm and springtail colonies in Europe, cornering terrestrial contracts. Pace Analytical expanded PFAS ecotoxicity services in 2025 to capture wastewater demand. Technology is becoming decisive: labs that deploy automated imaging for Daphnia reproduction or machine-learning analytics for fish behavior can shave labor costs by up to 30%, a crucial edge as sponsors push for fixed-price deals. OECD GLP certification remains a hard gate, yet new accreditations in China, India, and South Korea are eroding the historical premium enjoyed by Western labs.
Ecotoxicological Studies Industry Leaders
Charles River Laboratories
Eurofins Scientific
Labcorp
Smithers
SGS SA
- *Disclaimer: Major Players sorted in no particular order

Recent Industry Developments
- October 2025: Charles River Laboratories partnered with Toxys to roll out the ReproTracker in-vitro assay, enabling endocrine-disruption screens without live fish and trimming study timelines by roughly 40%.
- October 2025: EPA updated the CompTox Dashboard with QSAR models for algal growth inhibition and fish embryo toxicity, expanding the database by 2,400 substances.
- August 2025: Vivo Bio Tech secured an INR 10.75-crore (USD 1.3 million) contract to run full pre-clinical safety, mutagenicity, and ecotoxicology studies for an Indian pharma–agrochemical client, with submissions slated to India’s Central Insecticides Board & Registration Committee.


Global Ecotoxicological Studies Market Report Scope
Ecotoxicological studies examine the harmful effects of pollutants on ecosystems, integrating ecology and toxicology to assess and predict their impact on organisms, populations, and the environment.
The Ecotoxicological Studies Market Report is segmented by Study Type, Test Method, End-Use Industry, Organism Type, and Geography. By Study Type, the market is segmented into Aquatic, Sediment, Terrestrial, Avian, and Pollinator Testing. By Test Method, the market is segmented into In Vivo, In Vitro, In Silico, and Field & Mesocosm Studies. By End-Use Industry, the market is segmented into Agrochemicals, Industrial Chemicals, Pharmaceuticals & Personal Care, Wastewater & Environmental Agencies, and Academic & Research Institutes. By Organism Type, the market is segmented into Fish, Aquatic Invertebrates, Algae & Aquatic Plants, Sediment/Benthic Organisms, Terrestrial Invertebrates & Pollinators, and Birds. By Geography, the market is segmented into North America, Europe, Asia-Pacific, Middle East & Africa, and South America. The market report also covers the estimated market sizes and trends for 17 countries across major regions globally. Market Forecasts are Provided in Terms of Value (USD).
| Aquatic Ecotoxicology |
| Sediment Ecotoxicology |
| Terrestrial Ecotoxicology |
| Avian Ecotoxicology |
| Pollinator Testing |
| In Vivo Testing |
| In Vitro Testing |
| In Silico / Computational Modelling |
| Field & Mesocosm Studies |
| Agrochemicals |
| Industrial Chemicals & Materials |
| Pharmaceuticals & Personal Care |
| Waste-water & Environmental Agencies |
| Academic & Research Institutes |
| Fish |
| Aquatic Invertebrates |
| Algae & Aquatic Plants |
| Sediment / Benthic Organisms |
| Terrestrial Invertebrates & Pollinators |
| Birds |
| North America | United States |
| Canada | |
| Mexico | |
| Europe | Germany |
| France | |
| United Kingdom | |
| Italy | |
| Spain | |
| Rest of Europe | |
| Asia-Pacific | China |
| Japan | |
| India | |
| South Korea | |
| Australia | |
| Rest of Asia-Pacific | |
| Middle East & Africa | GCC |
| South Africa | |
| Rest of Middle East & Africa | |
| South America | Brazil |
| Argentina | |
| Rest of South America |
| By Study Type | Aquatic Ecotoxicology | |
| Sediment Ecotoxicology | ||
| Terrestrial Ecotoxicology | ||
| Avian Ecotoxicology | ||
| Pollinator Testing | ||
| By Test Method | In Vivo Testing | |
| In Vitro Testing | ||
| In Silico / Computational Modelling | ||
| Field & Mesocosm Studies | ||
| By End-Use Industry | Agrochemicals | |
| Industrial Chemicals & Materials | ||
| Pharmaceuticals & Personal Care | ||
| Waste-water & Environmental Agencies | ||
| Academic & Research Institutes | ||
| By Organism Type | Fish | |
| Aquatic Invertebrates | ||
| Algae & Aquatic Plants | ||
| Sediment / Benthic Organisms | ||
| Terrestrial Invertebrates & Pollinators | ||
| Birds | ||
| By Geography | North America | United States |
| Canada | ||
| Mexico | ||
| Europe | Germany | |
| France | ||
| United Kingdom | ||
| Italy | ||
| Spain | ||
| Rest of Europe | ||
| Asia-Pacific | China | |
| Japan | ||
| India | ||
| South Korea | ||
| Australia | ||
| Rest of Asia-Pacific | ||
| Middle East & Africa | GCC | |
| South Africa | ||
| Rest of Middle East & Africa | ||
| South America | Brazil | |
| Argentina | ||
| Rest of South America | ||


Key Questions Answered in the Report
What is the current value of the ecotoxicological studies market?
The ecotoxicological studies market size is USD 1.21 billion in 2026 and is projected to reach USD 1.48 billion by 2031.
Which study type holds the largest revenue share?
Aquatic protocols lead with 44.25% of 2025 revenue.
Which region is growing the fastest?
Asia-Pacific is projected to expand at a 6.82% CAGR through 2031.
Why are wastewater agencies increasing their testing spend?
New PFAS and microplastic limits in 2026 drinking-water standards are driving an 8.63% CAGR in testing demand from municipal utilities.
How are CROs responding to vertebrate testing constraints?
Leading laboratories are adopting in-vitro assays and in-silico models, reducing live-animal use and shortening study timelines.
What technological shift offers the highest growth potential?
AI-driven eco-toxicogenomics, which integrates omics data with adverse-outcome pathways, is the fastest-growing test method segment.
Page last updated on:


