Ecotourism Market Size and Share
Market Overview
| Study Period | 2020 - 2031 |
|---|---|
| Market Size (2026) | USD 354.94 Billion |
| Market Size (2031) | USD 561.13 Billion |
| Growth Rate (2026 - 2031) | 9.59% CAGR |
| Fastest Growing Market | Asia-Pacific |
| Largest Market | Europe |
| Market Concentration | Medium |
Major Players *Disclaimer: Major Players sorted in no particular order Image © Mordor Intelligence. Reuse requires attribution under CC BY 4.0. | |
Ecotourism Market Analysis by Mordor Intelligence
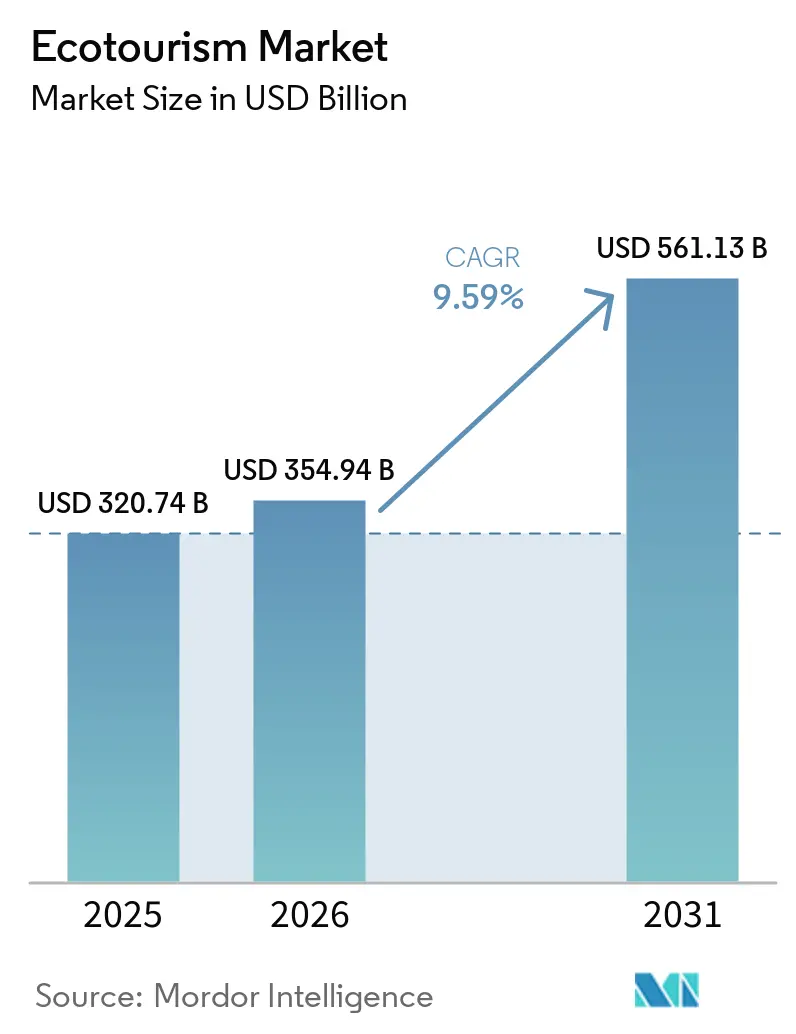
The Ecotourism Market size is projected to expand from USD 320.74 billion in 2025 and USD 354.94 billion in 2026 to USD 561.13 billion by 2031, registering a CAGR of 9.59% between 2026 to 2031.
The ecotourism market is expanding on the back of protected-area investment, changing post-pandemic travel priorities, and tighter scrutiny of unverified sustainability claims across leisure travel. Government-backed conservation and community-tourism programs are also giving the ecotourism market a more durable supply base than many other travel formats, because they connect tourism growth with rural jobs, local enterprise, and protected-land management. At the same time, stronger certification frameworks and evidence rules are making credibility a larger commercial advantage, especially where platform visibility and booking conversion depend on verified standards rather than broad environmental claims. Growth is also being shaped by technology, as digital discovery, AI-led trip planning, and direct booking tools are improving access to lesser-known destinations while helping operators reduce their dependence on intermediaries. Even so, the ecotourism market still faces clear limits from premium pricing, weak last-mile infrastructure, and carrying-capacity controls that restrict revenue growth at fragile destinations despite healthy demand.[1]Global Sustainable Tourism Council, “GSTC Tour Operator Standard,” GSTC, gstc.org
Key Report Takeaways
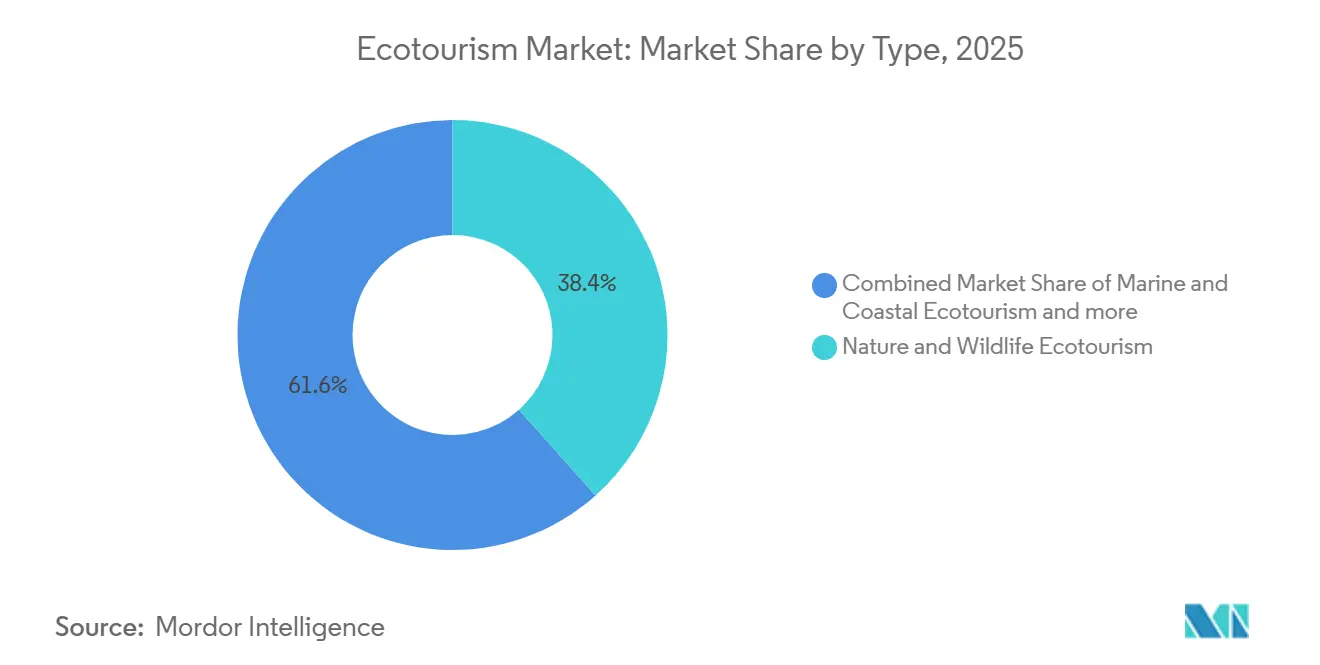
- By type, Nature & Wildlife Ecotourism held 38.42% of the ecotourism market share in 2025, while Marine & Coastal Ecotourism is forecast to grow at a 10.74% CAGR through 2031.
- By travel party, Group travel accounted for 59.94% of revenue in 2025, while Solo travel is projected to expand at a 10.43% CAGR through 2031.
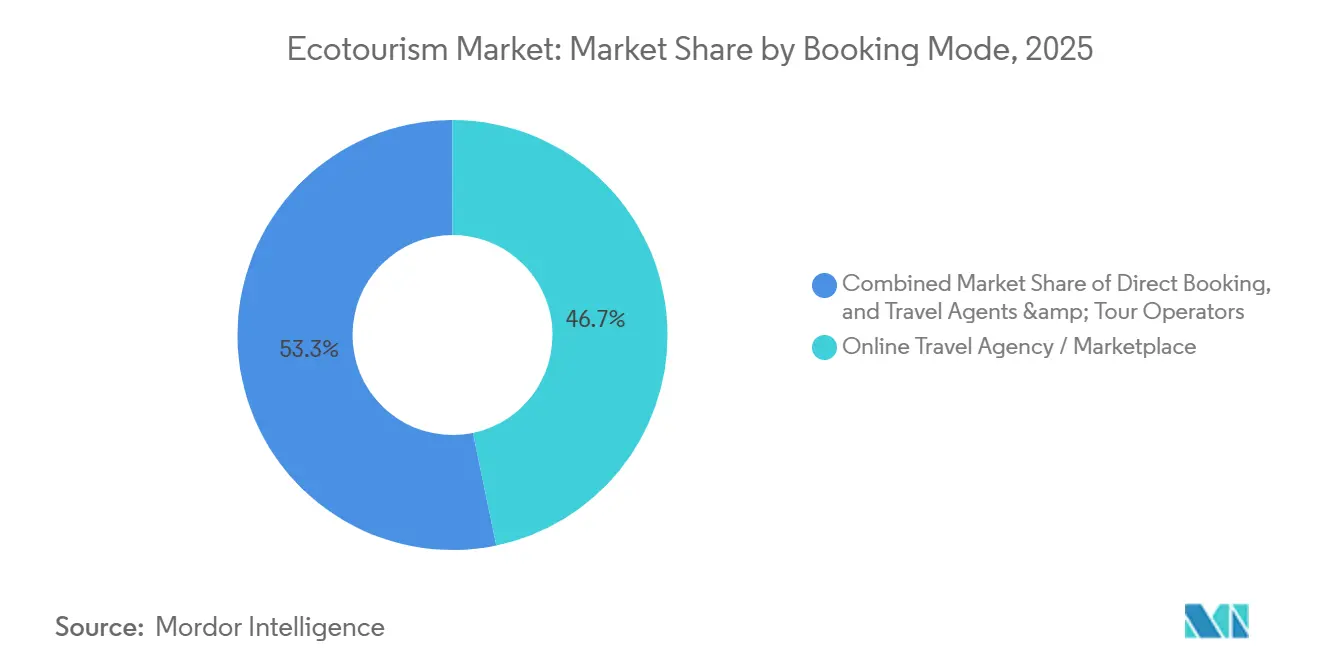
- By booking mode, Online Travel Agencies and Marketplaces accounted for 46.73% of bookings in 2025, while Direct bookings are expected to record the fastest growth at a 10.84% CAGR through 2031.
- By accommodation type, Eco-lodges accounted for 35.54% of revenue in 2025, while Glamping is set to grow at a 10.12% CAGR through 2031.
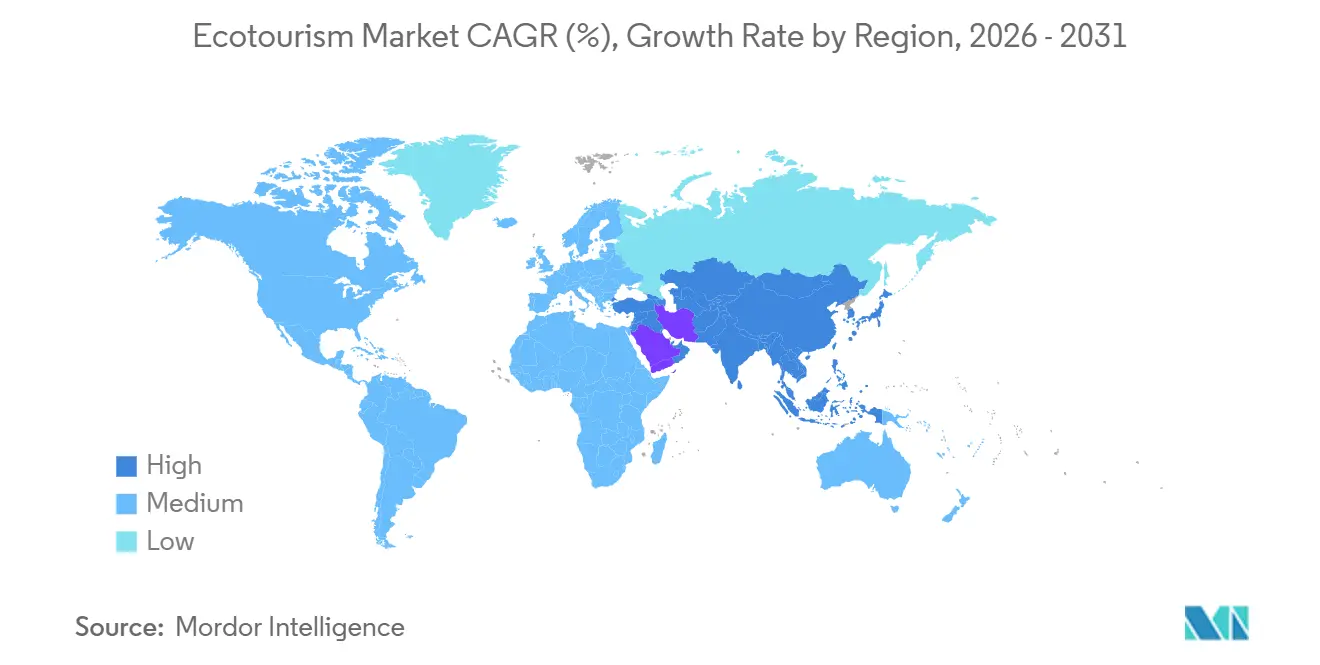
- By geography, Europe accounted for 33.75% of the ecotourism market in 2025, while Asia-Pacific is forecast to grow at a 10.75% CAGR through 2031.
Note: Market size and forecast figures in this report are generated using Mordor Intelligence’s proprietary estimation framework, updated with the latest available data and insights as of January 2026.
Global Ecotourism Market Trends and Insights
Drivers Impact Analysis*
| Drivers | (~) % Impact on CAGR Forecast | Geographic Relevance | Impact Timeline |
|---|---|---|---|
| Demand for Authentic, Low-Impact Nature Travel | +1.9% | Global | Medium term (2-4 years) |
| Rising Eco-Conscious Traveler Base | +1.7% | Global, concentrated in North America & Europe | Medium term (2-4 years) |
| Protected-Area and Community-Tourism Policy Support | +1.4% | APAC, MEA, South America | Long term (≥ 4 years) |
| Expansion of Eco-Lodges and Sustainable Stays | +1.5% | APAC, South America, MEA | Medium term (2-4 years) |
| Third-Party Sustainability Certification-Led Booking Conversion | +1.1% | Europe, North America | Short term (≤ 2 years) |
| AI-Led Dispersion to Less-Crowded Nature Destinations | +0.8% | Global | Short term (≤ 2 years) |
| Source: Mordor Intelligence | |||
Demand for Authentic, Low-Impact Nature Travel
The ecotourism market is benefiting from a durable shift toward nature-led travel that feels more immersive and less extractive than standard leisure products. Travelers are placing greater value on experiences tied to wildlife, landscapes, local communities, and visible conservation outcomes, which lifts demand for guided formats that can demonstrate authenticity rather than claim it. This shift also supports higher trip value, because low-impact travel often includes smaller groups, deeper local engagement, and more specialized itineraries than mass tourism alternatives. The demand pattern is especially favorable for operators that can clearly verify conservation contributions, community benefit-sharing, and responsible operating practices. As a result, the ecotourism market is seeing stronger conversion rates when product design, destination governance, and transparency work together rather than relying solely on broad green positioning.
Rising Eco-Conscious Traveler Base
The ecotourism market is no longer shaped solely by younger travelers, as environmentally aware travel behavior is spreading across age groups and income brackets. Avoiding overcrowded places, preferring off-peak travel, and seeking lower-impact itineraries are expanding the addressable customer base for nature-led operators. This matters because older and higher-income travelers often convert interest into confirmed bookings at a stronger rate, which improves yield for premium ecotourism products. In Asia-Pacific, experience authenticity remains a more immediate trigger than certification alone, which means the strongest offers combine a credible nature or community outcome with a booking journey that feels simple and trustworthy. That broadening traveler base gives the ecotourism market a wider demand foundation, while also pushing operators to refine product mix, pricing, and distribution strategy.
Protected-Area and Community-Tourism Policy Support
The ecotourism market is benefiting from public policies that treat nature-based tourism as a rural development tool rather than a narrow conservation add-on. In Laos, the World Bank-backed incentive program linked forest-area tourism growth with advisory support, public infrastructure, and enterprise development, with the stated aim of creating significant job opportunities, mainly for women, while raising the economic role of nature tourism. Vietnam’s February 2024 national plan also set a target to increase forest ecotourism revenue by 50% by 2030 through a National Park Passport model spanning 34 parks, which shows how ecotourism supply is being formalized through national planning rather than left to fragmented local initiatives. These frameworks lower entry barriers for private operators by improving access, visibility, and local participation models. They also make the ecotourism market more resilient, because community benefit-sharing and public infrastructure create a stronger base for long-term destination development.[2]World Bank, “New Incentives for Nature-Based Tourism Investment in Lao Forests,” World Bank, worldbank.org
Expansion of Eco-Lodges and Sustainable Stays
The ecotourism market is also supported by the steady expansion of accommodation formats designed for low-impact operations and place-based experiences. Eco-lodges, community stays, and other sustainable properties give remote destinations a bookable product that matches conservation-led travel demand, which is necessary for turning traveler intent into actual arrivals. Official and operator-led examples show why this matters, because revenue-sharing and responsible design are increasingly tied to local legitimacy and long-term marketability. Uakari Lodge in Brazil’s Mamirauá Sustainable Development Reserve transferred BRL 607,688 to the local ecotourism assistants’ association in 2025, its highest amount in 4 years, demonstrating how accommodation can serve as both tourism infrastructure and a direct community revenue channel. This type of supply expansion increases the reach of the ecotourism market by bringing more certified, locally anchored inventory into circulation across rural, biodiversity-rich destinations.
Restraints Impact Analysis*
| Restraints | (~) % Impact on CAGR Forecast | Geographic Relevance | Impact Timeline |
|---|---|---|---|
| Premium Pricing Versus Conventional Leisure Travel | -1.5% | Global | Long term (≥ 4 years) |
| Limited Transport and Visitor Infrastructure in Remote Sites | -1.2% | APAC, MEA, South America | Long term (≥ 4 years) |
| Anti-Greenwashing Evidence Rules Raise Compliance Burden | -0.8% | Europe, North America | Short term (≤ 2 years) |
| Carrying-Capacity Limits in Fragile Destinations | -1.0% | Europe, APAC, South America | Medium term (2-4 years) |
| Source: Mordor Intelligence | |||
Premium Pricing Versus Conventional Leisure Travel
The ecotourism market still carries a clear price barrier, because responsible packages often cost 20% to 30% more than comparable conventional leisure trips. That gap reflects structural cost drivers such as smaller group sizes, trained guiding, certified accommodation, conservation payments, and community benefit-sharing arrangements that cannot be compressed without changing the product itself. The pressure is strongest in middle-income source markets where interest in nature-led travel is rising, but discretionary budgets remain sensitive to trip pricing. Operators that depend on third-party supply chains also face additional margin compression, as each additional service layer adds cost without always delivering visible value to the traveler. This leaves the ecotourism market with a strong premium segment but a still underdeveloped middle layer that many operators have not yet effectively reached.
Limited Transport and Visitor Infrastructure in Remote Sites
The ecotourism market faces a structural bottleneck in remote destinations where biodiversity is high but access and visitor infrastructure remain weak. Poor roads, limited air connectivity, unstable power, weak waste systems, and low-quality visitor facilities can delay or prevent product development even when demand potential is clear. The World Bank’s Laos program recognized this directly by combining tourism investment incentives with support for enabling infrastructure and enterprise readiness, showing that private capital alone cannot solve frontier-destination access problems. Where this public baseline is missing, logistics costs remain high, and multi-day itineraries remain difficult to deliver at scale. That is why infrastructure weakness still limits how much of the ecotourism market can be translated from latent interest into a certified, saleable, and repeatable product.
*Our forecasts treat driver/restraint impacts as directional, not additive. The impact forecasts reflect baseline growth, mix effects, and variable interactions.
Segment Analysis
By Type: Wildlife Corridors Anchor Volume, Ocean Ecosystems Drive the Growth Frontier
Nature & Wildlife Ecotourism commanded 38.42% of the global market in 2025, and this segment remains the clearest volume anchor within the ecotourism industry. Its lead rests on the durable appeal of guided wildlife viewing in regulated protected areas, where governance, conservation narratives, and specialist guiding are already established. The format also benefits from strong repeat appeal, because wildlife corridors, tiger reserves, and biodiversity lodges offer seasonal and location-based variation that urban travel formats often cannot match. Forest & Mountain Ecotourism and Agri-Ecotourism serve a different travel motive, centered more on landscape immersion, slower travel, and rural production systems than on high-intensity wildlife sightings. Conservation & Educational Ecotourism is also gaining ground as travelers increasingly seek itineraries that connect tourism spend with visible ecological learning, community participation, or field-based activities.
Marine & Coastal Ecotourism is the fastest-growing type segment, with the ecotourism market size for this segment projected to expand at a 10.74% CAGR through 2031. Growth is being supported by the view that marine protection can strengthen tourism economics when conservation, reef health, and visitor management are aligned. The Coastal Tourism Breakthrough initiative has set a target of mobilizing USD 30 billion in annual investment by 2030 to cut emissions and protect marine ecosystems, which gives marine ecotourism stronger institutional backing as a standalone investment theme. Blue Alliance’s reef-positive tourism model in Indonesia further demonstrates how ecotourism supply, marine protection, and impact finance are increasingly aligning within a single operating structure. This leaves the ecotourism market with a type mix where wildlife-led products anchor scale, while ocean-linked formats offer some of the clearest upside for future expansion.[3]Ocean Breakthroughs, “Coastal Tourism Breakthrough,” Ocean Breakthroughs, ocean-breakthroughs.org


By Travel Party: Group Economics Hold, Solo Traveler Behavior Resets Operator Models
Group travel accounted for 59.94% of segment revenue in 2025 and remains the operating backbone of the ecotourism industry. Group formats support guide utilization, conservation contributions, and community benefit-sharing more efficiently than most solo formats, which helps operators maintain product integrity while preserving margins. They also remain attractive in destinations where logistics are complex, and travelers value the structure of vetted routing, naturalist expertise, and shared safety arrangements. For many operators, group tours remain the most practical way to serve protected-area circuits without overstretching site capacity or local service networks. This makes group travel an important stabilizer for the ecotourism market even as traveler preferences become more individualized.
Solo travel is forecast to expand at a 10.43% CAGR through 2031, making it the fastest-growing travel-party format in the ecotourism market. The rise is being driven by independent travelers who want more control over itinerary pace, accommodation choice, and cause-led travel decisions. That shift forces operators to redesign pricing, because solo travelers can create higher guide costs and more difficult room economics if products are built only around traditional group assumptions. It also underscores the importance of trust signals, as independent travelers are more likely to seek third-party verification when evaluating unfamiliar destinations and smaller operators. As a result, the ecotourism market is gradually adjusting from a group-first operating model toward one that can serve both shared and highly personalized travel demand.
By Booking Mode: OTA Aggregation Leads, Direct Channels Outpace on Growth
Online Travel Agencies and Marketplaces accounted for 46.73% of bookings in 2025, making them the largest players in current distribution across the ecotourism industry. Their advantage comes from scale, search visibility, and the ability to surface certified or lower-impact inventory through filters that simplify traveler comparison. This matters because the ecotourism market often involves destinations or operators that are less visible than mainstream travel products, so platform aggregation still plays an important role in discovery. Travel agents and tour operators remain relevant in complex and premium itineraries where visa coordination, specialist routing, or high-value expedition planning still require expert intermediation. The current booking structure is therefore not a winner-takes-all system, but a layered model in which OTAs dominate discovery. At the same time, direct and advisory channels remain important for conversion and retention.
Direct booking is projected to grow at a 10.84% CAGR through 2031, making it the strongest momentum channel in the ecotourism market size outlook. This is being supported by booking tools that can interpret unstructured traveler questions around conservation access, accommodation standards, biodiversity, and route design. AtlasIQ’s natural-language booking engine, built for eco-lodges and independent operators, shows how direct channels can convert detailed traveler intent into bookable interaction without depending on a large intermediary platform. The economics are also favorable, because direct channels reduce commission leakage and help operators build first-party customer data for repeat sales. That combination is pushing the ecotourism market toward a structure where OTAs still matter for reach, but direct interfaces increasingly matter for profitability and customer ownership.
By Accommodation Type: Eco-lodges Anchor the Standard, Glamping Redefines the Ceiling
Eco-lodges accounted for 35.54% of segment revenue in 2025, making them the largest accommodation format in the ecotourism market. They continue to act as the benchmark for what travelers, certifiers, and operators usually recognize as purpose-built ecotourism infrastructure. The GSTC Hotel Standard gives this segment added weight by providing a recognized framework for site selection, energy use, community engagement, and operational responsibility. Uakari Lodge’s 2025 transfer of BRL 607,688 to its local assistants’ association shows how well-run eco-lodges can convert lodging revenue into tangible community benefits, which are central to long-term credibility in the ecotourism market. Homestays and community stays also remain important, especially in rural destinations where lower-capex formats can extend tourism benefits more widely across local households.
Glamping is the fastest-growing accommodation segment, with the ecotourism market size for glamping projected to rise at a 10.12% CAGR through 2031. Its momentum comes from how it combines nature proximity with higher comfort standards, helping attract travelers who want a lower-impact setting without giving up premium lodging expectations. The format is also drawing more institutional attention than before, because long-lease structures, branded collections, and multi-site concepts make it easier to treat glamping as an investable hospitality asset rather than a niche lifestyle product. This expansion is widening the accommodation ladder of the ecotourism market by bridging basic community stays and full-scale sustainable resorts. It also supports higher yield per visitor, which is useful in destinations where capacity growth is constrained, and revenue needs to come from a better mix rather than larger numbers alone.
Geography Analysis
Europe held 33.75% of the ecotourism market share in 2025, and the region remains the largest revenue center. Its lead is supported by dense protected-area coverage, mature outbound demand, and certification systems that fit well with digital discovery and verified sustainability positioning. Europe also exerts strong regulatory influence, as the EU Directive on Empowering Consumers for the Green Transition has tightened rules on environmental claims and raised the commercial value of documented evidence. That regulatory setting tends to favor operators that can demonstrate standards, partnerships, and impact rather than relying solely on descriptive branding. In practical terms, Europe remains the benchmark region where demand quality, certification discipline, and compliance pressure combine to shape how the wider ecotourism market evolves.
Asia-Pacific is the fastest-growing regional block, with the ecotourism market projected to grow at a 10.75% CAGR through 2031. This growth is being driven by a strong mix of policy-led supply creation and rising middle-class travel demand, which gives the ecotourism market a deeper runway than a simple recovery story. In China, research on National Ecotourism Demonstration Zones found that designated counties recorded gains not only in environmental and economic outcomes but also in resident satisfaction with education and healthcare, indicating that ecotourism policy is tied to broader rural development goals. Laos and Vietnam add to that momentum through formal national programs that link protected areas, enterprise support, and tourism growth with community livelihoods. The region, therefore, stands out in the ecotourism market because both supply-side institution-building and demand-side expansion are moving in the same direction.[4]VietnamPlus, “Sustainable Forest Ecotourism Helps Promote Economic Growth, Environmental Preservation,” VietnamPlus, vietnamplus.vn
North America and South America remain important for the ecotourism market, though they play different roles in the value chain. North America is a major demand center and a key market for certification-led compliance, especially as stronger evidence rules make it harder for operators to use broad sustainability claims without support. South America contributes a distinctive supply, especially through biodiversity corridors, rainforest experiences, and community-based lodging models that give the region strong authenticity appeal. Uakari Lodge’s 2025 results in Brazil show how Amazon-based ecotourism can circulate revenue back into community institutions while preserving the conservation-led character of the offer. The Middle East and Africa also remain central to the ecotourism market because protected landscapes, wildlife circuits, and reserve-linked accommodation keep the regions relevant for both high-spend international travelers and longer-term supply expansion.

Competitive Landscape
The ecotourism market has a moderately concentrated structure, with a visible first tier of global brands and a much larger field of destination specialists operating beneath them. Leading names such as Intrepid Travel, G Adventures, Natural Habitat Adventures, and Lindblad Expeditions benefit from stronger brand recognition, broader distribution, and greater ability to absorb certification and compliance costs than smaller independent operators. At the same time, the ecotourism market is not dominated by a handful of companies, because a large number of specialist firms continue to compete through local access, community relationships, and conservation credibility. This split is becoming more important as evidence rules, sustainability verification, and digital platform visibility raise the operating threshold for smaller firms. In effect, the ecotourism market is a rewarding scale where scale improves trust and distribution, while still leaving room for specialists that can prove authenticity on the ground.
A second layer of competition is forming around technology, booking ownership, and product personalization. AtlasIQ’s natural-language booking engine shows how operators can improve direct conversion by answering complex traveler questions in a way that standard listing pages often cannot. That matters because the ecotourism market often depends on detailed traveler intent around habitat access, impact, route difficulty, and local participation, which gives richer direct interfaces a clear advantage. Operators that invest in first-party data, AI-supported planning, and better digital storytelling are likely to capture more repeat business than those relying only on third-party distribution. This creates a competitive divide where some firms are building stronger customer ownership while others remain exposed to higher commissions and weaker visibility.
Strategic moves are also showing how the ecotourism market is broadening through new business models and specialist expansion. Expedition:Earth announced strategic investments in EXPLORE, Inc. in February 2026 and Iconic Adventures in April 2026, which illustrates a buy-and-build approach aimed at aggregating high-end specialist travel capabilities under shared infrastructure. Blue Alliance’s 2025 reef-positive tourism deployment in Indonesia shows another route, where marine protection and tourism operations are being linked through an impact-finance structure rather than through a conventional tour model. GSTC’s more specialized standards architecture is also influencing competition by making recognized certification more commercially useful for both hotels and tour operators. Together, these moves suggest that the ecotourism market is being shaped less by simple capacity expansion and more by credibility, distribution control, and the ability to package conservation value into scalable products.
Ecotourism Industry Leaders
Intrepid Travel
G Adventures
Wilderness
Natural Habitat Adventures
African Travel, Inc.
- *Disclaimer: Major Players sorted in no particular order

Recent Industry Developments
- May 2026: Viking announced a major expansion of its expedition tourism offerings by officially opening bookings for its 2028–2029 expedition voyages. The new product rollout features immersive, science-oriented itineraries across the Arctic, Antarctica, and the Great Lakes. The voyages will operate on the Viking Octantis and Viking Polaris, both purpose-built Polar Class ships designed for low-impact, sustainable exploration in remote and fragile ecosystems.
- October 2025: Blue Alliance deployed a sustainable ecotourism model in Indonesia that connected reef-positive tourism with marine conservation financing, widening the use of tourism as a recurring funding mechanism for protected seascapes.
- September 2025: The World Bank announced new incentives for nature-based tourism investment in Lao forest areas, combining advisory support, small public infrastructure, and enterprise development with the goal of creating 75,000 job opportunities, mainly for women, while deepening the role of protected-area tourism in local economic development.
- April 2025: The International Labour Organization launched a community-based tourism initiative in Jaflong, Bangladesh, which created 50 direct jobs and benefited more than 1,200 residents, showing how formal program design can convert local tourism activity into a more structured ecotourism product.


Global Ecotourism Market Report Scope
| Nature & Wildlife Ecotourism |
| Marine & Coastal Ecotourism |
| Rural & Community-Based Ecotourism |
| Agri-Ecotourism |
| Forest & Mountain Ecotourism |
| Conservation & Educational Ecotourism |
| Others |
| Solo |
| Group |
| Direct Booking |
| Travel Agents & Tour Operators |
| Online Travel Agency / Marketplace |
| Eco-lodges |
| Sustainable Hotels and Resorts |
| Homestays and Community Stays |
| Glamping |
| North America | United States |
| Canada | |
| Mexico | |
| South America | Brazil |
| Peru | |
| Chile | |
| Argentina | |
| Rest of South America | |
| Europe | United Kingdom |
| Germany | |
| France | |
| Spain | |
| Italy | |
| BENELUX (Belgium, Netherlands, and Luxembourg) | |
| NORDICS (Denmark, Finland, Iceland, Norway, and Sweden) | |
| Rest of Europe | |
| Asia-Pacific | India |
| China | |
| Japan | |
| Australia | |
| South Korea | |
| South East Asia (Singapore, Malaysia, Thailand, Indonesia, Vietnam, and Philippines) | |
| Rest of Asia-Pacific | |
| Middle East and Africa | United Arab Emirates |
| Saudi Arabia | |
| South Africa | |
| Nigeria | |
| Rest of Middle East And Africa |
| By Type | Nature & Wildlife Ecotourism | |
| Marine & Coastal Ecotourism | ||
| Rural & Community-Based Ecotourism | ||
| Agri-Ecotourism | ||
| Forest & Mountain Ecotourism | ||
| Conservation & Educational Ecotourism | ||
| Others | ||
| By Travel Party | Solo | |
| Group | ||
| By Booking Mode | Direct Booking | |
| Travel Agents & Tour Operators | ||
| Online Travel Agency / Marketplace | ||
| By Accommodation Type | Eco-lodges | |
| Sustainable Hotels and Resorts | ||
| Homestays and Community Stays | ||
| Glamping | ||
| By Geography | North America | United States |
| Canada | ||
| Mexico | ||
| South America | Brazil | |
| Peru | ||
| Chile | ||
| Argentina | ||
| Rest of South America | ||
| Europe | United Kingdom | |
| Germany | ||
| France | ||
| Spain | ||
| Italy | ||
| BENELUX (Belgium, Netherlands, and Luxembourg) | ||
| NORDICS (Denmark, Finland, Iceland, Norway, and Sweden) | ||
| Rest of Europe | ||
| Asia-Pacific | India | |
| China | ||
| Japan | ||
| Australia | ||
| South Korea | ||
| South East Asia (Singapore, Malaysia, Thailand, Indonesia, Vietnam, and Philippines) | ||
| Rest of Asia-Pacific | ||
| Middle East and Africa | United Arab Emirates | |
| Saudi Arabia | ||
| South Africa | ||
| Nigeria | ||
| Rest of Middle East And Africa | ||


Key Questions Answered in the Report
What is the projected value of ecotourism by 2031?
The sector is projected to reach USD 561.13 billion by 2031, up from USD 354.94 billion in 2026, reflecting a 9.59% CAGR over 2026 to 2031.
Which region leads global revenue and which region is growing the fastest?
Europe held the largest share at 33.75% in 2025, while Asia-Pacific is forecast to grow the fastest at a 10.75% CAGR through 2031.
Which type of travel product is largest in this space?
Nature & Wildlife Ecotourism was the largest type segment in 2025 with a 38.42% share, supported by strong demand for guided wildlife and protected-area experiences.
What is changing in how travelers book these trips?
OTAs and marketplaces led bookings with a 46.73% share in 2025, but direct booking is growing faster at a 10.84% CAGR as operators adopt AI-enabled booking tools and seek lower commission dependence.
Why is certification becoming more important for operators?
Certification now affects trust, compliance, and discoverability. As greenwashing rules tighten and recognized standards become more visible in booking environments, verified operators gain a stronger commercial position.
What are the biggest limits on future expansion?
Premium pricing, weak transport and visitor infrastructure in remote sites, and carrying-capacity limits at fragile destinations are the main constraints on scaling supply and revenue.
Page last updated on:


