East Asia Renewable Energy Market Size and Share
Market Overview
| Study Period | 2021 - 2031 |
|---|---|
| Forecast Data Period | 2026 - 2031 |
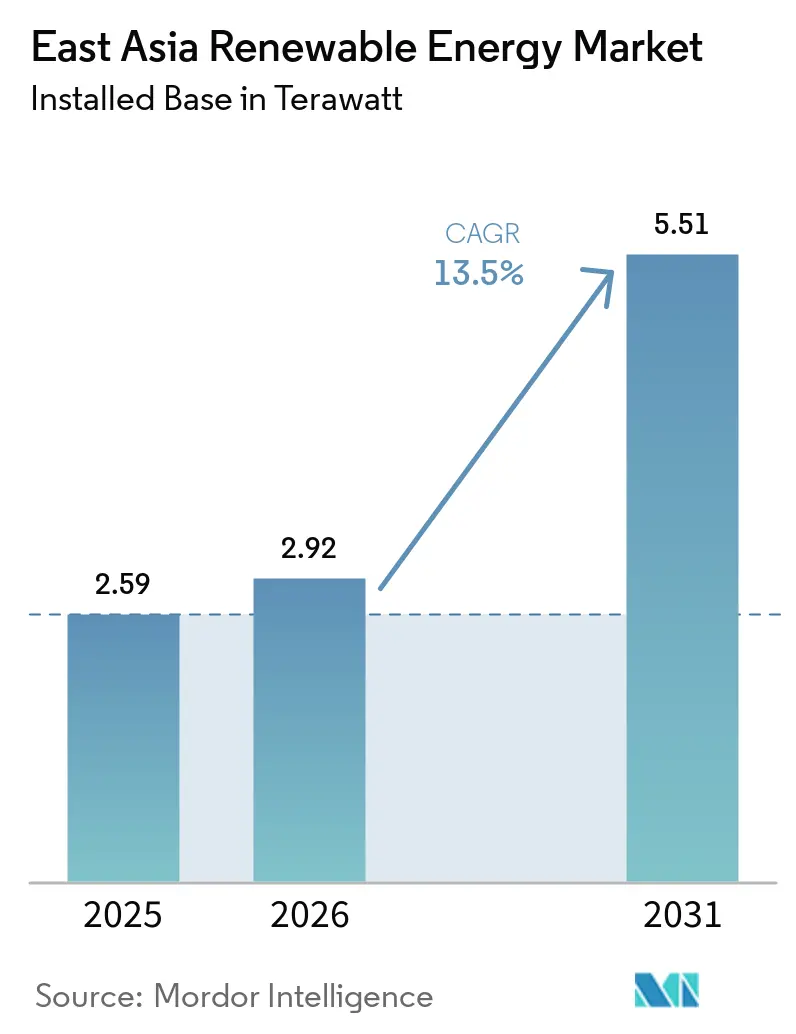
| Base Year Market Size (2025) | 2.59 terawatt |
| Market Volume (2026) | 2.92 terawatt |
| Market Volume (2031) | 5.51 terawatt |
| Growth Rate (2026 - 2031) | 13.50% CAGR |
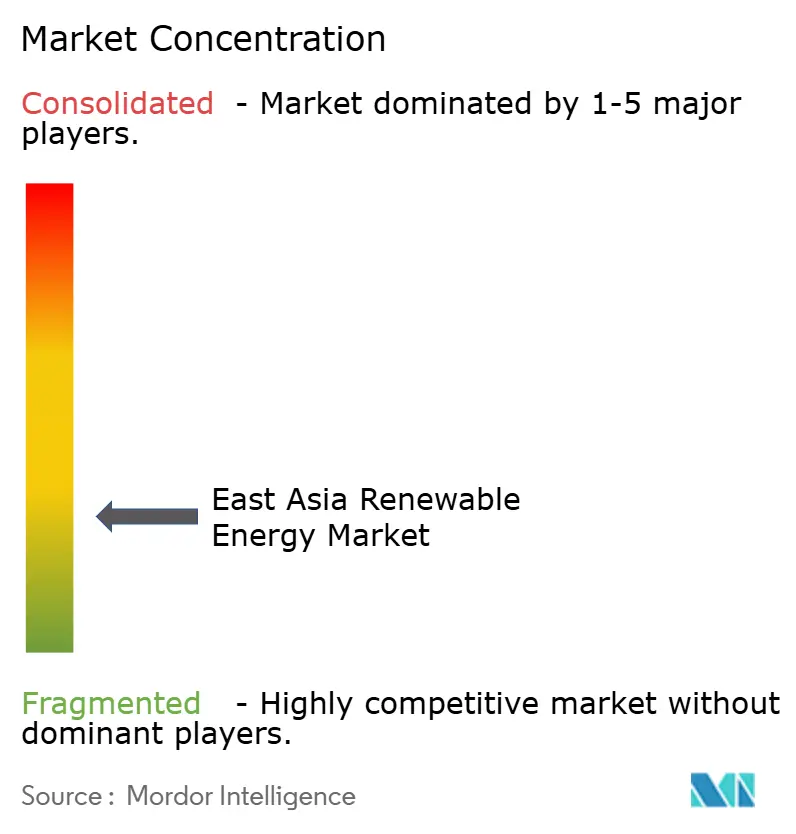
| Market Concentration | Low |
Major Players *Disclaimer: Major Players sorted in no particular order Image © Mordor Intelligence. Reuse requires attribution under CC BY 4.0. | |
East Asia Renewable Energy Market Analysis by Mordor Intelligence
The East Asia Renewable Energy Market size in terms of installed base is projected to be 2.59 terawatt in 2025, 2.92 terawatt in 2026, and reach 5.51 terawatt by 2031, growing at a CAGR of 13.5% from 2026 to 2031. Intensifying decarbonization mandates, rapid solar and wind cost deflation, and a surge in corporate power-purchase agreements are accelerating capacity additions across the region.[1]Reuters, “China’s Renewable Energy Policy and Market Development,” reuters.com China’s large-scale desert solar complexes still anchor growth, yet emerging hubs in Japan, South Korea, and Taiwan are fast-tracking offshore wind and rooftop photovoltaics, pushing the East Asia renewable energy market toward a more balanced geographic mix.[2]International Energy Agency, “Renewable Power Generation Costs 2024,” iea.org Transmission mega-projects and AI-enabled forecasting are easing grid constraints, while vertically integrated Chinese module makers press cost advantages that reshape global supply chains. Meanwhile, typhoon-zone insurance premia and stringent land-use reviews continue to temper near-term build-outs, especially for onshore wind and large hydro assets.[3]Lloyd’s of London, “Typhoon Risk Modeling for Offshore Wind,” lloyds.com
Key Report Takeaways
- By technology, Solar Energy led with 53.1% of the East Asia renewable energy market share in 2025, Ocean Energy is projected to expand at a 43.4% CAGR through 2031.
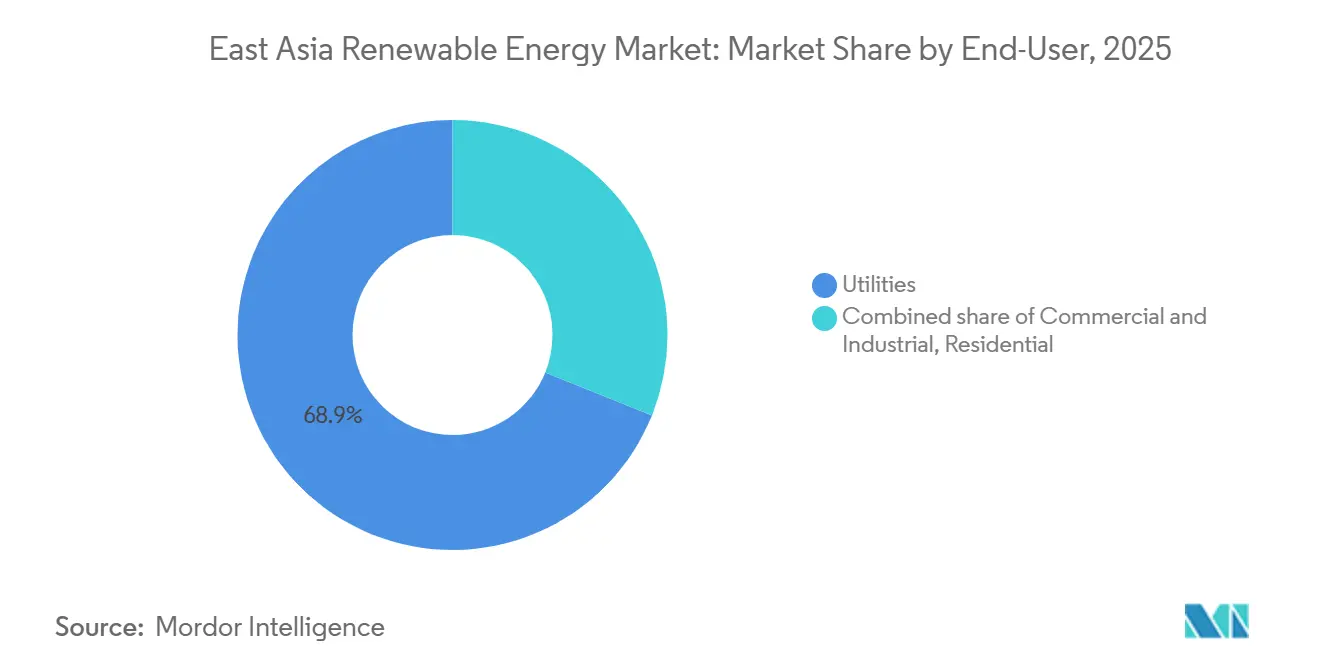
- By end-user, utilities held 68.9% share of the East Asia renewable energy market size in 2025, the Commercial and Industrial segment is advancing at a 14.9% CAGR to 2031.
- By geography, China accounted for 90.1% of capacity in 2025, Rest of East Asia is expanding at a 14.2% CAGR through 2031.
Note: Market size and forecast figures in this report are generated using Mordor Intelligence’s proprietary estimation framework, updated with the latest available data and insights as of January 2026.
East Asia Renewable Energy Market Trends and Insights
Drivers Impact Analysis*
| Driver | % Impact on CAGR Forecast | Geographic Relevance | Impact Timeline |
|---|---|---|---|
| Government decarbonization mandates & subsidy mechanisms | +3.20% | China, Japan, South Korea, Taiwan | Long term (≥ 4 years) |
| Rapid LCOE decline for solar PV & wind | +2.80% | Global, concentrated in China | Medium term (2-4 years) |
| Corporate-PPA boom from data-center & heavy-industry buyers | +2.10% | Japan, Taiwan, urban China | Medium term (2-4 years) |
| Cross-border HVDC super-grid build-out | +1.40% | China, Japan, South Korea | Long term (≥ 4 years) |
| Localized offshore-wind manufacturing clusters | +1.70% | Fujian, Jeollanam-do | Medium term (2-4 years) |
| AI-driven generation forecasting | +1.30% | China, Japan, South Korea | Short term (≤ 2 years) |
| Source: Mordor Intelligence | |||
Government Decarbonization Mandates & Subsidy Mechanisms
Regional policy frameworks now embed gigawatt-scale targets in economic planning. China’s 15th Five-Year Plan ties provincial GDP metrics to renewable roll-outs, ensuring political accountability for capacity gains. Japan’s seventh Strategic Energy Plan finalized in 2024 raised the 2040 renewable electricity goal to 50% and switched to feed-in-premium auctions that flex with wholesale prices, reducing fiscal exposure while safeguarding developer cash flows.[4]Ministry of Economy Trade and Industry, “Japan’s Strategic Energy Plan (7th Edition),” meti.go.jp South Korea’s RE3020 requires public institutions to source 35% of power from renewables by 2030, already catalyzing 18 utility-scale solar tenders in 2025. Taiwan legislated a USD 28 billion offshore wind and green hydrogen fund through 2030, monitored quarterly by the Bureau of Energy. Together these programs imply a regional carbon price floor near USD 45 per ton, rendering unabated coal uncompetitive before the decade’s end.
Rapid LCOE Decline for Solar PV & Wind
Asia-Pacific solar and wind levelized costs fell 16% in 2024 as polysilicon oversupply, N-type cell efficiencies above 25%, and bifacial adoption near 70% drove module prices to USD 0.09 per watt. China’s utility-scale PV averaged USD 27 per MWh in 2024, undercutting gas by 35%. Inner Mongolia wind auctions cleared at USD 31 per MWh in 2025 thanks to 6.5 MW turbines with 180-meter rotors. Offshore wind remains pricier, yet localized supply chains in Jeollanam-do aim for USD 55 per MWh by 2028 as Doosan Enerbility’s 15 MW nacelles reach volume scale. Continuous cost compression widens the East Asia renewable energy market addressable base and encourages hybrid storage pairings that secure evening-peak premiums.
Corporate-PPA Boom from Data-Center & Heavy-Industry Buyers
Corporate offtakers locked 9.4 GW of PPAs by December 2025, led by Equinix’s 121 MW virtual deal in Japan and TSMC’s 1.2 GW offshore-wind contracts in Taiwan. Scope 2 emissions now influence credit ratings, prompting hyperscalers to demand 24/7 renewable matching. Semiconductor fabs pursue multi-decade hedges to stabilize electricity outlays that can exceed USD 2 million per hour of downtime. Contract-for-difference structures cap buyer risk, evidenced by NEC’s 80 MW wind PPA at JPY 12 per kWh. Rising C&I demand lifts the East Asia renewable energy market beyond utility procurement cycles and compresses auction clearing prices region-wide.
Cross-Border HVDC Super-Grid Build-Out
Commissioned in 2025, the 2 GW Hokkaido–Honshu link cuts curtailment in Japan’s north from 18% to 6% while feeding Tokyo’s load center. China’s 8 GW Gansu–Zhejiang ±800 kV corridor delivers solar at USD 0.04 per kWh, half Zhejiang coal costs. Feasibility studies for a China–Japan–Korea subsea line envision 5 GW by 2032 at USD 12 billion. Mongolia’s wind export ambitions hinge on these routes, unlocking 100 GW of sub-USD 30 per MWh resources. Super-grid integration lifts regional trade volumes, enlarging the East Asia renewable energy market for remote desert and offshore assets alike.
Restraints Impact Analysis*
| Restraint | % Impact on CAGR Forecast | Geographic Relevance | Impact Timeline |
|---|---|---|---|
| Grid congestion & curtailment risk | -1.80% | Tibet, Gansu, Xinjiang, Hokkaido | Short term (≤ 2 years) |
| Land-use & permitting delays for onshore assets | -1.20% | Japan, South Korea, Taiwan | Medium term (2-4 years) |
| Polysilicon price spikes from Xinjiang audits | -0.90% | China, Japan, South Korea | Short term (≤ 2 years) |
| Typhoon-zone insurance premia for offshore wind | -0.70% | Taiwan Strait, Fujian, Jeollanam-do | Medium term (2-4 years) |
| Source: Mordor Intelligence | |||
Grid Congestion & Curtailment Risk
Solar curtailment in China hit 9.2% during Jan–Feb 2026 as 180 GW of 2025 additions outpaced transmission growth. Tibet dumped 17% of midday solar because a lone 3 GW line serves a 400 MW load. State Grid has earmarked CNY 650 billion for five new ultra-high-voltage corridors through 2027, yet typical build times run up to four years. Hokkaido’s curtailment drop post-HVDC shows targeted links can resolve bottlenecks, but Korea still caps variable renewable share at 25% without co-located storage. Persistent congestion restrains near-term additions and trims the East Asia renewable energy market growth runway.
Land-Use & Permitting Delays for Onshore Assets
Japan’s Environmental Impact Assessment law stretches onshore wind lead times beyond four years when local opposition emerges. Taiwans Fisheries Agency rejected 2.1 GW of leases in 2024, forcing costlier deep-water shifts. Korea’s developers juggle 14 separate approvals, averaging 5.2 years to construction. China’s desert solar fast-track shows progress, yet sites near sensitive habitats still face 18-month reviews. Prolonged permitting diverts capital to rooftop and offshore segments, reshaping the East Asia renewable energy market mix.
*Our forecasts treat driver/restraint impacts as directional, not additive. The impact forecasts reflect baseline growth, mix effects, and variable interactions.
Segment Analysis
By Technology: Solar Dominates While Ocean Accelerates
Solar Energy commanded 53.1% of installed capacity in 2025. Continuous cost declines, desert mega-bases, and rooftop mandates cement its primacy, though polysilicon audits bifurcate supply chains. Ocean Energy’s low 2025 base under 300 MW underpins its 43.4% CAGR, with South Korea’s Sihwa barrage and Japan’s Proteus turbine signaling commercial readiness.
Turbine scaling lifts wind contributions; 16 MW platforms now generate 80 GWh annually, doubling 2020 units. Pumped-storage hydro like China’s 3.6 GW Fengning plant stabilizes variable output, while geothermal additions in Kyushu diversify Japan’s mix. Concentrating solar and bioenergy stay niche as PV costs plunge below USD 0.10 per watt. Ocean technology pilot success could expand the East Asia renewable energy market frontier beyond traditional resources.
By End-User: C&I Procurement Surges Past Utility Pace
Utilities still owned 68.9% of capacity in 2025, reflecting balance-sheet depth needed for offshore wind and pumped-storage hydro. Their share of the East Asia renewable energy market share will erode as flexible retail tariffs, transmission fees, and curtailment penalties favor distributed assets.
C&I buyers are scaling rooftop arrays-Alibaba’s 1 GW logistics portfolio and Samsung’s 200 MW fab installation exemplify the pivot. Virtual PPAs shield data-center operators and semiconductor fabs from volatile tariffs, driving a 14.9% CAGR to 2031. Residential adoption remains below 5% due to apartment-heavy urban footprints and post-incentive payback uncertainty, though battery costs near USD 75 per kWh could unlock growth. These dynamics reposition the East Asia renewable energy market toward customer-sited generation and multi-actor ecosystems.


Geography Analysis
China’s 90.1% capacity share in 2025 dominates the East Asia renewable energy market, fueled by Gobi Desert solar bases and aggressive ultra-high-voltage line build-outs. Curtailment hotspots in Gansu and Tibet persist, yet eastward HVDC transfers at USD 0.04 per kWh displace coastal coal, reinforcing China’s cost leadership.
Japan boosted renewable share to 24% of generation in 2025 after commissioning the 2 GW Hokkaido link, which enabled Tokyo to retire 1.5 GW of oil peakers. Offshore wind auctions in Akita and Choshi cleared at record-low JPY 11.99 per kWh, validating localized nacelle assembly and buoying the East Asia renewable energy market offshore pipeline.
South Korea’s Jeollanam-do cluster underpins a 3.2 GW offshore complex financed by the region’s largest green bond, while rooftop solar on semiconductor fabs hedges against winter price spikes. Taiwan’s 2.9 GW offshore fleet aligns with TSMC’s 2030 RE100 target despite lease re-routes that lifted foundation costs 30%. Mongolia and Hong Kong, though small today, expand at 14.2% CAGR as HVDC export corridors and rooftop mandates diversify the East Asia renewable energy market geography.
Competitive Landscape
Market concentration recored is moderately low. Five vertically integrated Chinese manufacturers-JinkoSolar, LONGi, Trina, JA Solar, and Canadian Solar-control more than 70% of global wafer-to-module capacity, cementing cost and scale advantages that reverberate through the East Asia renewable energy market supply chain. JinkoSolar’s 56 GW N-type line and LONGi’s 30 GW back-contact cell facility exemplify a technology arms race where 0.5-point efficiency gains can reallocate double-digit market share.
Offshore wind EPC remains fragmented. European turbine OEMs Vestas and Siemens Gamesa compete with regional developers such as China Three Gorges, KEPCO, and Hanwha for typhoon-zone leases, with IEC 61400-1 Class T certification acting as a compliance moat IEC.CH. Strategic moves coalesce around vertical integration (Tongwei into non-Xinjiang polysilicon), geographic diversification (Ørsted’s Taiwan JV), and hybrid bundling (SPIC’s vanadium-redox storage).
Emerging disruptors include CATL’s 300 MWh sodium-ion storage at 40% cost savings and AI platforms like FuXi-Energy that monetize forecasting accuracy in ancillary-service markets. Capital access defines project viability: Pacifico’s USD 4.8 billion green bond and TSMC’s long-dated offtakes show how finance rather than pure capex per MW dictates speed to market within the East Asia renewable energy industry.
East Asia Renewable Energy Industry Leaders
State Power Investment Corporation (SPIC)
China Three Gorges Corp (CTG)
JinkoSolar Holding Co Ltd
Korea Electric Power Corp (KEPCO)
JERA Co Inc
- *Disclaimer: Major Players sorted in no particular order

Recent Industry Developments
- March 2026: The Hokkaido–Honshu 2 GW HVDC line entered service, slashing northern curtailment to 6%.
- February 2026: Equinix signed a 121 MW virtual PPA with Renewable Japan, the nation’s largest corporate renewable deal.
- June 2025: Pacifico Energy closed USD 4.8 billion in green bonds for the 3.2 GW Shinan offshore wind project.
- June 2025: China's new policy allows renewable electricity producers to supply power directly to users, bypassing the public grid. Renewable plants can build private lines, enabling companies to trace renewable sources. Projects must use 60% green power on-site and meet 30% of electricity needs via direct supply, with increasing self-use ratios over time.


East Asia Renewable Energy Market Report Scope
Renewable energy refers to the energy that is generated from natural resources that can be replenished or renewed on a human timescale, such as solar, wind, hydro, geothermal, and biomass. Unlike fossil fuels, which are finite resources that are extracted from the earth and cannot be replenished, renewable energy sources are constantly replenished by nature and do not produce harmful emissions or pollution.
The East Asian renewable energy market is segmented by technology, end-use, and geography (China, Japan, Taiwan, South Korea, and the rest of East Asia). By technology, the market is segmented into solar, wind, hydro, bioenergy, geothermal, and ocean energy. By end-use, the market is segmented into residential, commercial and industrial, and utility. The report also covers the market size and forecasts for the renewable energy market across major countries in the region. For each segment, market sizing and forecasts have been done based on installed capacity (TW).
| Solar Energy (PV and CSP) |
| Wind Energy (Onshore and Offshore) |
| Hydropower (Small, Large, PSH) |
| Bioenergy |
| Geothermal |
| Ocean Energy (Tidal and Wave) |
| Utilities |
| Commercial and Industrial |
| Residential |
| China |
| Japan |
| South Korea |
| Taiwan |
| Rest of East Asia (Mongolia, Hong Kong, Macau) |
| By Technology | Solar Energy (PV and CSP) |
| Wind Energy (Onshore and Offshore) | |
| Hydropower (Small, Large, PSH) | |
| Bioenergy | |
| Geothermal | |
| Ocean Energy (Tidal and Wave) | |
| By End-User | Utilities |
| Commercial and Industrial | |
| Residential | |
| By Geography | China |
| Japan | |
| South Korea | |
| Taiwan | |
| Rest of East Asia (Mongolia, Hong Kong, Macau) |


Key Questions Answered in the Report
What is the market volume of East Asia renewable energy market?
Installed capacity is set to rise from 2.92 TW in 2026 to 5.51 TW by 2031, reflecting a 13.5% CAGR.
Which technology will add capacity the fastest through 2031?
Ocean Energy leads growth with a projected 43.4% CAGR, although Solar Energy remains the largest resource at over half of installed capacity.
Why are corporate power-purchase agreements surging in the region?
Data-center operators and semiconductor fabs secure long-term price certainty and meet Scope 2 disclosure rules, driving a 14.9% CAGR in C&I renewable demand.
What limits faster renewable build-outs in China?
Grid congestion caused 9.2% solar curtailment in early 2026, and several western provinces still await additional ultra-high-voltage lines.
How are typhoons affecting offshore projects?
Insurance premia in the Taiwan Strait and East China Sea run 18-22% above European levels, adding up to 0.7 percentage points of negative impact on the forecast CAGR.
Page last updated on:


