Early Phase Contract Research Organization (CRO) Services Market Size and Share
Market Overview
| Study Period | 2020 - 2031 |
|---|---|
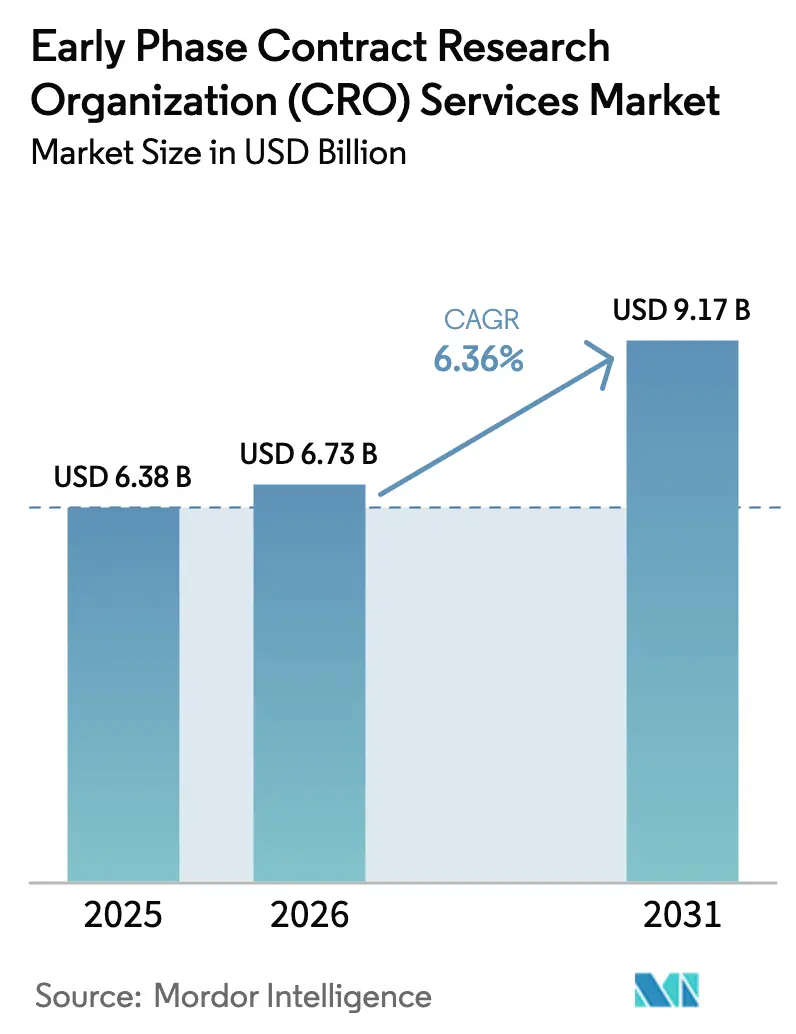
| Market Size (2026) | USD 6.73 Billion |
| Market Size (2031) | USD 9.17 Billion |
| Growth Rate (2026 - 2031) | 6.36% CAGR |
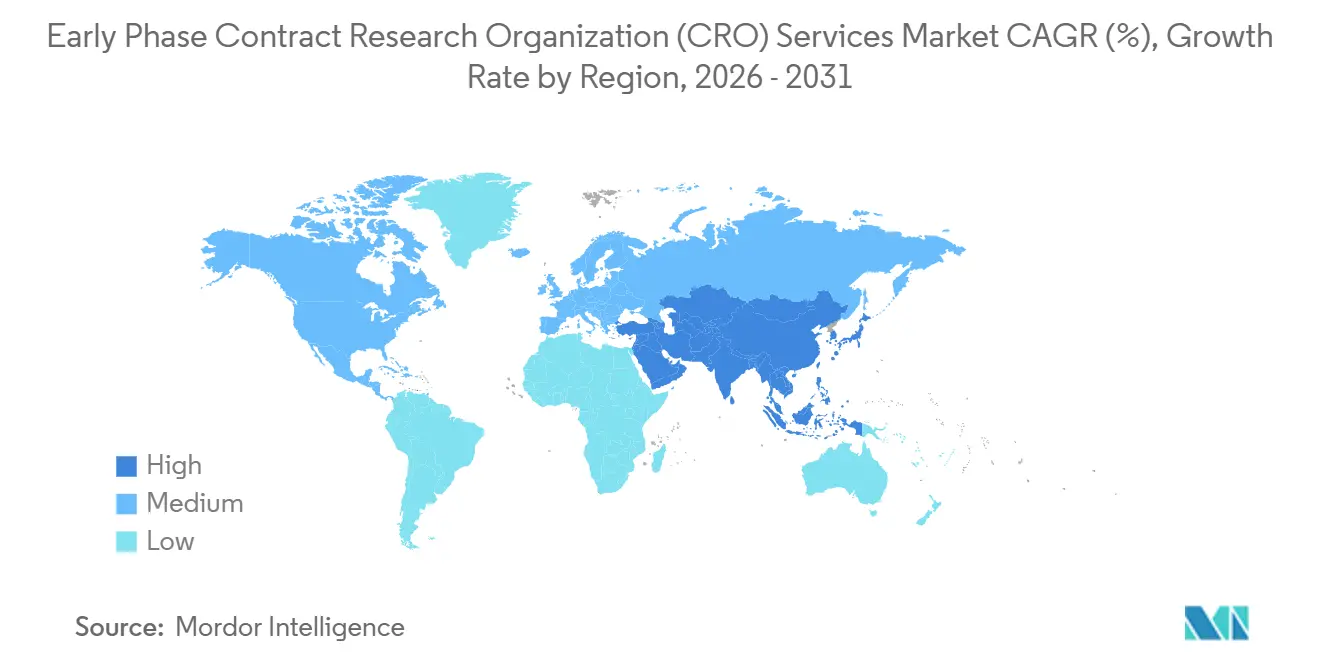
| Fastest Growing Market | Asia Pacific |
| Largest Market | North America |
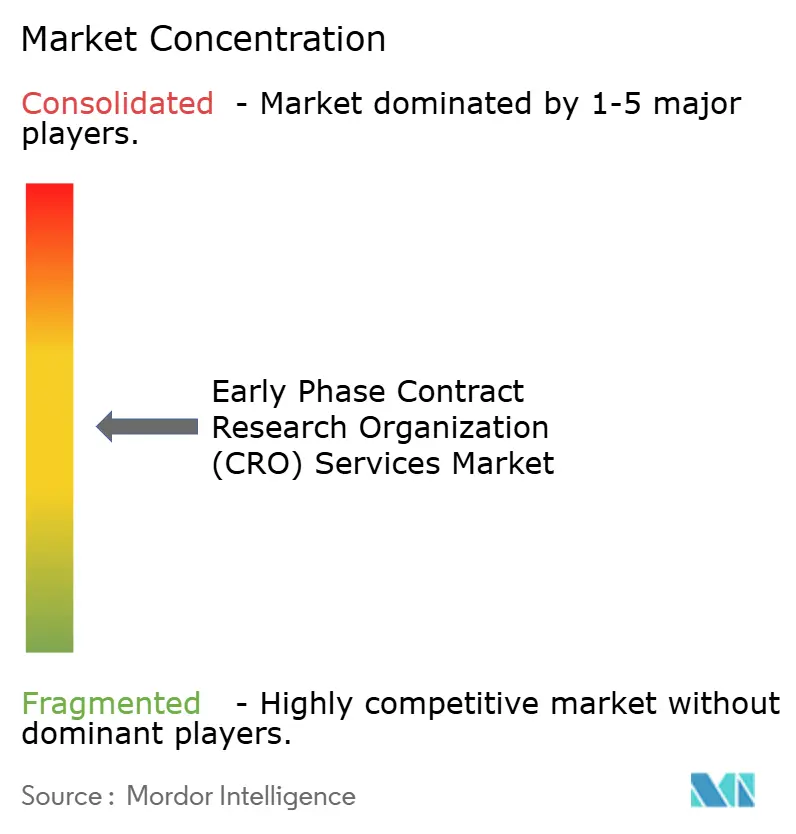
| Market Concentration | Medium |
Major Players *Disclaimer: Major Players sorted in no particular order Image © Mordor Intelligence. Reuse requires attribution under CC BY 4.0. | |
Early Phase Contract Research Organization (CRO) Services Market Analysis by Mordor Intelligence
Early Phase Contract Research Organization Services Market size in 2026 is estimated at USD 6.73 billion, growing from 2025 value of USD 6.38 billion with projections showing USD 9.17 billion, growing at 6.36% CAGR over 2026-2031.
Increased capital allocation to Phase I, Phase IIa, bioequivalence, and exploratory IND work streams is accelerating demand as regulators now prefer dose-optimization evidence over maximum-tolerated-dose paradigms under the FDA’s Project Optimus framework [1]U.S. Food and Drug Administration, “Project Optimus,” fda.gov. Small and mid-size biotech sponsors dominate outsourcing volumes because venture-backed innovators avoid fixed infrastructure, while generic manufacturers are rapidly increasing study count to support complex 505(b)(2) and ANDA filings. Remote data capture, wearable sensors, and continuous PK telemetry are shifting revenue toward data management and biostatistics services, displacing labor-intensive on-site monitoring. Multiregional first-in-human designs enabled by ICH E8(R1), ICH E6(R3), and the EU Clinical Trials Regulation allow simultaneous site activation across the FDA, EMA, and NMPA jurisdictions, shortening overall timelines and favoring CROs with geographically diverse footprints.
Key Report Takeaways
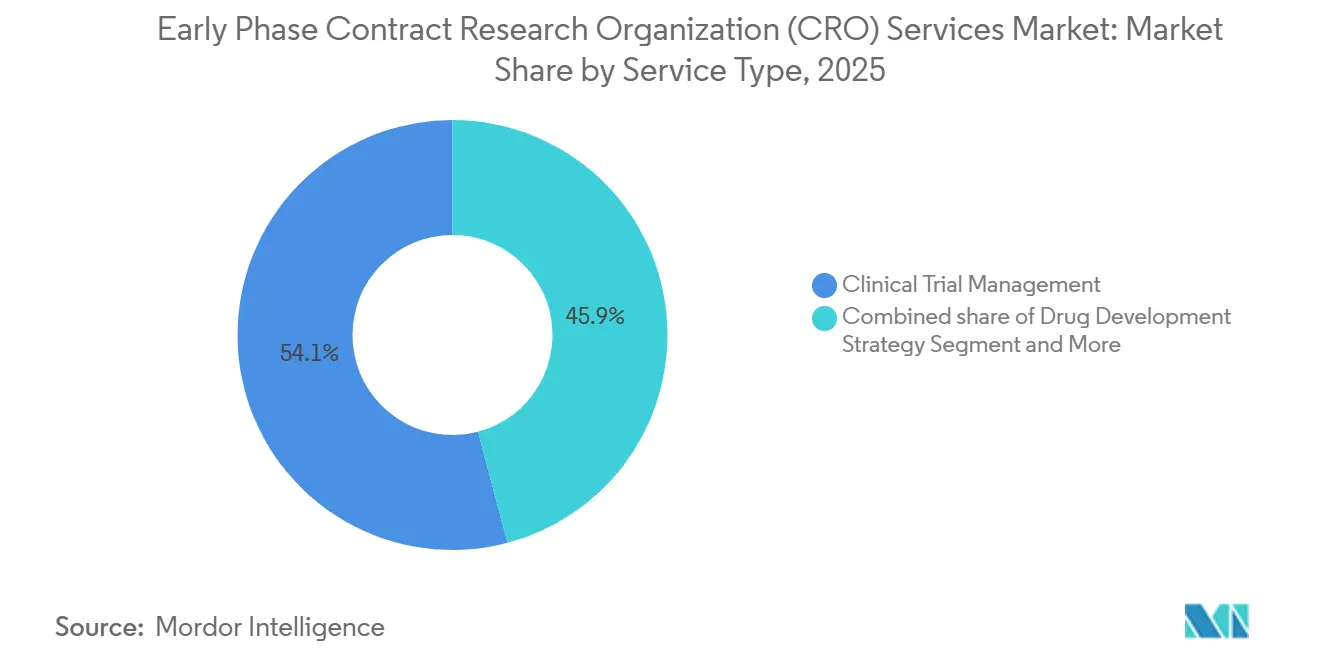
- By service type, clinical monitoring led with 54.12% revenue share in 2025; data management and biostatistics is forecast to expand at a 7% CAGR to 2031.
- By therapeutic area, oncology captured 30% share in 2025; infectious diseases is advancing at a 6.9% CAGR through 2031.
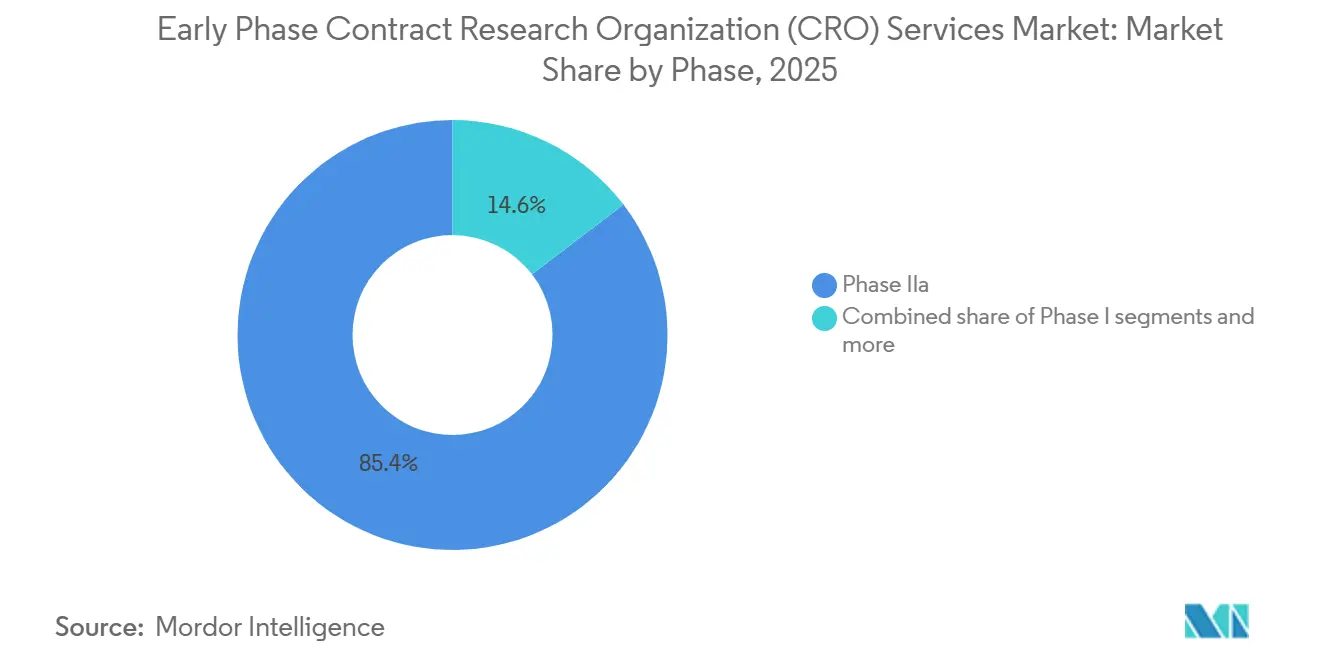
- By phase, Phase IIa held 85.37% of the early phase contract research organization (CRO) services market share in 2025; bioequivalence and bioavailability studies are projected to expand at a 6.8% CAGR between 2026 and 2031.
- By sponsor type, small and mid-size biotech firms accounted for 57.1% share of the early phase contract research organization (CRO) services market size in 2025; generic drug manufacturers are recording the highest projected CAGR at 7.20% through 2031.
- By geography, North America dominated with 40.13% share in 2025; Asia-Pacific is poised to grow at an 8.12% CAGR through 2031.
Note: Market size and forecast figures in this report are generated using Mordor Intelligence’s proprietary estimation framework, updated with the latest available data and insights as of January 2026.
Global Early Phase Contract Research Organization (CRO) Services Market Trends and Insights
Drivers Impact Analysis*
| Driver | (~) % Impact on CAGR Forecast | Geographic Relevance | Impact Timeline |
|---|---|---|---|
| Surge in biopharmaceutical pipeline of complex biologics | +1.5% | Global, with concentration in North America & EU | Medium term (2-4 years) |
| Cost-efficiency & time-saving advantages for sponsors | +1.3% | Global, APAC adoption accelerating | Short term (≤ 2 years) |
| Regulatory harmonization initiatives (ICH E8(R1), FDA Project Optimus) | +1.0% | Global, North America & EU early adopters | Medium term (2-4 years) |
| Decentralized trial-enabled early PK/PD analytics platforms | +0.9% | North America & EU core, APAC emerging | Short term (≤ 2 years) |
| Rising venture funding in first-in-human micro-dosing studies | +0.8% | North America & EU, selective APAC hubs | Medium term (2-4 years) |
| Source: Mordor Intelligence | |||
Surge in Biopharmaceutical Pipeline of Complex Biologics
More than 3,200 active gene and cell therapy trials were underway worldwide by mid-2025, marking a 35% rise versus 2020 [2]American Society of Gene & Cell Therapy, “Cell and Gene Therapy Trials Landscape 2025,” asgct.org. Antibody drug conjugates alone number over 400 investigative programs, each demanding intricate dose-escalation schemes that evaluate optimal biological dose, pharmacodynamic biomarkers, and payload-release kinetics. Cell-based modalities such as CAR-T and TCR-T add leukapheresis coordination and manufacturing-slot constraints that only integrated CRO networks can manage efficiently. mRNA platforms, validated in infectious-disease settings, are entering oncology and rare-disease pipelines, requiring first-in-human assessments of innate-immune activation and lipid-nanoparticle biodistribution. Collectively, these modalities elevate the technical barrier for early phase execution and reward providers able to combine advanced bioanalytical, logistics, and immunology expertise.
Cost-Efficiency and Time-Saving Advantages for Sponsors
Outsourcing Phase I work reduces fixed overhead for emerging biotechs by 25%–35% compared with operating internal units, preserving cash during 18- to 24-month financing cycles. CROs holding large healthy-volunteer panels can launch single-ascending-dose cohorts within 8–10 weeks of protocol finalization versus 16–20 weeks for in-house efforts. Adaptive designs sanctioned under ICH E20 support seamless transitions from Phase Ia to Ib within one protocol, trimming four to six months from development calendars. Asia-Pacific providers deliver 30%–40% per-patient cost savings, although sponsors must balance this against local review timelines and possible ethnic-sensitivity bridging requirements under CDSCO guidelines.
Regulatory Harmonization Initiatives
The FDA finalized Project Optimus in 2024, directing oncology sponsors to justify dose selection with pharmacodynamic and benefit data rather than default maximum-tolerated-dose logic, which extends Phase I but improves Phase II success odds. ICH E8(R1) emphasizes patient-centric endpoints and seamless evidence planning, while ICH E6(R3) formally recognizes electronic source data and risk-based monitoring, enabling a 30%–40% cut in on-site visits. The EU Clinical Trials Regulation’s single-portal system reduces initial approval to about 60 days, and NMPA alignment with ICH has compressed Chinese IND review from 150 days to 60 days.
Decentralized Trial-Enabled Early PK/PD Analytics Platforms
Final FDA guidance in 2023 endorsed remote consent, telemedicine assessments, and direct-to-patient drug shipment where safety permits. Continuous heart-rate and temperature patches validated under the Software as a Medical Device framework feed real-time PK models, shrinking inpatient confinement from up to seven days to one or two and curbing per-subject cost by as much as 25%. Robust e-source, 21 CFR Part 11 compliance, and GDPR-compatible cloud storage remain prerequisites, steering sponsor preference toward CROs with mature digital infrastructure.
Restraints Impact Analysis*
| Restraint | (~) % Impact on CAGR Forecast | Geographic Relevance | Impact Timeline |
|---|---|---|---|
| Patient recruitment challenges in niche indications | -0.8% | Global, acute in rare-disease programs | Short term (≤ 2 years) |
| Stringent data-integrity compliance costs | -0.6% | North America & EU, expanding to APAC | Medium term (2-4 years) |
| High turnover of specialized clinical-pharmacology staff | -0.5% | Global, most severe in North America | Short term (≤ 2 years) |
| Supply-chain limits for isotopic micro-tracers | -0.3% | Global, concentrated supplier base | Medium term (2-4 years) |
| Source: Mordor Intelligence | |||
Patient Recruitment Challenges in Niche Indications
Rare-disease Phase I enrollment spans 18–24 months, roughly double timelines for common indications because patients are sparse and often undiagnosed [3]U.S. Food and Drug Administration, “Rare Diseases: Natural History Studies,” fda.gov. Only 38% of sponsors maintain disease registries despite 2024 FDA guidance encouraging such infrastructure, leaving CROs to rely on advocacy group outreach that adds budget and schedule risk. Biomarker-driven oncology studies post 40%+ screen-failure rates, forcing activation of extra sites and inflating cost. Decentralized approaches mitigate travel burdens yet still mandate in-clinic safety monitoring for higher-risk compounds, capping virtual design advantages. Institutional review board approvals for registry access can add two to four months to study start-up, further stretching rare-disease timelines.
Stringent Data-Integrity Compliance Costs
FDA Form 483 observations citing data-integrity lapses climbed 22% from 2023 to 2024. Deploying 21 CFR Part 11-compliant e-source systems costs USD 200,000–400,000 per clinic, with annual validation approaching USD 80,000. GDPR cross-border transfer rules elongate contract negotiation by up to six weeks, and MHRA remote-verification expectations require multi-factor authentication layers that add further spend. These outlays compress margins for smaller providers and elevate barriers to entry.
*Our forecasts treat driver/restraint impacts as directional, not additive. The impact forecasts reflect baseline growth, mix effects, and variable interactions.
Segment Analysis
By Service Type: Digital Data Workflows Redefine Value Pools
Clinical monitoring retained a 54.12% revenue lead in 2025, underscoring the still-essential nature of on-site source-data verification in the early phase domain. Yet data management and biostatistics are the fastest risers at a 7.0% CAGR, a reflection of decentralized telemetry streams that demand continuous statistical modeling. Sponsors are increasingly bundling monitoring, statistics, and regulatory consulting within single contracts to simplify oversight and ensure cohesive execution. Risk-based monitoring principles embedded in ICH E6(R3) will gradually depress visit-based revenue yet expand analytics-driven services, shifting wallet share toward vendors offering integrated e-source review and centralized risk dashboards. Smaller niche labs remain relevant for bioanalytical and PK modeling, but face consolidation pressure as full-service CROs continue to acquire specialty capabilities.
The early phase contract research organization (CRO) services market size generated by data management and biostatistics is forecast to rise faster than any other service bucket through 2031, reflecting steady growth in continuous sensor data, adaptive designs, and AI-supported real-time safety surveillance. Conversely, the proportion of spend tied to pure clinical monitoring will decline as electronic source adoption widens and regulators endorse remote verification, reinforcing the strategic imperative for providers to invest in digital infrastructure.


By Therapeutic Area: Oncology Sustains Dominance while Infectious Diseases Gains Velocity
Oncology accounted for 30% of 2025 revenue, powered by immuno-oncology combinations, CAR-T advancements, and the expanding antibody–drug conjugate pipeline that depends on intricate first-in-human designs incorporating pharmacodynamic biomarkers such as circulating tumor DNA. Infectious diseases are set to outpace all other areas at a 6.9% CAGR to 2031, bolstered by CARB-X-backed antimicrobial-resistance projects and government-driven pandemic-preparedness mandates. Central nervous system studies remain technically challenging due to blood–brain-barrier imaging and CSF sampling needs, while psychedelic compounds are opening new proof-of-concept avenues under FDA breakthrough-therapy pathways.
Within the early phase contract research organization (CRO) services market, oncology maintains the highest absolute value, yet infectious-disease programs will account for a rising slice of incremental growth as governments channel funds toward antimicrobial pipelines and rapid pandemic vaccine platforms. CROs with BSL-2/3 infrastructure and vaccine-specific pharmacovigilance skills are best placed to capture this emerging revenue stream.
By Phase: Traditional Phase I Prevails, but BE/BA Momentum Builds
Phase IIa studies generated 85.37% of clinical-phase revenue in 2025. Their rise comes from one simple fact: sponsors must see a clear proof-of-concept before they gamble on expensive late-stage trials. A typical Phase IIa study enrolls 100–300 volunteers across several dose groups and relies on adaptive randomization and quick interim looks at the data. Only CROs with seasoned biostatisticians and agile data systems can handle that pace.
Biomarker-driven drug development adds to the load. Many Phase IIa programs now pair the medicine with a companion diagnostic and segment patients by genetic profile, so CROs need strong lab ties and tight regulatory know-how to keep everything moving. Bioequivalence and bioavailability (BE/BA) work is the fastest-growing niche, projected to grow at a 6.8% CAGR through 2031. These projects are shorter, often four to eight weeks, and follow well-worn protocols, letting CROs run more studies each year, even though each contract is smaller.
By Sponsor Type: Biotech Drives Volume; Generics Leads Growth
Small and mid-size biotechs generated 57.1% of contract value in 2025, mirroring the rise of asset-centric company structures that outsource most operations. Generic manufacturers, propelled by 505(b)(2) reformulation strategies and the push into complex injectables and inhalables, are set to record a 7.2% CAGR through 2031, faster than any other sponsor class. Large-pharma internal units face lower capacity utilization and now bifurcate award portfolios across multiple CRO partners to benchmark pricing, increasing bid pressure.
Risk-sharing contract formats in which CROs receive milestone-based payments are gaining traction among cash-sensitive startups. CROs willing to assume execution risk in return for upside participation will differentiate themselves in the next cycle of biotech funding.
Geography Analysis
North America held 40.13% early phase clinical development services market share in 2025, reflecting the dense cluster of Phase I units in Boston, San Diego, and the San Francisco Bay Area. The region benefits from proximity to FDA scientific meetings, well-established healthy-volunteer databases, and mature bioanalytical laboratories that speed cohort initiation. Decentralized-trial guidance allows hybrid designs that pair telemedicine visits with inpatient dosing, yet clinical-pharmacology staff turnover above 20% tempers cost competitiveness. Wage inflation and rising real-estate prices in key biotech corridors are prompting sponsors to weigh North American speed advantages against higher operating expenses.
The early phase clinical development services market size for Asia-Pacific is forecast to grow at an 8.12% CAGR, positioning the region to overtake Europe before 2031. China’s NMPA now reviews IND applications within 60 days, and its approval of 158 innovative-drug trials in 2024 underscores a rapid pipeline influx. India’s risk-based review pathway trims regulatory cycles by about 30% and, combined with 40%–50% lower labor costs, shortens patient-recruitment timelines relative to Western markets. Australia’s 30-day Clinical Trial Notification scheme offers a fast entry point for proof-of-concept studies that feed global programs. Singapore and Japan, each operating expedited review tracks for advanced therapies, add high-quality sites that attract sponsors seeking seamless multi-regional designs.
Europe remains the second-largest geography, underpinned by the EU Clinical Trials Regulation single-portal system that halves multi-country start-up times. Phase I clinics in the Netherlands, Germany, and the United Kingdom provide sophisticated first-in-human capabilities, while Eastern European sites contribute cost efficiencies and treatment-naïve patient populations. South America and the Middle East & Africa command smaller shares today, yet Argentina, Brazil, and South Africa are drawing rare-disease and neglected-tropical-disease programs because of lower per-patient costs and supportive ethics frameworks. Continued alignment with ICH guidelines across emerging regions is expected to broaden the global footprint of the early phase clinical development services industry.

Competitive Landscape
Market concentration is moderate: the top five CROs hold significant combined revenue, leaving room for mid-tier specialists and digital disrupters. Legacy providers are responding by acquiring bioanalytical labs, embedding AI-driven safety analytics, and expanding into high-growth Asia-Pacific locales. Partnerships with wearable-sensor firms and patient-advocacy organizations are core differentiators, supporting decentralized monitoring and rare-disease enrollment. Technology readiness, including validated e-source, risk-based monitoring algorithms, and cloud-native data platforms, now serves as a gating criterion in sponsor RFPs. Smaller entrants gain traction by focusing on micro-dosing, organ-on-chip toxicology, or psychedelic medicine niches, where agility and scientific depth trump scale.
Early Phase Contract Research Organization (CRO) Services Industry Leaders
IQVIA
ICON plc
Labcorp Drug Development
Medpace
Parexel International
- *Disclaimer: Major Players sorted in no particular order

Recent Industry Developments
- April 2025: IQVIA was recognized as a front-runner in generative AI for life sciences by a leading independent research analyst firm.
- January 2025: ICON introduced new AI tools such as iSubmit, Mapi Research Trust COA, FORWARD+, and OMR AI Navigation Assistant—to streamline document management and startup metrics.
- January 2025: IQVIA expanded its Singapore Phase I unit with 40 additional beds and cell-therapy capability.


Global Early Phase Contract Research Organization (CRO) Services Market Report Scope
As per the scope of the report, an early-phase Contract Research Organization (CRO) specializes in the initial stages of human clinical testing. Their core function is to transition potential new drugs from laboratory and animal studies into human subjects to establish foundational data on safety, tolerability, and pharmacokinetics. Unlike late-phase CROs that manage thousands of patients to confirm efficacy, early-phase CROs operate smaller, highly controlled studies, often involving fewer than 100 participants, to determine the maximum tolerated dose and identify potential side effects before a "go/no-go" decision is made for further development
The early-phase CRO services Market is segmented by service type, therapeutic area, phase, end-users, and geography. By service type, the market is categorized into drug development strategy, clinical trial management, data management & biostatistics, regulatory & consulting, and other specialist services. By therapeutic area, the market is divided into oncology, central nervous system (CNS), infectious diseases, cardiovascular, immunology & inflammation, rare diseases, and others. By phase, it is segmented into Phase I, Phase IIa, BE / BA Studies, Exploratory IND & Micro-dosing. By end-users, the segmentation includes large pharmaceutical companies, small & mid-size biotech, generic drug manufacturers, academic & government institutions. Geographically, the market is segmented across North America, Europe, the Asia-Pacific region, the Middle East & Africa, and South America. The market report also covers the estimated market sizes and trends for 17 countries across major regions globally. For each segment, the market size and forecast are provided in terms of value (USD).
| Drug Development Strategy |
| Clinical Trial Management |
| Data Managemet & Biostatistics |
| Regulatory & Consulting |
| Other Specialist Services |
| Oncology |
| Central Nervous System (CNS) |
| Infectious Diseases |
| Cardiovascular |
| Immunology & Inflammation |
| Rare Diseases |
| Others |
| Phase I |
| Phase IIa |
| BE / BA Studies |
| Exploratory IND & Micro-dosing |
| Large Pharmaceutical Companies |
| Small & Mid-size Biotech |
| Generic Drug Manufacturers |
| Academic & Government Institutions |
| North America | United States |
| Canada | |
| Mexico | |
| Europe | Germany |
| United Kingdom | |
| France | |
| Italy | |
| Spain | |
| Rest of Europe | |
| Asia-Pacific | China |
| India | |
| Japan | |
| South Korea | |
| Australia | |
| Rest of Asia-Pacific | |
| Middle East and Africa | GCC |
| South Africa | |
| Rest of Middle East and Africa | |
| South America | Brazil |
| Argentina | |
| Rest of South America |
| By Service Type | Drug Development Strategy | |
| Clinical Trial Management | ||
| Data Managemet & Biostatistics | ||
| Regulatory & Consulting | ||
| Other Specialist Services | ||
| By Therapeutic Area | Oncology | |
| Central Nervous System (CNS) | ||
| Infectious Diseases | ||
| Cardiovascular | ||
| Immunology & Inflammation | ||
| Rare Diseases | ||
| Others | ||
| By Phase | Phase I | |
| Phase IIa | ||
| BE / BA Studies | ||
| Exploratory IND & Micro-dosing | ||
| By Sponsor Type | Large Pharmaceutical Companies | |
| Small & Mid-size Biotech | ||
| Generic Drug Manufacturers | ||
| Academic & Government Institutions | ||
| By Geography | North America | United States |
| Canada | ||
| Mexico | ||
| Europe | Germany | |
| United Kingdom | ||
| France | ||
| Italy | ||
| Spain | ||
| Rest of Europe | ||
| Asia-Pacific | China | |
| India | ||
| Japan | ||
| South Korea | ||
| Australia | ||
| Rest of Asia-Pacific | ||
| Middle East and Africa | GCC | |
| South Africa | ||
| Rest of Middle East and Africa | ||
| South America | Brazil | |
| Argentina | ||
| Rest of South America | ||


Key Questions Answered in the Report
What is the value of the early-phase clinical development services market in 2026?
Early-phase CRO services market is expected to reach USD 6.73 billion in 2026.
How fast is the market expected to grow through 2031?
It is projected to post a 6.36% CAGR, reaching USD 9.17 billion by 2031.
Which service type is expanding the quickest?
Data management and biostatistics leads growth at a 7% CAGR through 2031.
Why is the Asia-Pacific considering the fastest-growing region?
NMPA and CDSCO regulatory reforms, shorter recruitment timelines, and 40%–50% lower labor costs drive an 8.12% CAGR in the region.
Which sponsor class contributes most to outsourcing demand?
Small and mid-size biotech firms hold 57.6% share as they prefer outsourcing to avoid fixed infrastructure.
Page last updated on:


