
Dynamic Creative Optimization Software Market Size and Share
Market Overview
| Study Period | 2020 - 2031 |
|---|---|
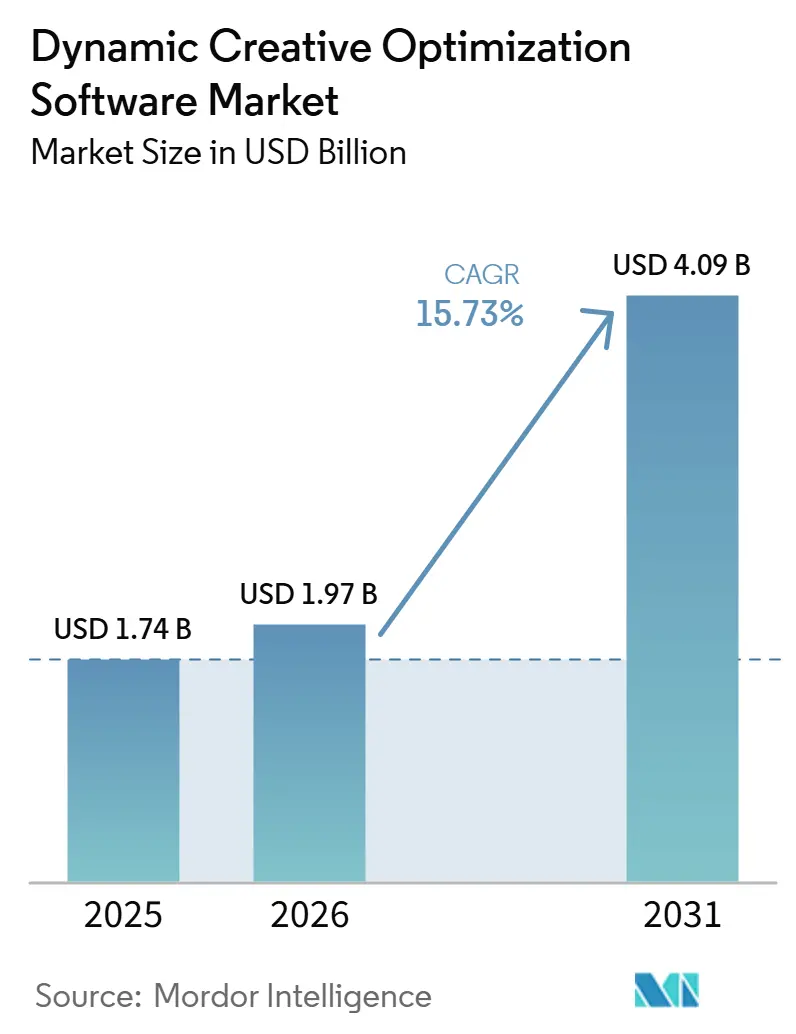
| Market Size (2026) | USD 1.97 Billion |
| Market Size (2031) | USD 4.09 Billion |
| Growth Rate (2026 - 2031) | 15.73 % |
| Fastest Growing Market | Asia-Pacific |
| Largest Market | North America |
| Market Concentration | Low |
Major Players *Disclaimer: Major Players sorted in no particular order Image © Mordor Intelligence. Reuse requires attribution under CC BY 4.0. | |
Dynamic Creative Optimization Software Market Analysis by Mordor Intelligence
The dynamic creative optimization software market size is projected to expand from USD 1.74 billion in 2025 and USD 1.97 billion in 2026 to USD 4.09 billion by 2031, registering a CAGR of 15.73% between 2026 and 2031. Growth reflects the move toward personalized advertising delivered at the moment an impression is served. Programmatic buying now requires advertisers to manage creative versions at a scale that manual production cannot support. Retail media networks, connected television, and social platforms are increasing the need to connect creative assets with product, price, inventory, and audience inputs. Generative AI is reducing the time needed to create and test versions, while privacy changes are raising the value of creative signals that advertisers can control. The dynamic creative optimization software market is also becoming more demanding of vendors, as buyers need governance, compliance, and measurement capabilities alongside creative delivery.
Key Report Takeaways
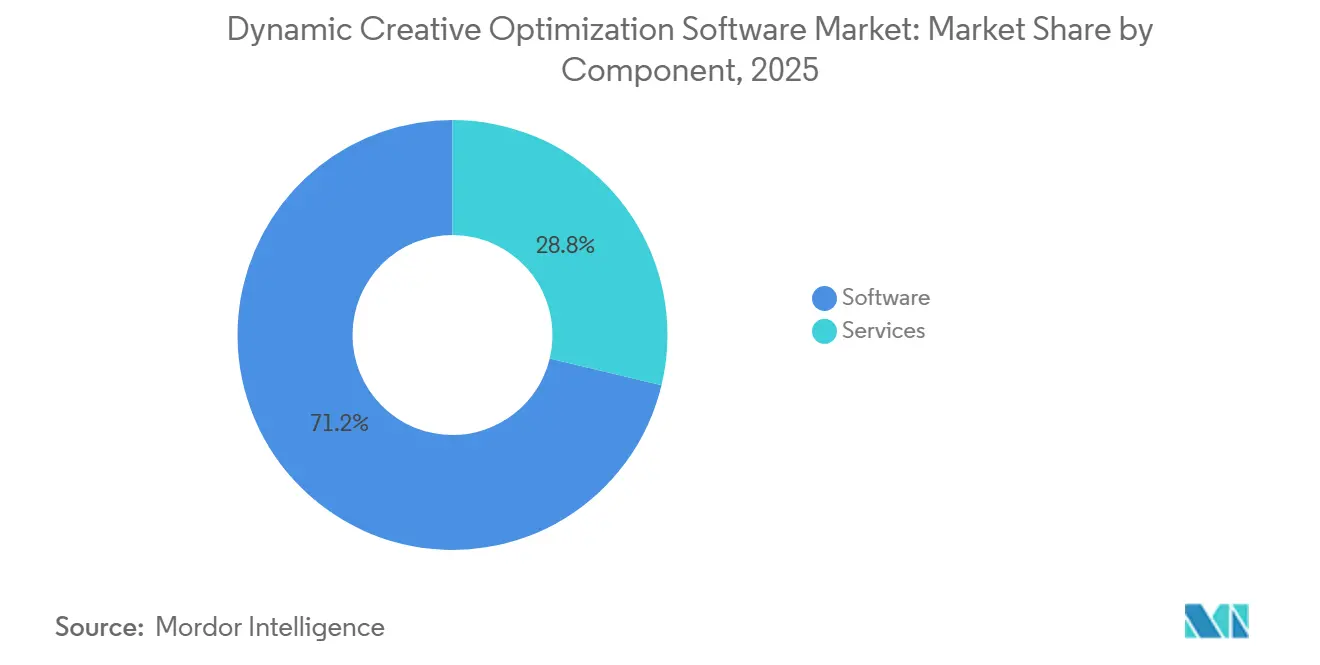
- By component, software accounted for 71.24% of the dynamic creative optimization market share in 2025, while services are projected to expand at a CAGR of 18.82% through 2031.
- By deployment mode, cloud held 68.41% of the market share of the market in 2025, while hybrid deployment is projected to expand at a CAGR of 17.69% through 2031.
- By application, social media advertising accounted for 28.19% of the market share in the dynamic creative optimization software market in 2025, while connected television advertising is projected to expand at a CAGR of 19.43% through 2031.
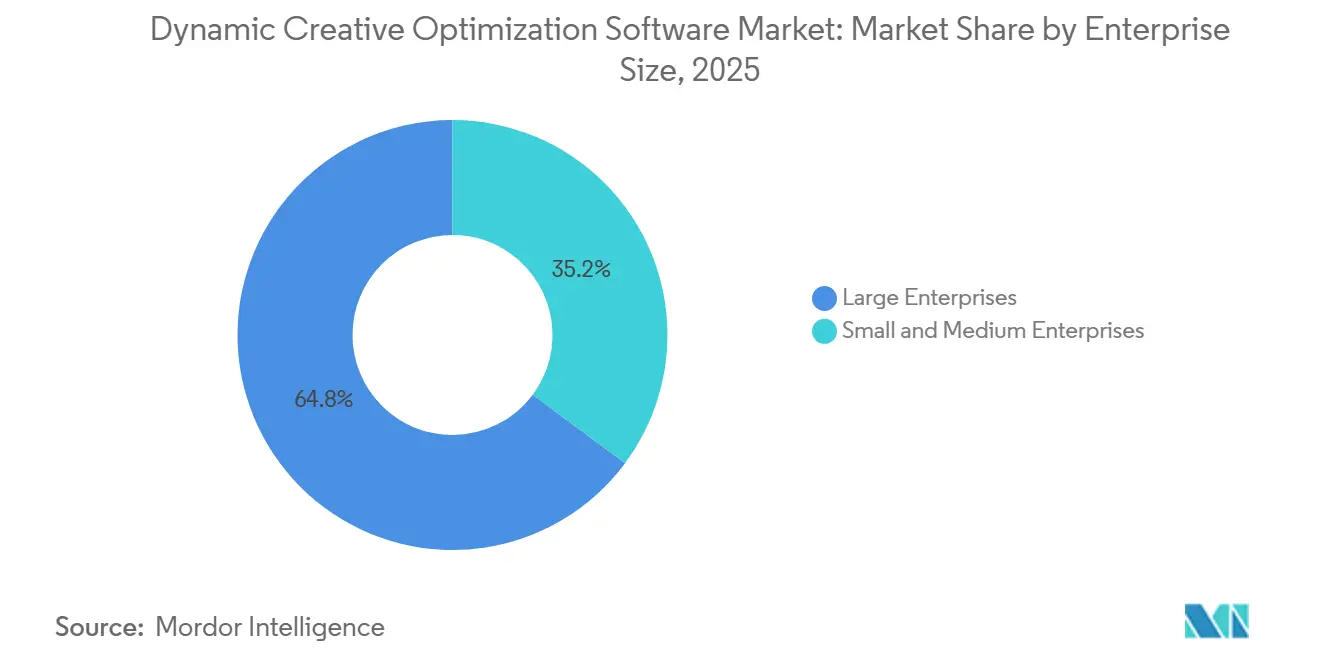
- By enterprise size, large enterprises held 64.83% of the market share of the market in 2025, while SMEs are projected to expand at a CAGR of 20.24% through 2031.
- By end user, retail and e-commerce accounted for 24.36% of the market share of the market in 2025, while travel and hospitality is projected to expand at a CAGR of 18.91% through 2031.
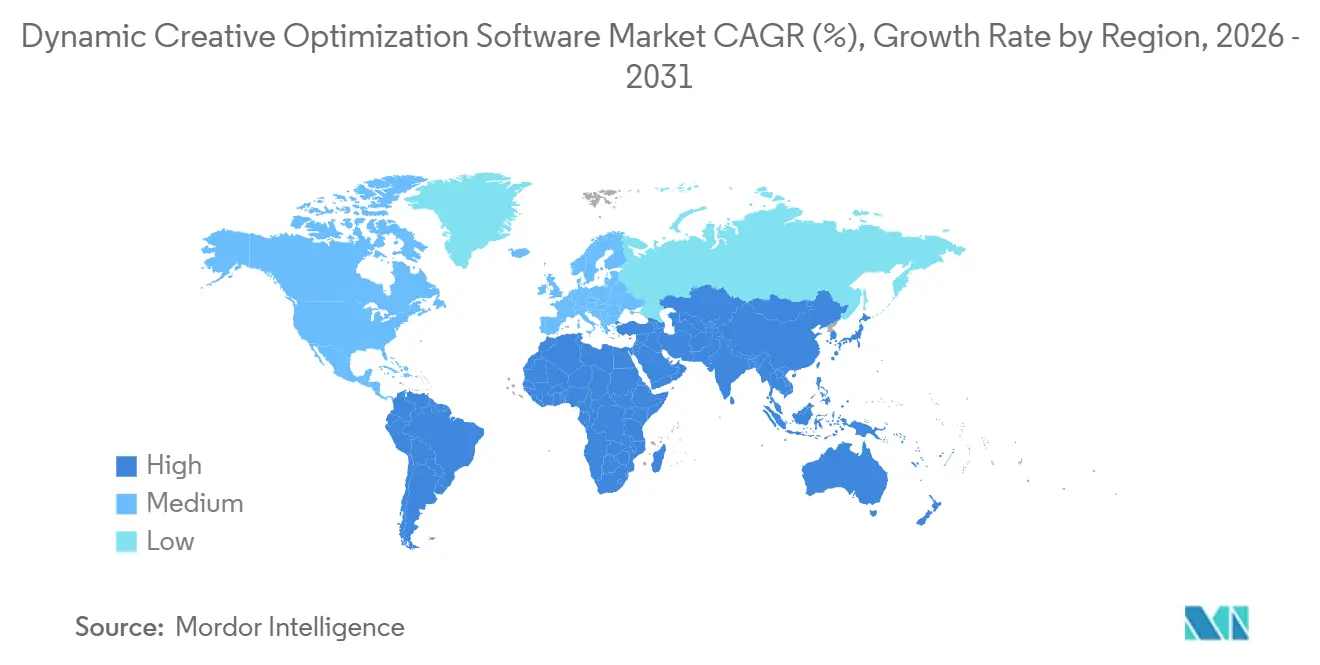
- By geography, North America held 34.62% of the share of the market in dynamic creative optimization software market in 2025, while Asia-Pacific is projected to expand at a CAGR of 19.18% through 2031.
Note: Market size and forecast figures in this report are generated using Mordor Intelligence’s proprietary estimation framework, updated with the latest available data and insights as of January 2026.
Market Trends and Insights
Drivers Impact Analysis of Dynamic Creative Optimization Software Market*
| Driver | (~) % Impact on CAGR Forecast | Geographic Relevance | Impact Timeline |
|---|---|---|---|
| Growth in Programmatic and Personalized Advertising | +3.5% | Global, with the highest concentration in North America and Western Europe | Short term (≤ 2 years) |
| Generative AI and Machine Learning in Creative Decisioning | +3.2% | Global, with North America and Asia-Pacific leading deployment | Medium term (2-4 years) |
| Expansion of Retail Media and Commerce Advertising | +2.8% | North America, with expansion into Asia-Pacific and Europe | Short term (≤ 2 years) |
| Need for Cross-Channel Creative Automation | +2.1% | Global, with faster adoption in Asia-Pacific and Middle East and Africa | Medium term (2-4 years) |
| Creative Signal Substitution for Declining Audience Signals | +1.4% | Europe and North America, with early gains in Asia-Pacific | Long term (≥ 4 years) |
| Real-Time Product, Price, Inventory, Weather, and Location Feeds | +1.0% | Global, with concentration in Southeast Asia and South America | Medium term (2-4 years) |
| Source: Mordor Intelligence | |||
Growth in Programmatic and Personalized Advertising
Global advertising expenditure is set to surpass USD 1 trillion in 2026, while programmatic channels are expected to account for more than 80% of digital investment.[1]Dentsu, “Global Ad Spend Set to Surpass USD 1 Trillion for the First Time in 2026 as the Algorithmic Era Redefines Growth,” Dentsu, dentsu.com This scale makes the dynamic creative optimization software market relevant to advertisers who must serve many creative combinations without relying on manual production. A campaign can require different messages for audience groups, devices, locations, and placements. Dynamic creative tools make those combinations manageable by linking approved assets and decision rules to each impression. Dentsu expects 79% of Asia-Pacific advertising spend to be algorithmically driven by 2027, which broadens the adoption base beyond established programmatic markets. As programmatic activity increases, advertisers need platforms that can maintain relevance without increasing the workload for creative and media teams.
Generative AI and Machine Learning in Creative Decisioning
Generative AI is changing how advertisers prepare creative material for dynamic campaigns. It allows teams to produce, adapt, and test larger sets of approved assets than traditional production processes allow. This capability is useful when campaigns require messages tailored by product, location, or channel. Faster production also creates a need for stronger controls, as review teams must still verify compliance with brand, legal, and platform requirements. Mediaocean launched NIVO AI in June 2026, placing Innovid agents across creative generation, predictive scoring, campaign trafficking, and reporting.[2]Mediaocean, “Mediaocean Introduces NIVO AI With Innovid Agents Driving 90% Improvement in Speed to Campaign Launch,” Mediaocean, morningstar.com The company reported pilot workflow improvements of up to 90% compared with manual campaign setup, underscoring why buyers increasingly expect AI functions to be integrated into the operating workflow rather than offered as a separate feature.
Expansion of Retail Media and Commerce Advertising
Retail media is increasing the need for creative that can reflect product availability, prices, and promotions when an ad is delivered. This requirement becomes stronger when retailer data is used beyond a retailer’s own website and app. Criteo and Mirakl Ads launched a global integration in July 2025 to extend marketplace advertising capabilities to mid- and long-tail sellers.[3]Criteo, “Criteo and Mirakl Ads Launch Global Integration to Accelerate Marketplace Revenue Growth,” Criteo Investor Room, criteo.investorroom.com The integration combined Mirakl’s marketplace seller ecosystem with Criteo’s commerce media capabilities and automated campaign execution. For the dynamic creative optimization software market, retail media creates demand for templates that can use live catalog information without requiring a separate manual asset for every product. The same need is extending to connected television and other off-site placements, where product information must be paired with a full advertising creative rather than a search-like sponsored listing.
Need for Cross-Channel Creative Automation
Advertisers now run campaigns across social media, connected television, display, digital out-of-home, retail media, and owned channels. Each channel has different creative specifications, delivery methods, and reporting practices. This makes it difficult to apply one creative approach across the full campaign without a platform that can coordinate assets and measurement. Smartly integrated with Amazon DSP in March 2026, extending its creative optimization and campaign management capabilities to connected television inventory that includes Prime Video, Fire TV, and third-party publishers. Smartly also partnered with Roku in June 2026, linking its platform to Roku Ads Manager through the Roku Ads API.[4]Smartly, “Smartly and Roku Bring Social Performance Playbook to the Biggest Screen at Home,” Smartly, smartly.io These moves show how the dynamic creative optimization software market is shifting from single-channel creative assembly toward coordinated activation across multiple media environments.
Restraints Impact Analysis of Dynamic Creative Optimization Software Market*
| Restraint | (~) % Impact on CAGR Forecast | Geographic Relevance | Impact Timeline |
|---|---|---|---|
| Privacy Regulation and Third-Party Signal Loss | -2.1% | Europe and North America, with emerging relevance in Asia-Pacific | Long term (≥ 4 years) |
| Platform Walled Gardens and Limited Interoperability | -1.6% | Global | Medium term (2-4 years) |
| Creative Governance Risk From Generative AI | -1.1% | Europe, with growing relevance in North America | Medium term (2-4 years) |
| Fragmented Measurement Across Retail Media, CTV, Social, and Open Web | -0.8% | North America and Europe | Short term (≤ 2 years) |
| Source: Mordor Intelligence | |||
Privacy Regulation and Third-Party Signal Loss
Privacy requirements are changing the data that platforms can use to select a creative in real time. Google changed its approach to Chrome cookie deprecation in April 2025 and later dismantled much of the Privacy Sandbox in October 2025. The wider compliance environment still requires advertisers to demonstrate responsible consent practices and limit the use of personal data. France’s Conseil d’État upheld a EUR 40 million (USD 45 Million) GDPR fine against Criteo in March 2026, relating to consent demonstration and the right to erasure. For the dynamic creative optimization software market, this pressure favors contextual targeting, first-party data activation, and privacy-aware decisioning. It also adds engineering and governance work, which can lengthen buying cycles and increase the expected implementation costs for advertisers.
Platform Walled Gardens and Limited Interoperability
Major advertising platforms control their own creative formats, audience signals, and measurement systems. This limits an independent tool's ability to seamlessly move assets, audiences, and performance insights between platforms. Buyers, therefore, often need separate campaign approaches for each major platform, even when they want consistent creative messaging. The Ad Context Protocol was launched in October 2025 by a consortium that included PubMatic, Triton Digital, and Optable to create a common interface for advertising platforms. Wider adoption remains important because cross-platform creative management still involves separate workflows and reporting. This constraint can slow deployment in the dynamic creative optimization software market, especially for buyers seeking one system across walled gardens, connected television, and the open web.
*Our forecasts treat driver/restraint impacts as directional, not additive. The impact forecasts reflect baseline growth, mix effects, and variable interactions.
Dynamic Creative Optimization Software Market Segment Analysis
By Component:
Services Support More Complex ImplementationsSoftware held 71.24% of the dynamic creative optimization software market share by component in 2025. It provides the core system that assembles creative versions, applies decision rules, and delivers the selected version at the required time. Its leading position reflects the central role of software in operating campaigns at programmatic scale. Advertisers use this layer to connect templates with audience, product, and placement inputs. The software layer must also work within the time limits of automated advertising delivery.
Services are projected to expand at a CAGR of 18.82% from 2026 to 2031. The faster growth reflects the need for implementation support, creative planning, feed integration, and ongoing campaign analysis. Many advertisers do not have internal teams that can configure complex deployments across connected television, social media, and retail media at the same time. Mediaocean’s 2026 NIVO AI launch illustrates how platform providers are embedding workflow support into their product offerings. The distinction between licensed software and managed optimization is becoming less clear as large buyers seek support that covers both technology and campaign operations.


By Deployment Mode:
Hybrid Models Address Scale and Data RequirementsCloud deployment accounted for 68.41% of the market share by deployment mode in 2025. Cloud platforms can provide the processing capacity needed to create and test many creative combinations during an active campaign. They also support cross-market delivery through distributed infrastructure. These capabilities are valuable when advertisers need to update content rapidly in response to campaign inputs. Cloud deployment is therefore well-suited to advertisers who prioritize speed, flexibility, and wide geographic reach.
Hybrid deployment is projected to expand at a CAGR of 17.69% from 2026 to 2031. It gives buyers a way to separate data processing from creative delivery when internal governance or data residency rules limit the use of public cloud systems. Sensitive audience or customer data can remain in an on-premise or private environment, while creative delivery can use cloud infrastructure. On-premises deployment remains relevant when localization requirements are strict or when internal policy restricts cloud-based processing. The growing adoption of hybrid models underscores the need for dynamic creative optimization software to address both campaign performance and data control. This option can help a buyer keep sensitive data under its own governance while still using scalable serving infrastructure.
By Application:
Connected Television Creates a Faster-Growth OpportunitySocial media advertising accounted for 28.19% of the market share by application in 2025. The segment benefits from the scale of social inventory and from the ability to adapt messages by audience, device, and campaign objective. Platforms such as Meta, TikTok, and YouTube have made dynamic formats familiar to advertisers. Social campaigns can also produce frequent response signals that help teams refine creative versions. This keeps social media as the largest application base for DCO deployments. It also gives advertisers a familiar setting for testing how different messages and formats perform among defined audience groups.
Connected television advertising is projected to expand at a CAGR of 19.43% from 2026 to 2031. The channel requires creative that can use household-level information while meeting the visual quality expected in television environments. Display and video remain important applications for broad personalization needs, while retail media and digital out-of-home support feed-driven messaging. Email and owned media can support one-to-one personalization, although inconsistent measurement can restrict the feedback available for optimization. Smartly’s Amazon DSP integration and Roku partnership in 2026 underscore the growing importance of connected television in the dynamic creative optimization software market.
By Enterprise Size:
SMEs Gain Access Through Simpler PlatformsLarge enterprises held 64.83% of the market share of the market by enterprise size in 2025. Their position reflects larger campaign budgets, established data systems, and the need to coordinate advertising across several channels. Large organizations often have the resources to integrate feeds, analytics, and privacy controls into their creative workflows. They are also more likely to operate campaigns across several countries and audience groups. This complexity has historically made large enterprises the primary users of DCO software.
SMEs are projected to expand at a CAGR of 20.24% from 2026 to 2031. Cloud-based and self-service products are lowering the operational barrier that previously restricted DCO use to larger advertisers. Generative AI can help smaller teams create more usable creative variations without relying on a large design team. At the same time, large enterprises are looking for more advanced capabilities, including causal measurement, agent-based workflows, and compliance controls. Smartly completed its acquisition of INCRMNTAL in May 2026 to add incrementality measurement to its creative and media optimization capabilities. This separation in buyer needs supports a broader range of offerings within the dynamic creative optimization software market. Smaller users can prioritize easy setup, while larger users can seek deeper measurement, data, and governance functions.
By End User:
Retail and Travel Depend on Live Commercial InformationRetail and e-commerce accounted for 24.36% of the market share by end user in 2025. Retailers need creative that can reflect current product availability, prices, and inventory across many stock-keeping units. Static creative is less suitable when these details change frequently. DCO tools help retailers connect commercial feeds to approved creative formats across social, retail media, display, and connected television. This capability supports promotional activity while reducing the need to rebuild individual assets for each product. It also helps teams maintain more consistent product information when a campaign runs across multiple media channels.
Travel and hospitality is projected to expand at a CAGR of 18.91% from 2026 to 2031. Flight prices, hotel availability, and destination offers can change frequently, creating a clear role for live creative inputs. Amadeus introduced its Travel Advertising Platform in 2026 to connect forward-looking demand intelligence with advertising planning and activation. BFSI, IT and telecommunications, media and entertainment, and healthcare also use DCO for tailored offers, subscriber campaigns, content promotion, and patient education. The use cases vary, but each depends on matching an approved message to a relevant customer context.
Geography Analysis
North America Dynamic Creative Optimization Software Market
North America held 34.62% of the regional market in 2025. The region has a large retail media ecosystem, including Amazon, Walmart Connect, Kroger, and retailer-owned networks. It also has a concentration of large advertisers operating programmatic campaigns across several channels. The depth of its connected television and commerce media ecosystem supports demand for platforms that can adapt creative using household and retail data. Criteo and Dentsu France launched a fully orchestrated MCP video campaign in May 2026, while Mediaocean introduced NIVO AI in June 2026.
APAC Dynamic Creative Optimization Software Market
Asia-Pacific is projected to expand at a CAGR of 19.18% from 2026 to 2031, the highest regional rate in the dynamic creative optimization software market. Programmatic advertising grew 24% across the region in 2025, with 25% growth in China and 21% in India. Dentsu expects algorithmic buying to account for 79% of Asia-Pacific advertising spend by 2027, compared with 59.5% in 2024. Japan has robust programmatic activity, but advertising review processes under the Pharmaceutical Affairs Act can involve multiple rounds of human approval.
EMEA and South America Dynamic Creative Optimization Software Market
Europe accounted for a significant share of the dynamic creative optimization software market in 2025, led by the United Kingdom, Germany, and France. Mature digital advertising activity and larger budgets support ongoing demand for DCO platforms in these countries. South America is developing as an adoption region, with Brazil and Argentina supported by e-commerce growth and increasing programmatic activity. The Middle East and Africa are at an earlier stage, while Saudi Arabia and the United Arab Emirates are increasing digital advertising investment through broader digital infrastructure and online commerce.

Competitive Landscape
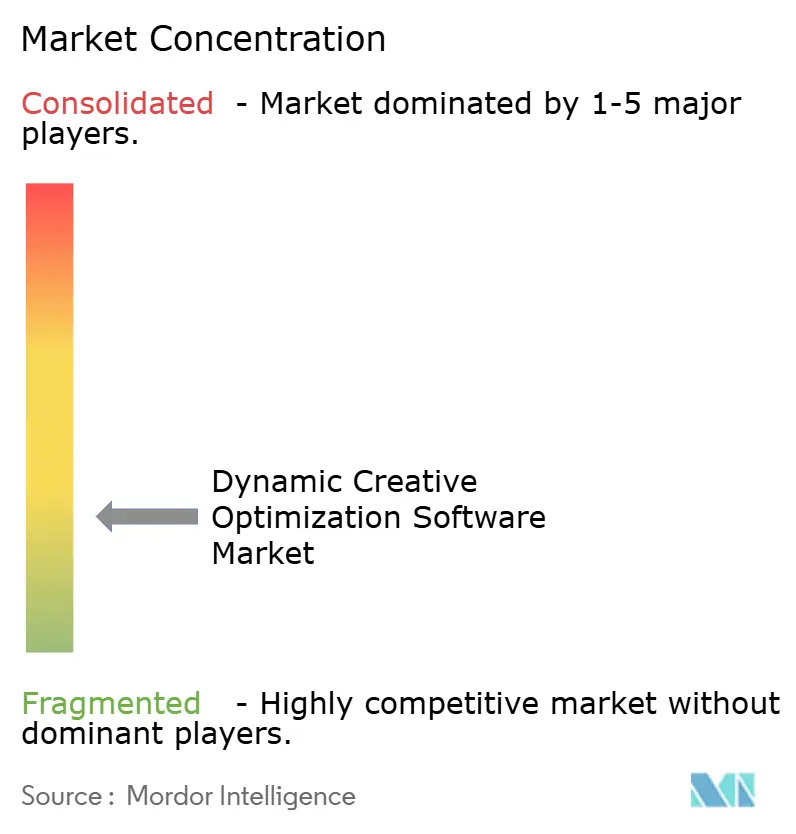
The dynamic creative optimization software market is fragmented. Smartly, Criteo, Celtra, and Innovid compete as established platforms, while other providers focus on connected television, retail media, or social commerce. Competition is moving beyond creative assembly toward capabilities that link creative decisions with measurement, data, and media activation. Smartly completed the acquisition of INCRMNTAL in May 2026, bringing AI-powered incrementality measurement into its creative and media optimization offering.
Criteo and Dentsu France launched a fully orchestrated MCP video campaign in May 2026. The campaign used AI agents for media planning, activation, and optimization. Mediaocean’s NIVO AI launch placed Innovid agents across creative, scoring, trafficking, and reporting functions. In 2026, Celtra partnered with PubMatic’s AgenticOS for connected television creative formats.
Opportunities remain in self-service connected television tools for mid-sized advertisers that cannot support extensive technical integration. Products that reduce manual creative review in regulated sectors also have an opening. The IAB released its AI Transparency and Disclosure Framework in January 2026, setting out risk-based disclosure expectations for AI-generated advertising content. Vendors that embed disclosure and governance into their creative workflows can better align with enterprise procurement needs. These requirements can favor providers that make review, disclosure, and recordkeeping part of the normal campaign process.
Dynamic Creative Optimization Software Industry Leaders
Celtra, Inc.
Smartly.io Inc.
Innovid Corp.
Adform A/S
Criteo S.A.
- *Disclaimer: Major Players sorted in no particular order
Dynamic Creative Optimization Software Market Companies Covered in this Report
- Celtra, Inc.
- Smartly.io Inc.
- Innovid Corp.
- Adform A/S
- Criteo S.A.
- Jivox Corporation
- Bannerflow AB
- Clinch US Inc.
- Clinch Labs Ltd.
- Adzymic Pte Ltd
- Zuuvi ApS
- RevJet, Inc.
- Choozle, Inc.
- Aarki, Inc.
- Creatopy Inc.
- Nativo, Inc.
- AdButler Inc.
- Spongecell, Inc.
- Groovinads S.L.
- Gamned SAS
- The COOL Company SAS
- Storyteq B.V.

Recent Industry Developments in Dynamic Creative Optimization Software Market
- July 2026: Vista Equity Partners and Quinti Capital submitted a bid to acquire Criteo at a premium exceeding 50% of its recent share price, valuing the company at USD 1.16 billion. The offer signaled private equity conviction in the long-term fundamentals of commerce media and dynamic creative optimization software market infrastructure. It also drew attention to the value placed on platforms that connect commerce data, creative activity, and campaign execution. Criteo had not publicly confirmed a decision at the time of the offer.
- June 2026: Smartly announced a strategic partnership with Roku, the leading TV streaming platform in the United States, Canada, and Mexico, connecting Smartly’s platform to Roku Ads Manager through the Roku Ads API. The integration enables brands managing over USD 7 billion in annual advertising spend through Smartly to adapt proven social creative strategies to connected television without rebuilding campaign infrastructure. It was intended to let teams use established creative approaches across a television environment while retaining their existing dynamic creative optimization software market operating process.
- June 2026: Mediaocean launched NIVO AI, embedding Innovid agents across creative generation, predictive scoring, campaign trafficking, and reporting. Pilot programs with FanDuel, Optimum, Paddy Power, and Canvas showed workflow efficiency gains of up to 90% compared with manual campaign setup. The launch positioned AI agents as support for the full sequence of creative preparation, campaign delivery, and dynamic creative optimization software market reporting.
- May 2026: Smartly completed the acquisition of INCRMNTAL, an AI-powered incrementality measurement platform. The acquisition integrated causal lift measurement into Smartly’s creative and media optimization engine, and all 25 INCRMNTAL employees joined Smartly’s workforce of approximately 900 people. The combined capability supports dynamic creative optimization software market creative pausing and budget reallocation using incremental outcome signals rather than only standard delivery measures.


Global Dynamic Creative Optimization Software Market Report Scope
The Dynamic Creative Optimization Software Market refers to the ecosystem of software solutions and associated services that utilize machine learning, artificial intelligence, and real-time data signals to automatically customize, assemble, and optimize digital advertising creative elements. By leveraging user data, contextual information, and behavioral signals, DCO platforms dynamically alter images, videos, headlines, and calls to action to deliver the most personalized and relevant ad variations to each viewer at the exact moment of engagement. The market encompasses software deployed via cloud, on-premise, or hybrid models, along with implementation and consulting services, catering to organizations of all sizes across diverse industries such as retail, BFSI, media, and IT. These solutions are applied across a wide array of digital channels, including display, social media, video, connected television (CTV), retail media, and digital out-of-home (DOOH) advertising. Ultimately, DCO software empowers brands, advertisers, and publishers to move beyond static creative testing, significantly improving campaign performance, scaling creative personalization, and maximizing return on ad spend (ROAS).
The Dynamic Creative Optimization Software Market Report is Segmented by Component (Software, and Services), Deployment Mode (Cloud, On-Premise, and Hybrid), Application (Display Advertising, Social Media Advertising, Video Advertising, Connected Television (CTV) Advertising, Retail Media Advertising, Digital Out-of-Home (DOOH) Advertising, and Email & Owned Media Advertising), Enterprise Size (Large Enterprises, and Small and Medium Enterprises), End User (IT and Telecommunication, BFSI, Healthcare and Life Sciences, Retail and E-Commerce, Industrial Manufacturing, Education and Research Institutions, Media and Entertainment, Government and Administration, Travel and Hospitality, and Other End Users), and Geography (North America, South America, Europe, Asia-Pacific, and Middle East and Africa). The Market Forecasts are Provided in Terms of Value (USD).
| Software |
| Services |
| Cloud |
| On-Premise |
| Hybrid |
| Display Advertising |
| Social Media Advertising |
| Video Advertising |
| Connected Television (CTV) Advertising |
| Retail Media Advertising |
| Digital Out-of-Home (DOOH) Advertising |
| Email and Owned Media Advertising |
| Large Enterprises |
| Small and Medium Enterprises |
| IT and Telecommunication |
| BFSI |
| Healthcare and Life Sciences |
| Retail and E-Commerce |
| Industrial Manufacturing |
| Education and Research Institutions |
| Media and Entertainment |
| Government and Administration |
| Travel and Hospitality |
| Other End Users |
| North America | United States | |
| Canada | ||
| Mexico | ||
| South America | Brazil | |
| Argentina | ||
| Rest of South America | ||
| Europe | Germany | |
| United Kingdom | ||
| France | ||
| Russia | ||
| Spain | ||
| Rest of Europe | ||
| Asia-Pacific | China | |
| Japan | ||
| India | ||
| South Korea | ||
| Southeast Asia | ||
| Rest of Asia-Pacific | ||
| Middle East and Africa | Middle East | Saudi Arabia |
| United Arab Emirates | ||
| Rest of Middle East | ||
| Africa | South Africa | |
| Nigeria | ||
| Rest of Africa | ||
| By Component | Software | ||
| Services | |||
| By Deployment Mode | Cloud | ||
| On-Premise | |||
| Hybrid | |||
| By Application | Display Advertising | ||
| Social Media Advertising | |||
| Video Advertising | |||
| Connected Television (CTV) Advertising | |||
| Retail Media Advertising | |||
| Digital Out-of-Home (DOOH) Advertising | |||
| Email and Owned Media Advertising | |||
| By Enterprise Size | Large Enterprises | ||
| Small and Medium Enterprises | |||
| By End User | IT and Telecommunication | ||
| BFSI | |||
| Healthcare and Life Sciences | |||
| Retail and E-Commerce | |||
| Industrial Manufacturing | |||
| Education and Research Institutions | |||
| Media and Entertainment | |||
| Government and Administration | |||
| Travel and Hospitality | |||
| Other End Users | |||
| By Geography | North America | United States | |
| Canada | |||
| Mexico | |||
| South America | Brazil | ||
| Argentina | |||
| Rest of South America | |||
| Europe | Germany | ||
| United Kingdom | |||
| France | |||
| Russia | |||
| Spain | |||
| Rest of Europe | |||
| Asia-Pacific | China | ||
| Japan | |||
| India | |||
| South Korea | |||
| Southeast Asia | |||
| Rest of Asia-Pacific | |||
| Middle East and Africa | Middle East | Saudi Arabia | |
| United Arab Emirates | |||
| Rest of Middle East | |||
| Africa | South Africa | ||
| Nigeria | |||
| Rest of Africa | |||


Key Questions Answered in the Report
What is the size of the dynamic creative optimization software market?
The dynamic creative optimization software market size is USD 1.97 billion in 2026 and is projected to reach USD 4.09 billion by 2031, at a CAGR of 15.73% from 2026 to 2031. Growth is tied to the growing use of personalized creative across programmatic channels.
What is driving demand for dynamic creative optimization software?
Programmatic advertising, retail media, generative AI, and the need to manage creative across social media and connected television are increasing adoption. Privacy requirements are also increasing the value of contextual and first-party data-led creative decisioning.
Which component leads dynamic creative optimization software spending?
Software led by component with a 71.24% share in 2025, while services are projected to grow faster at a CAGR of 18.82% through 2031. Service demand reflects the integration, campaign planning, and ongoing analysis required by more complex deployments.
Which application is growing fastest for dynamic creative optimization software?
Connected television advertising is projected to grow at a CAGR of 19.43% from 2026 to 2031, supported by demand for household-level personalized video creative. The format combines the production expectations of television with the targeting needs of digital advertising.
Which users are adopting dynamic creative optimization software fastest?
SMEs are projected to grow at a CAGR of 20.24%, while travel and hospitality is the fastest-growing end-user segment at a CAGR of 18.91% through 2031. Self-service tools and AI-supported asset creation are making adoption more practical for smaller teams.
Which region is expanding fastest for dynamic creative optimization software?
Asia-Pacific is projected to grow at a CAGR of 19.18% from 2026 to 2031, supported by increasing programmatic advertising activity and retail media investment. The regions growing use of algorithmic buying is increasing the need for locally suitable creative technology and data support.
Page last updated on:


 Your data is secure and never sold or shared.


