
Drill Bit Market Size and Share
Market Overview
| Study Period | 2021 - 2031 |
|---|---|
| Market Size (2026) | USD 6.5 Billion |
| Market Size (2031) | USD 8.64 Billion |
| Growth Rate (2026 - 2031) | 5.86 % |
| Fastest Growing Market | Asia Pacific |
| Largest Market | North America |
| Market Concentration | Medium |
Major Players
*Disclaimer: Major Players sorted in no particular order Image © Mordor Intelligence. Reuse requires attribution under CC BY 4.0. |
|
Drill Bit Market Analysis by Mordor Intelligence
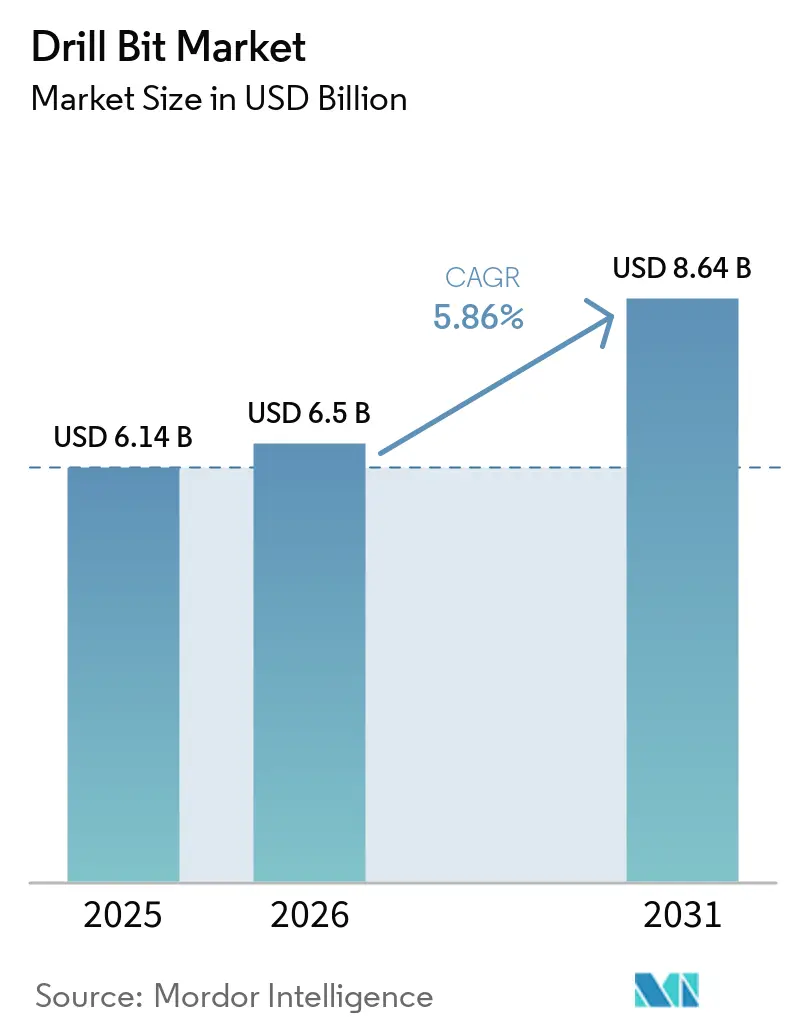
Drill Bit market size in 2026 is estimated at USD 6.5 billion, growing from 2025 value of USD 6.14 billion with 2031 projections showing USD 8.64 billion, growing at 5.86% CAGR over 2026-2031.
Elevated shale activity, deep-water expenditure, and the rapid spread of polycrystalline diamond compact (PDC) technology continue to propel the Global Drill Bit market. Technological milestones, most notably AI-enhanced drilling automation and digital-twin bit modelling, are shortening well cycles and lowering cost per foot. Operators are also prioritising bits that withstand extreme down-hole environments, a shift that supports the Global Drill Bit market as geothermal and natural-hydrogen wells multiply. Supply-chain vigilance around synthetic diamonds and critical metals remains critical, yet sustained demand across onshore and offshore settings anchors a stable growth outlook.
Key Report Takeaways
- By type, fixed-cutter bits held a 44.30% share of the Global Drill Bit market in 2025, while hybrid bits are projected to rise at an 8.25% CAGR through 2031.
- By location of deployment, onshore drilling accounted for 71.80% of the Global Drill Bit market size in 2025, whereas offshore units are expected to advance at a 7.55% CAGR through 2031.
- By application, oil and gas captured 68.10% of the Global Drill Bit market share in 2025; geothermal drilling is expected to expand at a 8.95% CAGR through 2031.
- By geography, North America led with a 36.40% revenue share in 2025; the Asia-Pacific region is on track to post an 7.65% CAGR through 2031.
Note: Market size and forecast figures in this report are generated using Mordor Intelligence’s proprietary estimation framework, updated with the latest available data and insights as of 2026.
Global Drill Bit Market Trends and Insights
Drivers Impact Analysis*
| Driver | (~) % Impact on CAGR Forecast | Geographic Relevance | Impact Timeline |
|---|---|---|---|
| Shale gas revival in North America | 1.20% | North America, with spillover to Argentina | Medium term (2-4 years) |
| Deep-water E&P CAPEX upswing | 0.90% | Global, concentrated in Brazil, Gulf of Mexico, West Africa | Long term (≥ 4 years) |
| Rapid switch to PDC bits for higher ROP | 1.50% | Global, led by North America and Middle East | Short term (≤ 2 years) |
| Geothermal well drilling incentives | 0.80% | Global, early gains in US, Iceland, Philippines | Long term (≥ 4 years) |
| Nascent natural-hydrogen exploration demand | 0.30% | Global, concentrated in Australia, France, Colombia | Long term (≥ 4 years) |
| Digital-twin-optimised bit design adoption | 0.70% | Global, led by North America and Europe | Medium term (2-4 years) |
| Source: Mordor Intelligence | |||
Shale Gas Revival in North America
Shale output momentum lifts the Global Drill Bit market as U.S. natural-gas production is set to rise from 7.2 trillion cubic feet in 2025 toward 8.8 trillion cubic feet by 2050.[1]U.S. Energy Information Administration, “Annual Energy Outlook 2025,” eia.gov Robust LNG export plans keep rig demand high, with the Permian Basin hosting 60% of U.S. onshore rigs. Longer laterals that exceed 20,000 feet in single runs foster demand for advanced PDC designs. Argentina’s Vaca Muerta formation broadens the opportunity pool, targeting 1 million barrels per day by 2030 and allocating more than USD 1 billion for specialised bit procurement. Productivity gains stemming from AI-enabled drilling platforms further strengthen the Global Drill Bit market outlook within shale domains.
Deep-Water E&P CAPEX Upswing
Capital commitments for deepwater are improving the utilisation of rigs that command day rates above USD 400,000, thereby expanding the Global Drill Bit market. Petrobras awarded SLB a USD 800 million integrated contract covering more than 100 wells, underlining strong bit demand in Brazil’s pre-salt cluster. Chevron’s Anchor project and Woodside’s Trion programme rely on 20,000 psi subsea systems that place premium requirements on cutter resilience. West Africa’s deep-water projects, including Angola’s Kaminho FPSO, are adopting low-emission drilling systems that require high-performance bits. This sustained pipeline of technically complex wells is pushing manufacturers to innovate thermal-stable PDC cutters that can endure ultra-high-pressure conditions.
Rapid Switch to PDC Bits for Higher ROP
Modern PDC bits drill 1.5 times faster than prior iterations, reducing well time and yielding marked cost savings.[2]Oil & Gas Journal, "Industry pushes use of PDC bits to speed drilling, cut costs," ogj.com Catalyst-free diamond synthesis processes elevate hardness and thermal stability, extending tool life in abrasive rock. The annual PDC segment already exceeds USD 4.5 billion, representing nearly one-third of the Global Drill Bit market. Geothermal projects see drilling costs fall by up to 70% when PDC bits replace roller cones. AI-powered bit-run analytics now refine design iterations within weeks, firmly entrenching PDC technology as the industry norm across hydrocarbons and renewables.
Geothermal Well Drilling Incentives
Government policies aim to scale geothermal capacity toward 90 gigawatts by 2050, energising the Global Drill Bit market.[3]U.S. Department of Energy, “GeoVision Report,” energy.gov Enhanced geothermal systems (EGS) have reduced well costs to USD 4.8 million while cutting drilling times by 70%. Europe is deploying dedicated funds; France alone proposes USD 150 million to accelerate the rollout of geothermal energy. PDC bits equipped with synthetic diamond matrices outperform legacy designs in hard-rock heat reservoirs. As carbon targets tighten, project sponsors view high-temperature wells as a bankable pathway, driving sustained demand for extreme-duty drill bits.
Restraints Impact Analysis*
| Restraint | (~) % Impact on CAGR Forecast | Geographic Relevance | Impact Timeline |
|---|---|---|---|
| Oil-price volatility curbing rig counts | -1.80% | Global, most pronounced in North America shale plays | Short term (≤ 2 years) |
| Stricter environment & flaring rules | -0.90% | Global, led by North America and Europe | Medium term (2-4 years) |
| Synthetic-diamond supply-chain risk | -0.60% | Global, concentrated in China-dependent supply chains | Medium term (2-4 years) |
| Re-manufactured bit cannibalisation | -0.40% | Global, most impact in cost-sensitive markets | Long term (≥ 4 years) |
| Source: Mordor Intelligence | |||
Oil-Price Volatility Curbing Rig Counts
A Brent range of USD 65-74 per barrel tempers exploration budgets and sways the Global Drill Bit market. Baker Hughes rig data show pauses in new-well programs whenever prices breach downside triggers. Saudi Aramco’s 2024 suspension of more than 20 jackups illustrates how national oil companies adjust their capacity in low-price environments. Independent producers remain especially price sensitive, curbing bit orders for marginal acreage. Even as capital discipline lessens the direct linkage between price and rig activity, commodity swings still stall procurement cycles for high-specification tools.
Stricter Environment & Flaring Rules
Emission standards are tightening across producing basins. The U.S. EPA requires an 80% reduction in methane emissions, imposing compliance costs that reshape drilling economics.[4]U.S. Environmental Protection Agency, “Final Methane Rule 2024,” epa.gov Land-permit approvals now hinge on waste-gas mitigation, nudging operators toward electric rigs and low-emission bits. Smaller firms struggle with increased reporting burdens, which tilts market share toward larger contractors with the financial resources to adopt greener technologies. These policies influence bit selection criteria because hydraulic optimisation must now align with emissions-reduction hardware, adding complexity to design and procurement decisions.
*Our forecasts treat driver/restraint impacts as directional, not additive. The impact forecasts reflect baseline growth, mix effects, and variable interactions.
Segment Analysis
By Type: PDC Leadership Reinforces Performance Edge
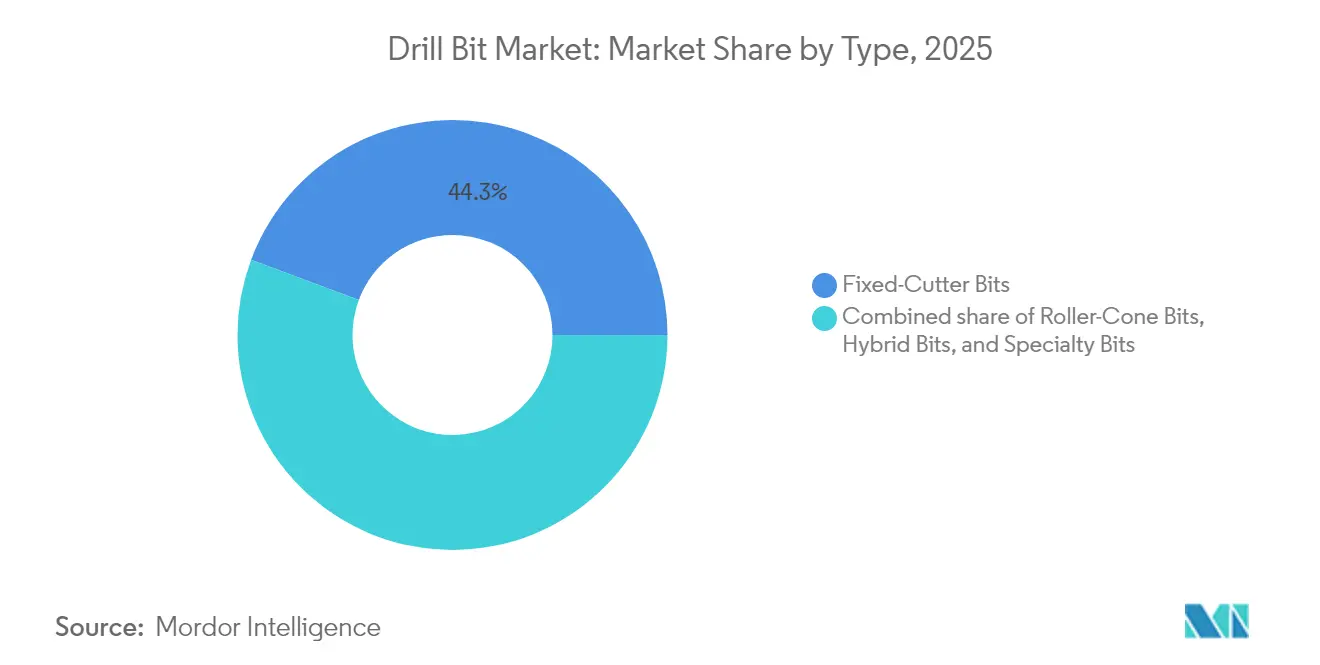
Fixed-cutter technology held 44.30% of the Global Drill Bit market in 2025. Demand gravitates to PDC cutters that already drill 75-80% of worldwide footage, anchoring the Global Drill Bit market size for this class. Hybrid bits, which combine the durability of roller cones with the speed of diamonds, are projected to grow at an 8.25% CAGR through 2031, reflecting operator demand for single-run solutions.
Continued laboratory gains in catalyst-free diamond bonding have stretched thermal limits, making PDC products viable in formations once restricted to roller cones. Manufacturers such as NOV mark half a century of PDC innovation, pointing to design lifecycles that now incorporate AI-driven stress mapping. As a result, the Global Drill Bit market enjoys a virtuous cycle whereby improved cutter life reduces non-productive time, echoing operator priorities for efficiency and safety.



By Location of Deployment: Onshore Breadth, Offshore Acceleration
Onshore activity accounted for 71.80% of the Global Drill Bit market size in 2025. Land rigs in the Permian Basin and growing Asian shale plays underpin stable demand for bit volume. Forecasts indicate that global land rig demand will scale to 4,704 units by 2029, sustaining a sizable baseline for bit suppliers.
Offshore drilling grows faster at a 7.55% CAGR, fuelled by deep-water prospects in Brazil, the Gulf of Mexico, and West Africa. Day rates have surpassed USD 400,000 for many sixth-generation units, widening budgets for high-performance bits that can withstand 20,000 psi pressure regimes. While recent jackup cancellations in the Middle East trim some near-term demand, the Global Drill Bit market still benefits from long-cycle deep-water fields that favour premium bit technology.
By Application: Energy Transition Alters Consumption Mix
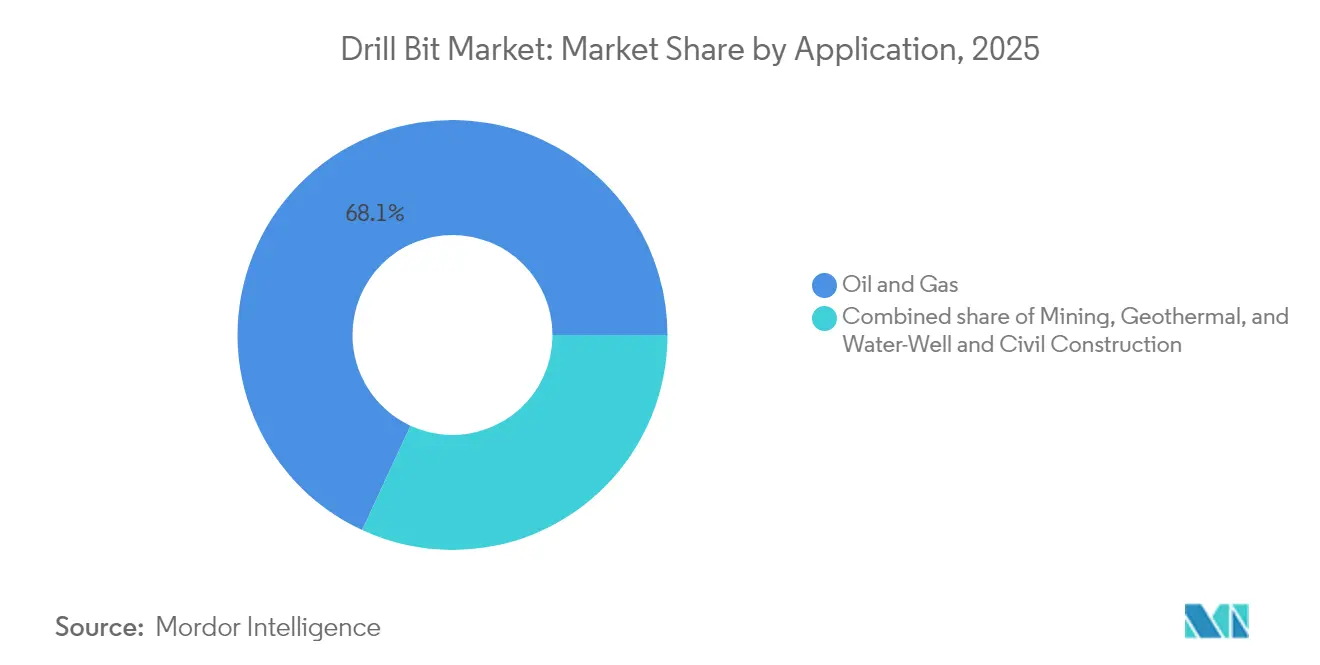
Oil and gas uses dominated 68.10% of the Global Drill Bit market share in 2025. Upstream CAPEX continues to support steady replacement demand for bits capable of optimising well economics. The Global Drill Bit market size tied to geothermal wells is, however, expanding at a 8.95% CAGR as governments scale climate-aligned energy sources.
EGS breakthroughs have revived interest in hard-rock, high-temperature reservoirs where synthetic-diamond PDC bits and geothermal drill bits shine. In parallel, natural-hydrogen exploration and carbon-capture injection wells create novel hole conditions that require special gauge and cutting structures. These emerging end-uses diversify the Global Drill Bit market, reducing the sector’s historical dependence on crude oil price fluctuations.
Geography Analysis
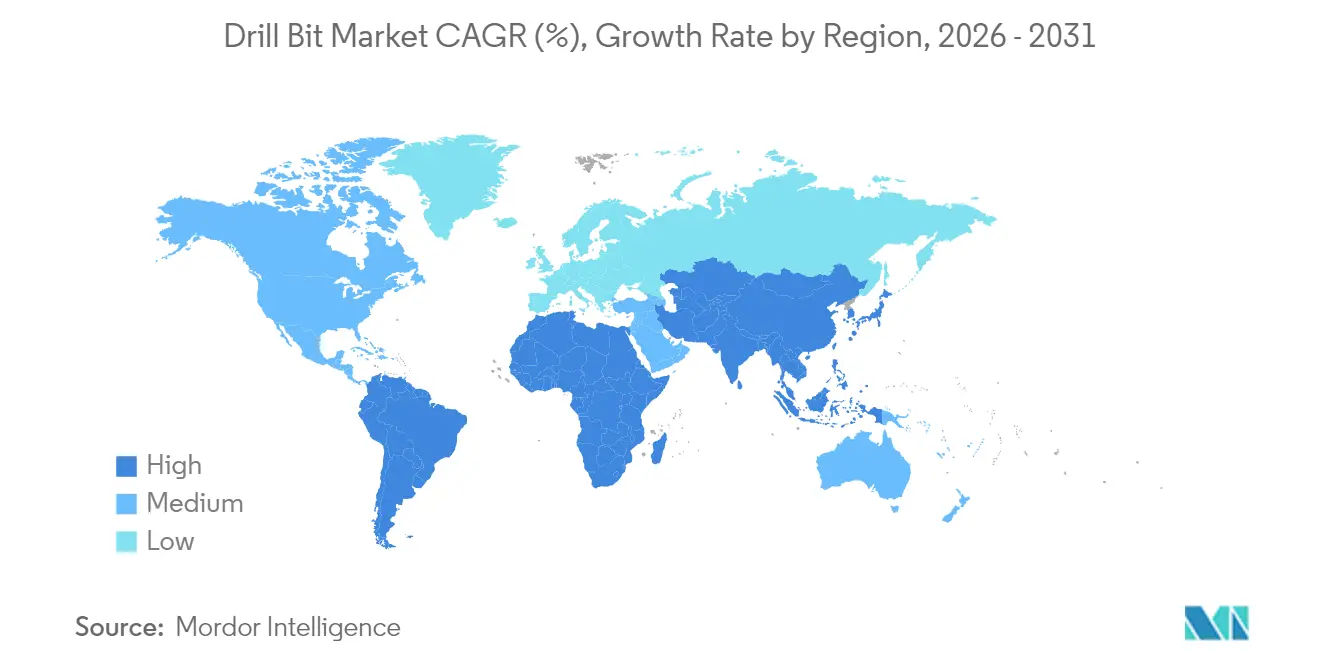
North America retained 36.40% of the Global Drill Bit market in 2025, owing to advanced shale designs and ongoing developments in the Gulf of Mexico. AI-guided drilling increased average penetration rates by 30%, resulting in rapid paybacks on premium bits. Canadian oil-sands activity and Mexico’s Trion ultra-deepwater campaign add incremental demand, reinforcing the region’s scale advantage.
The Asia-Pacific region represents the fastest-growing market for the Global Drill Bit market, posting an 7.65% CAGR through 2031. China leads land-rig counts, while India plans to lift its fleet from 111 units in 2024 to 142 by 2028, moves that swell bit procurement pipelines. Offshore CAPEX that exceeds USD 300 billion in 2025, particularly in Chinese waters, tightens regional supply chains for critical metals and synthetic diamonds.
The Middle East and Africa deliver mixed but pivotal demand. ADNOC Drilling records double-digit revenue growth, yet Saudi rig suspensions temper utilisation metrics. West African deep-water projects drive demand for ultra-high-pressure bits, while Europe’s geothermal initiatives help offset some of the decline in the North Sea. South America’s Vaca Muerta programme offers one of the decade’s largest unconventional prospects, enlarging the Global Drill Bit market footprint across the hemisphere.

Regulatory Landscape
In offshore oil and gas, drill-bit and drill-string procurement is closely tied to U.S. Bureau of Safety and Environmental Enforcement (BSEE) requirements under 30 CFR Part 250, which incorporate referenced industry standards for well control and equipment integrity. A key recent anchor is BSEE's high pressure high temperature (HPHT) equipment rule, effective October 29, 2024, which introduced new compliance expectations. For certain equipment and novel technologies used in Outer Continental Shelf (OCS) operations, the rule includes mandatory independent third party (I3P) reviews, raising documentation and quality-control requirements that flow through to bit selection for HPHT drilling programs.
At the manufacturing and quality-assurance level, American Petroleum Institute (API) standards remain a primary compliance baseline for rotary drill-stem elements, including API Specification 7-1 under the API Monogram Program. API issued Addendum 1 to API Spec 7-1 (2nd Edition) in March 2025, with a Monogram Program effective date of September 3, 2025, which requires suppliers and OEMs to align tolerances, materials, and QA procedures with the updated requirements. In 2026, BSEE also advanced rulemaking for OCS operations, including a proposed revision released February 23, 2026, to revisit elements of the 2023 Blowout Preventer Systems and Well Control Rule, and a separate final rule on production measurement and safety-related industry standards that becomes effective August 10, 2026. Together, these steps reinforce the need for permit-ready standardization across drilling systems used in U.S. offshore wells.
Competitive Landscape
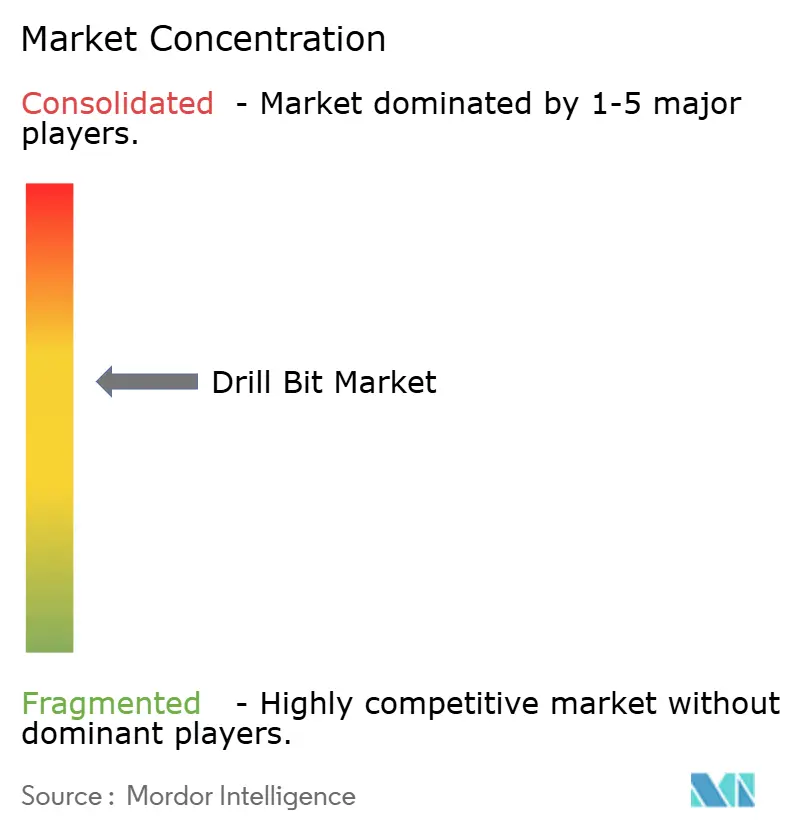
Market concentration is moderate as integrated service giants and specialist manufacturers compete for a share of the Global Drill Bit market. SLB’s USD 7.8 billion purchase of ChampionX boosts its surface-to-downhole portfolio and preserves MegaDiamond’s cutter capacity. Helmerich & Payne’s merger with KCA Deutag forms a land-drilling force that will standardise bit specifications across fleets.
Technology differentiation remains the central competitive lever. Digital-twin design loops and autonomous steering tools shorten product cycles and favour firms with robust R&D budgets. Partnerships, such as the SLB-Nabors automation alliance, illustrate how data analytics merge with hardware to increase well productivity.
Emerging contenders are harnessing AI-driven drilling platforms to reduce well times by 30%, challenging incumbent cost-to-value equations. At the same time, bit recyclers attract attention in cost-sensitive markets, albeit at the risk of cannibalising new-bit demand. Overall, the Global Drill Bit market rewards players who pair material science advances with integrated digital services.
Drill Bit Industry Leaders
-
Schlumberger Ltd
-
Halliburton Co.
-
Baker Hughes Co.
-
National Oilwell Varco Inc.
-
Varel Energy Solutions
- *Disclaimer: Major Players sorted in no particular order

Market Opportunities and Future Outlook
Premium, high-durability bit offerings and service-integrated workflows remain a clear opportunity for deepwater and harsh-environment offshore programs, where performance and reliability dominate total well cost. Contract activity in 2026 reflects this continued commitment to long-cycle offshore work, including Transocean securing over USD 1 billion in backlog with Equinor for seven rig-years on the Norwegian Continental Shelf using harsh-environment semisubmersibles. Halliburton's 2026 integrated drilling and completions awards for TotalEnergies-operated GranMorgu offshore Suriname, along with planned local infrastructure upgrades (including a new completions and drilling workshop), also show how bit supply is increasingly bundled into broader well-construction execution models that combine digital, automation, and onsite support.
A second opportunity area is materials and design substitution driven by cost volatility and supply-chain resilience, especially where tungsten exposure is high. In 2026, U.S. manufacturers reported shifting product mix toward steel-body bits after tungsten prices surged from October 2025 levels, with Varel Energy Solutions moving 15% to 20% of output to steel-body designs and Ulterra Drilling Technologies shifting to a 65% to 70% steel-body mix. This creates headroom for suppliers that can maintain ROP and durability while reducing reliance on constrained inputs. On the technology side, field and lab work highlighted in 2026 points to continued room for improving PDC cutter survivability and vibration management, including multi-ridge 3D cutter geometries and graded SiC-nanodiamond surface treatments intended to reduce spalling and improve drilling metrics in hard and transitional formations, supporting differentiation beyond commodity bit supply.
Recent Industry Developments
- May 2026: Baker Hughes extended and expanded an integrated well construction contract with Petrobras for work in Brazil, bringing together services and enabling technologies that include Dynamus extended-life drill bits. The renewal reinforces demand for premium bit performance in deepwater-style programs where tool life and consistency reduce non-productive time and total well cost.
- April 2026: Halliburton acquired Sekal AS to strengthen its drilling automation portfolio, integrating Sekal's DrillTronics automation with Halliburton LOGIX automation and remote operations. This broadens automated execution capability that can support tighter bit-run optimization and faster design-to-field learning cycles, particularly on complex wells.
- May 2025: SLB launched Retina at-bit imaging technology to help identify formation characteristics while drilling and support real-time drilling decisions. At-bit measurement and interpretation strengthens the feedback loop between downhole conditions and bit selection, improving performance consistency in long laterals and heterogeneous formations.


Research Methodology Framework and Report Scope
Market Definition and Coverage
For this study, the drill bit market covers revenue from drill bits sold for drilling activities across oil and gas, mining, geothermal, water-well, and civil construction, considering both onshore and offshore settings, with all values reported in USD.
Scope exclusions: downhole tools other than drill bits (such as motors, MWD/LWD systems, and drill pipes) are excluded, and only the drill bit component is counted.
Segmentation Overview
-
By Type
- Roller-Cone Bits
- Fixed-Cutter Bits
- Hybrid Bits
- Specialty Bits (Core, Reaming)
-
By Location of Deployment
- Onshore
- Offshore
-
By Application
- Oil and Gas
- Mining
- Geothermal
- Water-Well and Civil Construction
-
Geography
-
North America
- United States
- Canada
- Mexico
-
Europe
- Germany
- United Kingdom
- France
- Italy
- Norway
- Russia
- Rest of Europe
-
Asia-Pacific
- China
- India
- Japan
- South Korea
- ASEAN Countries
- Rest of Asia-Pacific
-
South America
- Brazil
- Argentina
- Rest of South America
-
Middle East and Africa
- Saudi Arabia
- United Arab Emirates
- Qatar
- South Africa
- Egypt
- Nigeria
- Rest of Middle East and Africa
-
North America
Data Sources, Market Sizing, and Validation
Desk Research
We start with desk research to set the market boundary, align definitions, and build a clean list of demand and supply indicators that can be checked again during interviews. Public sources are used for the core context, such as U.S. EIA drilling activity signals, USGS mining statistics, IEA energy and geothermal updates, Baker Hughes rig count releases, and national geological surveys and energy ministries where available.
After that, we review manufacturer and distributor websites, annual reports, and investor decks to understand product positioning and typical replacement patterns. A paid subscription for company financials and news is used to confirm revenue references and corporate actions, and patent databases are checked for changes in cutter materials and bit design direction. The desk sources mentioned are illustrative, and we use additional public and paid references to collect data, cross-check figures, and clarify assumptions.
Primary Interviews and Surveys
Primary work is used to stress-test the desk assumptions, especially around bit life, mix shifts between roller-cone and fixed-cutter designs, and the pricing progression that depends on formation hardness and operating intensity. We speak with drill bit suppliers, channel partners, and end users across oil and gas, mining, and construction, and we balance inputs across APAC, EMEA, and the Americas so regional drilling cycles are not over-read from a single geography.
Distribution of primary research fieldwork respondents
| Company type | Respondent position | Region |
|---|---|---|
| Top tier: 36% | CXOs: 17% | APAC: 44% |
| Mid tier: 43% | Functional/Unit leaders: 25% | EMEA: 37% |
| Smaller Players: 21% | Managers: 58% | Americas: 19% |
Market-Sizing & Forecasting
The sizing is built using a top-down model where drilling and excavation activity is translated into a demand pool for drill bits by use case, and then converted to value using typical replacement intensity and average selling prices. Because drilling patterns differ by end use, we rely on market-specific inputs such as active rig counts and footage drilled in oil and gas, meters drilled and blast-hole activity in mining, geothermal well counts and depth trends, the onshore versus offshore mix, and observed shifts between roller-cone and fixed-cutter consumption.
Once the demand pool is constructed, we corroborate totals with selective bottom-up approximations, including supplier revenue checks, channel feedback on shipment direction, and sampled ASP times volume logic for major bit categories. If a country or end-use pocket has weak visibility, assumptions are filled using nearby comparable markets and then tightened during follow-up calls, so totals do not drift away from observable drilling signals. For forecasting, we use scenario analysis supported by expert consensus on drilling capex direction, commodity-linked activity levels, and expected product mix changes that affect replacement rates and pricing over time.
Data Validation & Update Cycle
Validation is done in steps so the final number is not driven by a single dataset. We compare outputs against independent signals such as drilling activity releases, mining production direction, and trade or shipment cues where they are meaningful, then we look for sharp year-to-year jumps that do not match those indicators.
Before sign-off, the model is reviewed by another analyst for math integrity, unit consistency, and scope alignment, and respondents are re-contacted when a major variance cannot be explained by known events. Reports are refreshed annually, with interim updates when material changes occur in drilling activity or pricing, and a final pre-delivery pass is completed so clients receive the latest updated view.
Mordor Intelligence's Drill Bit Market Estimate Compared With Other Published Estimates
Published market sizes for drill bits often do not line up because the counting rules differ, even when the titles look similar. The biggest drivers are usually what gets included as a drill bit, which end uses are counted, the base year chosen, and how pricing is converted into USD.
Some published figures blend broader cutting tool families and adjacent drilling equipment into the same number, which inflates the total. Mordor Intelligence counts only drill bits used across oil and gas, mining, geothermal, water-well, and civil construction, and it keeps other downhole tools and drilling systems outside the value, with assumptions re-checked against activity signals and interview feedback.
Benchmark comparison
| Source | Market Size | Gaps in Research Methodology |
|---|---|---|
| Mordor Intelligence | USD 6.50 B (2026) | |
| Industry Data Publisher A | USD 8.64 B (2025) | Uses a different base year and can reflect a broader end-use and tool set beyond drill bits, which shifts the total upward even before forecasting choices are applied. |
| Industry Research Portal B | USD 12.80 B (2024) | Appears to include wider industrial drill bit categories and general-purpose drilling applications, and the pricing build can be less tied to drilling intensity and replacement-rate checks. |
The spread in the table mainly comes from scope and timing rather than one simple math difference. When the counted items are limited to drill bits only, and when replacement intensity and ASP movement are kept consistent with drilling and excavation activity, the resulting value is easier to trace and repeat across years.


Key Questions Answered in the Report
What is the current size of the Global Drill Bit market?
The Global Drill Bit market size is valued at USD 6.5 billion in 2026.
What is the expected growth rate of the Global Drill Bit market?
The market is forecast to expand at a 5.86% CAGR, reaching USD 8.64 billion by 2031.
Which region is projected to record the fastest growth?
Asia-Pacific is set to advance at a 7.65% CAGR through 2031, driven by rising drilling activity in China and India.
Which region is projected to record the fastest growth?
Asia-Pacific is set to advance at a 7.65% CAGR through 2031, driven by rising drilling activity in China and India.
How is geothermal drilling influencing future demand?
Incentives and enhanced geothermal systems are boosting geothermal well counts, pushing drill-bit demand in this segment at a 8.95% CAGR.
What key risks could moderate market expansion?
Oil-price volatility, stricter methane-emissions rules, and supply-chain constraints for synthetic diamonds remain the primary challenges for suppliers.
Page last updated on:





