Digital Pharmaceutical Supply Chain Management Market Size and Share
Market Overview
| Study Period | 2020 - 2031 |
|---|---|
| Market Size (2026) | USD 1.35 Billion |
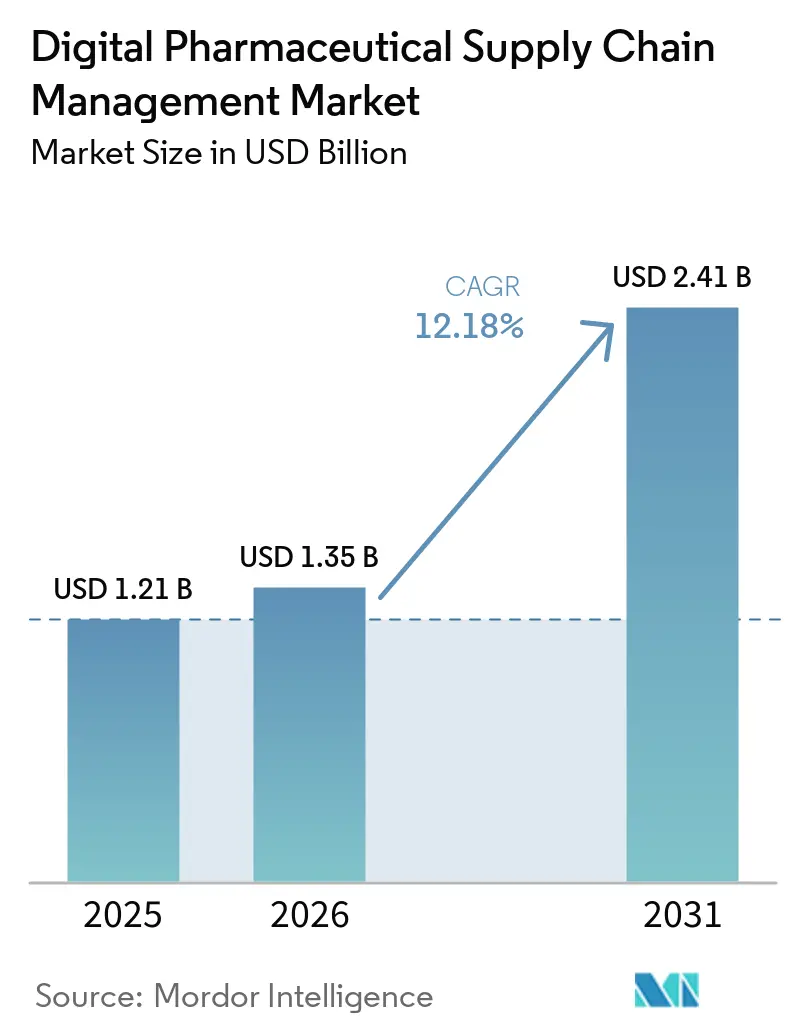
| Market Size (2031) | USD 2.41 Billion |
| Growth Rate (2026 - 2031) | 12.18% CAGR |
| Fastest Growing Market | Asia-Pacific |
| Largest Market | North America |
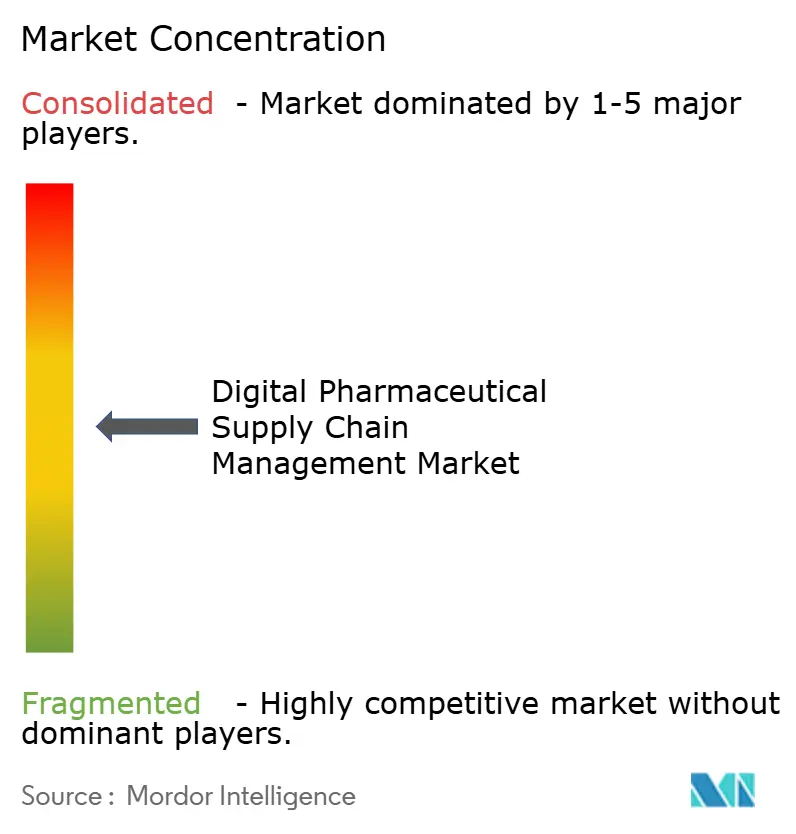
| Market Concentration | Medium |
Major Players *Disclaimer: Major Players sorted in no particular order Image © Mordor Intelligence. Reuse requires attribution under CC BY 4.0. | |
Digital Pharmaceutical Supply Chain Management Market Analysis by Mordor Intelligence
The Digital Pharmaceutical Supply Chain Management Market size was valued at USD 1.21 billion in 2025 and is estimated to grow from USD 1.35 billion in 2026 to reach USD 2.41 billion by 2031, at a CAGR of 12.18% during the forecast period (2026-2031).
The upward trajectory stems from fast-approaching serialization enforcement deadlines, wider cloud adoption that embeds artificial intelligence for demand sensing, and surging third-party logistics spend linked to biologics and cell-and-gene therapies. Vendors are bundling software, hardware, and managed services into consumption-based contracts that reduce cash burn for mid-tier manufacturers while locking in multi-year recurring revenue. North America dominates due to the Drug Supply Chain Security Act, yet Asia-Pacific is the fastest grower as China, India, Japan, and South Korea scale biologics plants fitted with IoT-enabled cold-chain monitoring. Competitive intensity is rising as enterprise software firms, niche serialization specialists, and logistics majors converge on hybrid deployment offerings that mix on-premise execution with cloud-native orchestration.
Key Report Takeaways
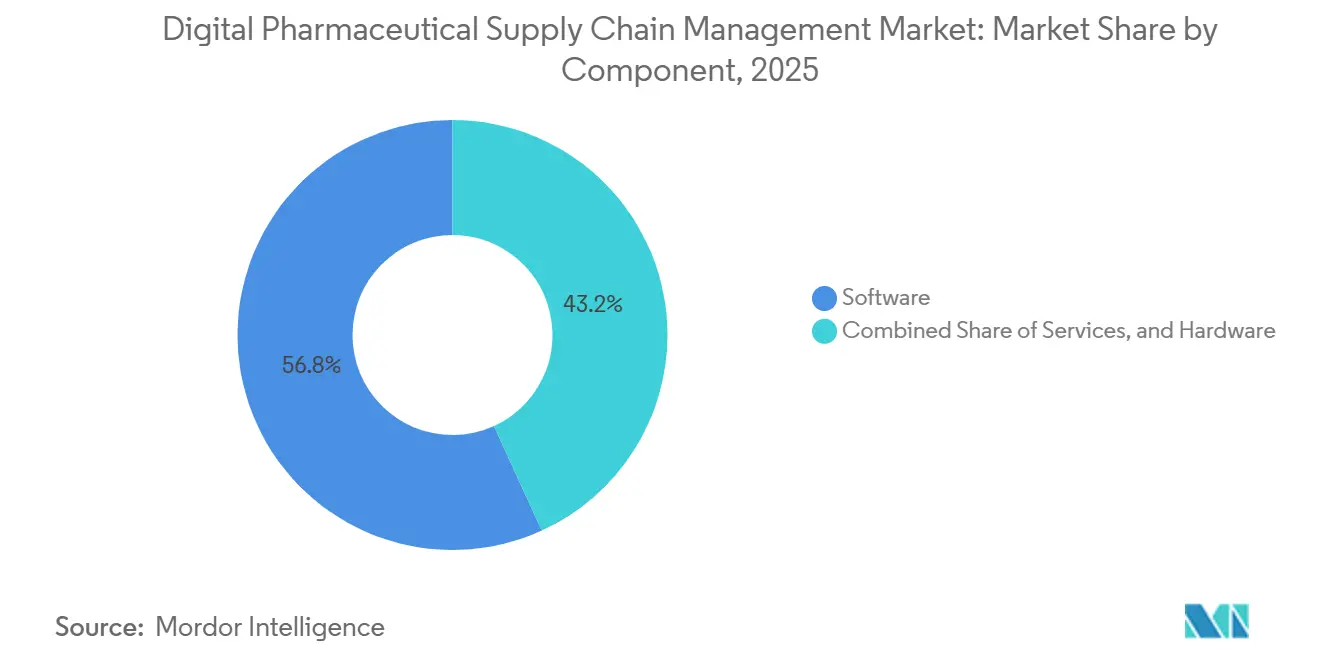
- By component, software is expected to lead with 56.81% of the digital pharmaceutical supply chain management market share in 2025, whereas services are anticipated to advance at a 14.57% CAGR through 2031.
- By application, inventory and warehouse management is projected to hold a 27.47% revenue share in 2025, while drug traceability and serialization are forecasted to be the fastest-growing segment at a 13.28% CAGR through 2031.
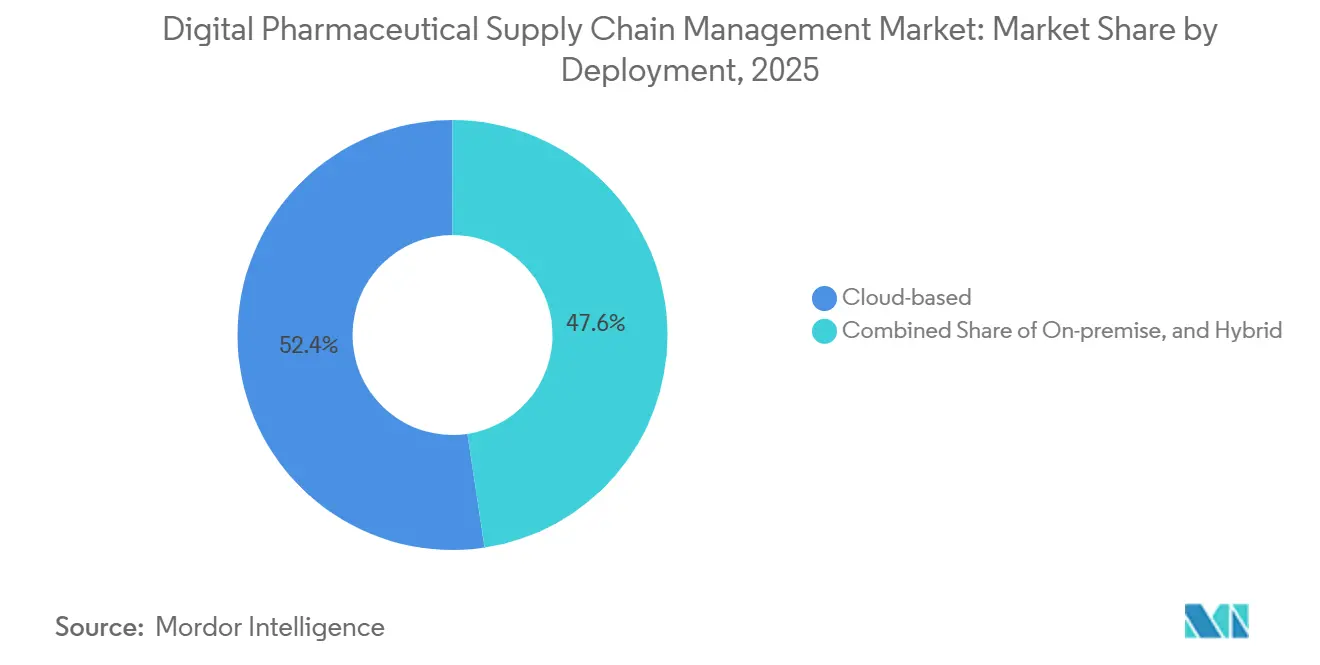
- By deployment, cloud deployments held a dominant 52.38% market share in 2025, while on-premise solutions are expected to expand at a robust 15.62% CAGR from 2026 to 2031.
- By technology, RFID and 2D barcoding technologies captured a combined 34.92% market share in 2025, whereas IoT sensors and edge devices are projected to lead with the highest CAGR of 13.91% in the future.
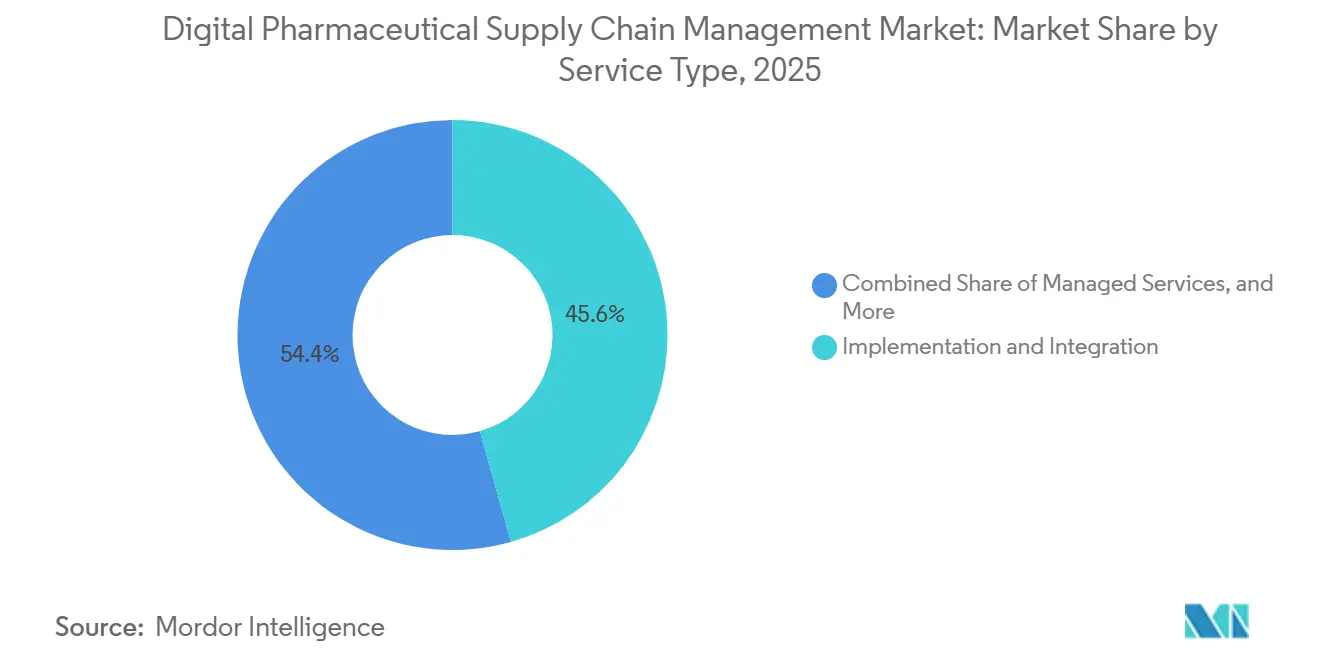
- By service type, implementation and integration services commanded a significant 45.62% market share in 2025, whereas managed services are anticipated to grow at a 15.24% CAGR through 2031.
- By end user, pharmaceutical companies represented 52.45% of the digital pharmaceutical supply chain management market in 2025, whereas contract manufacturing organizations are forecast to achieve the fastest growth with a 12.92% CAGR.
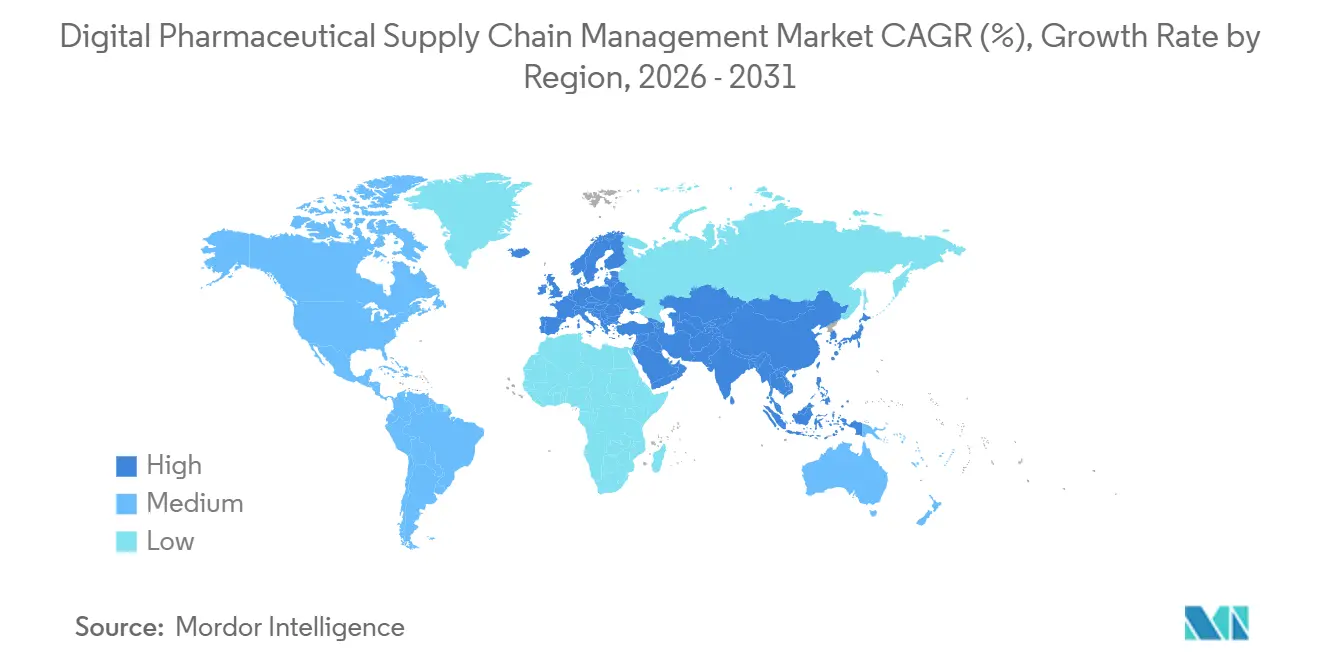
- By region, North America dominated with a 36.65% market share in 2025, whereas Asia-Pacific is expected to record the fastest regional CAGR of 16.59% through 2031.
Note: Market size and forecast figures in this report are generated using Mordor Intelligence’s proprietary estimation framework, updated with the latest available data and insights as of January 2026.
Global Digital Pharmaceutical Supply Chain Management Market Trends and Insights
Drivers Impact Analysis*
| Driver | (~) % Impact on CAGR Forecast | Geographic Relevance | Impact Timeline |
|---|---|---|---|
| Rising Pharmaceutical Serialization & Track-and-Trace Mandates | +2.5% | Global, with North America and Europe leading enforcement | Medium term (2-4 years) |
| Cloud-Native & AI-Driven Supply-Chain Orchestration | +2.8% | Global, with early adoption in North America and Western Europe | Short term (≤ 2 years) |
| Growth of Biologics, Cell-&-Gene Therapies Requiring Cold-Chain | + 2.2% | North America, Europe, and Asia-Pacific hubs (Singapore, South Korea) | Long term (≥ 4 years) |
| Near-Shoring & Dual-Sourcing of API/Finished-Dose Production | +1.9% | North America, with spillover to Latin America and Middle East | Short term (≤ 2 years) |
| Surge in DSCSA Interoperability & EPCIS 1.2 Deployments | + 1.9% | North America, with spillover to Latin America and Middle East | Short term (≤ 2 years) |
| ESG-Linked Supply-Chain Financing Incentives | +1.3% | Europe and North America, with emerging adoption in Asia-Pacific | Long term (≥ 4 years) |
| Source: Mordor Intelligence | |||
Rising Pharmaceutical Serialization & Track-and-Trace Mandates
Global regulators are tightening unit-level serialization rules, compelling manufacturers and distributors to upgrade legacy pedigree platforms to cloud-ready, GS1-compliant solutions before the November 2027 DSCSA interoperability deadline. In 2025, TraceLink reported that 323 contract manufacturing organizations were in active EPCIS testing, while 100 reached production-ready status, signaling an industry-wide sprint toward standardized partner onboarding.[1]TraceLink, “OPUS Platform for CMOs,” SAP and Oracle secured multiple early adopter contracts for their serialization suites, marking an enterprise software replacement cycle as firms abandon proprietary barcodes for 2D data matrices. Divergent regional standards intensify complexity, prompting distributors that span multiple jurisdictions to adopt multi-tenant platforms able to switch identifiers in real time. Vertical integration is accelerating as wholesalers embed track-and-trace capabilities directly into distribution agreements to retain brand-owner relationships.
Cloud-Native & AI-Driven Supply-Chain Orchestration
Pharmaceutical companies are shifting planning and execution workloads from on-premise ERP stacks to elastic cloud platforms that infuse machine learning into demand forecasting and inventory optimization. Sanofi’s AI-enabled tool averted USD 300 million in revenue risk in 2025 by flagging low-stock events with 80% accuracy, cutting expedited freight costs by up to 28%. Pfizer used a digital twin to unlock more than 3 million extra doses without brick-and-mortar expansion. Roche paired NVIDIA GPUs with lab-in-the-loop workflows to simulate manufacturing steps, signaling a pivot toward compute-rich factories. Generative AI tools such as AstraZeneca’s AskAZ cut manual lab-request coordination by 30,000 hours in 2025, showing that conversational agents can collapse procurement cycles into a same-day activity. For patient-specific cell-and-gene therapies, SAP’s orchestration release now coordinates apheresis bookings, viral vector runs, and hospital infusions along a contiguous chain of custody.
Growth of Biologics, Cell-&-Gene Therapies Requiring Cold-Chain
Cryoport opened a 55,000-square-foot hub in Paris to meet EU demand, while Cencora committed USD 1 billion to upgrade U.S. cryogenic storage. World Courier grew its cryogenic depot network to 22 global sites, each fitted with IoT telemetry that sends five-minute interval alerts to control towers. The cold chain is bifurcating: high-volume biologics tolerate 2–8 °C shipping, whereas ultra-low-temperature cell therapies ride in vapor-phase shippers at –196 °C, spawning niche last-mile fleets such as Frontier Scientific Services’ trans-Atlantic gateway that trims customs dwell time.
This bifurcation is creating white-space opportunities for regional logistics providers that can offer last-mile cryogenic delivery in secondary markets, as evidenced by Frontier Scientific Services' USD 1.5 billion Foreign Trade Zone gateway linking Wilmington, Delaware, and Shannon, Ireland, to reduce customs dwell time for transatlantic cell-therapy shipments.
Surge in DSCSA Interoperability & EPCIS 1.2 Deployments
As the 2027 verification clock ticks, wholesalers are swapping proprietary e-pedigree tools for EPCIS 1.2 messaging hubs delivered as managed SaaS. IBM’s Pulse processed more than 1 million verification calls in 2024, while TraceLink onboarded 100 CMOs to production-ready serialization in 2025. Oracle’s Life Sciences AI Data Platform, launched in 2026, slashed false-positive identifier failures by 40% during pilot phases. Commoditization of base serialization flips competitive levers toward data-quality scoring and integration speed. New financing products now advance cash upon serialization upload instead of physical receipt, cutting conversion cycles by up to 20 days for emerging biotech firms.
Restraints Impact Analysis*
| Restraint | (~) % Impact on CAGR Forecast | Geographic Relevance | Impact Timeline |
|---|---|---|---|
| High integration & change-management costs | -1.4% | Global, with acute impact in mid-tier pharmaceutical companies | Medium term (2-4 years) |
| Cyber-security risk in connected logistics networks | -1.1% | Global, with heightened exposure in North America and Europe | Short term (≤ 2 years) |
| Legacy IT & Data-Silo Technical Debt | -1.0% | North America and Europe, particularly in established pharmaceutical companies | Medium term (2-4 years) |
| Cyber-Security Risk in Connected Logistics Networks | -1.1% | Global, with heightened exposure in North America and Europe | Short term (≤ 2 years) |
| Source: Mordor Intelligence | |||
High Integration & Change-Management Costs
Moving from legacy manufacturing execution systems to cloud stacks can cost between USD 5 million and USD 50 million, with validation cycles stretching 18–36 months under FDA 21 CFR Part 11 and EU Annex 11. Chanelle Pharma expects 14 months of dual-run operations during its S/4HANA upgrade, illustrating the operational risk burden on smaller firms. CMOs shoulder an asymmetric load because they must keep interfaces live for dozens of brand owners, each with its own aggregation hierarchy. This pressure triggers consolidation as sub-scale CMOs lose bids to rivals offering turnkey EPCIS compliance. Consumption-based pricing from TraceLink, Optel, and Körber spreads integration costs across transaction volumes, easing capital strain but increasing dependency on outsourced operators.
Cyber-Security Risk in Connected Logistics Networks
Ransomware incidents climbed 40% year over year in 2025, halting production lines and delaying oncology drug shipments. A Swiss plant lost 17 days of output and USD 9.8 million after servers were encrypted.[2]SwissInfo, “Pharma Ransomware Incident Halts Production,” Prinston Pharmaceutical, Inotiv, and Nang Kuang each suffered data exfiltration attacks that leveraged vulnerabilities in third-party logistics APIs. Cyber-insurance premiums surged 60–80%, with underwriters now mandating multi-factor authentication and segmented networks. IBM’s watsonx reduced incident triage time by 95% in pilot deployments, but manufacturers are increasingly turning to hardware-rooted security enclaves like those inside Roche’s NVIDIA factory to block lateral malware movement. Zero-trust architectures add cost and latency, yet remain non-negotiable for regulators and insurers alike.
*Our forecasts treat driver/restraint impacts as directional, not additive. The impact forecasts reflect baseline growth, mix effects, and variable interactions.
Segment Analysis
By Component: Software Dominance Amid Services Surge
Software captured 56.81% digital pharmaceutical supply chain management market share in 2025 as enterprises favored feature-rich serialization suites that comply with global data-residency rules. Services, though smaller, are advancing at a 14.57% CAGR and are projected to account for a growing slice of the digital pharmaceutical supply chain management market size by 2031 because vendors roll hardware, licenses, and change-management into single per-unit fees. Hardware trails yet gains from embedded IoT sensors that feed real-time cold-chain data to cloud dashboards, minimizing spoilage risk.
SAP, Oracle, and IBM are steering software toward cloud-native formats that deploy anomaly detection and predictive maintenance, while TraceLink bundles 99.9% uptime SLAs into managed contracts, shifting cyber-liability away from drug makers. Hardware growth clusters around cryogenic depots like Cryoport’s Paris center, where sensor-rich freezers stream telemetry at five-minute intervals. The divergence signals a long-term migration from capital purchases to pay-as-you-go services that scale with product volumes.


By Application: Traceability Outpaces Inventory Management
Inventory and warehouse management held 27.47% of 2025 revenues, yet drug traceability and serialization are forecast to log a 13.28% CAGR and become the fastest-growing slice of the digital pharmaceutical supply chain management market size between 2026 and 2031. Transportation modules benefit from biologics cold-chain demand, while AI-driven demand-planning engines secure executive attention after Sanofi’s cost-avoidance case study.
The serialization boom reflects a one-time compliance shock as firms scrap proprietary e-pedigree tools in favor of GS1 DataMatrix and EPCIS 1.2 flows. Vendors compete on onboarding speed, with TraceLink cutting CMO partner ramp-up windows to six months. Warehouse solutions now embed dynamic slotting algorithms that adapt to real-time order queues, whereas transportation modules differentiate on minute-by-minute temperature visibility via Controlant Saga cards.
By Deployment: On-Premise Rebounds Despite Cloud Lead
Cloud hosted 52.38% of the digital pharmaceutical supply chain management market in 2025, yet on-premise deployments are slated for a 15.62% CAGR through 2031 as EU and Japanese regulators push data-sovereignty clauses. Hybrid models bridge the gap, hosting serialization in public clouds but retaining manufacturing execution systems behind corporate firewalls.
Chanelle Pharma’s migration keeps execution servers on site while shifting orchestration to AWS, showcasing a two-tier pattern.[3]SAP SE, “Advanced Track & Trace for Pharmaceuticals,” Roche’s Blackwell GPU farm further proves that on-premise can coexist with AI-rich workloads when intellectual property protection trumps opex savings. Cloud leaders counter by offering per-transaction fees to avoid idle capacity costs during demand slumps.
By Technology: RFID and Barcoding Foundation, Blockchain Niche
RFID and 2D barcoding underpinned 34.92% share in 2025, forming the compliance floor of the digital pharmaceutical supply chain management market. IoT sensors and edge devices, however, top growth charts at 13.91% CAGR as cryogenic couriers deploy battery-efficient loggers that roam across cellular networks without data loss.
Advanced analytics and AI platforms receive the highest incremental spend given Sanofi’s USD 300 million risk-avoidance, Pfizer’s dose-expansion twin, and Roche’s GPU factory. Blockchain trials remain pilot-scale due to throughput and governance hurdles; centralized repositories meet DSCSA guidance without distributed consensus overhead.
By Service Type: Implementation Gives Way to Managed Services
Implementation and integration commanded 45.62% share in 2025 because many firms raced to modernize before the 2027 deadlines. Managed services, pegged for 15.24% CAGR growth, are projected to overtake as enterprises prefer transaction pricing linked to actual serialization volumes, shrinking fixed overheads.
TraceLink has already onboarded 100 CMOs under managed contracts, bundling software, hardware, and cyber-monitoring in one fee. Consulting remains steady yet increasingly embedded inside recurring agreements that promise annual health checks instead of one-off workshops. As a result, implementation-centric integrators face margin pressure while MSPs scale multi-tenant platforms.
By End User: CMOs Accelerate Faster Than Brand Owners
Pharmaceutical companies dominated 52.45% share in 2025, yet CMOs register the highest CAGR at 12.92% because brand owners push compliance duties downstream. Biotechnology firms, often born cloud-native, adopt greenfield solutions without legacy drag, accelerating time to first commercial lot.
Pfizer, Roche, Sanofi, and AstraZeneca exemplify large-scale AI adoption, whereas CMOs consolidate on TraceLink OPUS and Körber multi-tenant stacks that serve dozens of clients without isolated instances. Vendors now court CMOs aggressively because one deployment unlocks access to many upstream manufacturers.
Geography Analysis
North America held 36.65% of 2025 revenue and remains the anchor of the digital pharmaceutical supply chain management market due to DSCSA enforcement plus USD 13.6 billion in pharma IT outlays.[4]Pharmaceutical Technology, “Global Manufacturing Investments,” IBM’s Pulse already fields more than 1 million verification calls annually and TraceLink’s CMO network solidifies the region’s leadership. Near-shoring pushes investments into Canada and Mexico, while ESG-linked financing, such as Energize’s power purchase pact, drives sustainability metrics into sourcing decisions.
Asia-Pacific delivers the fastest CAGR at 16.59%, led by large-ticket biologics projects from Pfizer Wuhan, Takeda Osaka, and Samsung Biologics Songdo. India’s USD 3 billion incentive pipeline plus Japan’s preference for on-premise execution shapes the regional deployment mix. Cryogenic networks expand to service growing cell-therapy corridors, with Cryoport and World Courier adding depots in Singapore and Melbourne.
Europe benefits from the Critical Medicines Act and Falsified Medicines Directive, posting a significant share while leaning toward hybrid deployments to meet data-residency rules. Novo Nordisk, Sanofi, and AstraZeneca pour more than USD 10 billion combined into capacity, while banks finance green warehouses in Egypt and Saudi Arabia to shore up regional resiliency. South America edges forward as ANVISA aligns serialization codes with United States and European Union frameworks, though adoption pace lags due to integration cost barriers.

Competitive Landscape
SAP, Oracle, and IBM vie with serialization pure-plays TraceLink, Optel, Antares Vision, and Körber for cloud orchestration dominance. Logistics majors UPS Healthcare, McKesson, and Cardinal Health package last-mile services with software dashboards, aiming to provide wall-to-wall visibility. Strategic levers now revolve around AI-infused demand sensing, managed-service SLAs that offload cyber risk, and multi-tenant CMO portals that collapse onboarding time.
White-space remains in hybrid architectures where MES and batch records stay on site while planning functions migrate to the cloud. Cryogenic last-mile specialists such as Frontier Scientific Services exploit gaps in secondary cities underserved by global carriers. Meanwhile, banks pitch ESG-linked loans at favorable spreads, nudging vendors to integrate carbon trackers directly into orchestration layers.
Digital Pharmaceutical Supply Chain Management Industry Leaders
IBM Corporation
Optel Group
Oracle Corporation
SAP SE
TraceLink, Inc.
- *Disclaimer: Major Players sorted in no particular order

Recent Industry Developments
- February 2026: SAP confirmed general availability for supply chain orchestration and logistics management modules in 2026, adding real-time visibility plus predictive analytics for multi-tier networks.
- January 2026: Oracle unveiled the Life Sciences AI Data Platform, cutting serialization anomaly false-positives by 40% during pilots.
- October 2025: Cryoport opened its Paris global supply chain center to bolster EU cell-therapy logistics.


Global Digital Pharmaceutical Supply Chain Management Market Report Scope
As per the scope of the report, digital pharmaceutical supply chain management refers to the use of digital technologies such as cloud computing, AI/ML, IoT, blockchain, and analytics to manage and optimize the end-to-end pharmaceutical supply chain. It enables real-time visibility, tracking, and coordination across drug manufacturing, storage, distribution, and delivery. The system improves efficiency, ensures regulatory compliance, and reduces risks such as counterfeit drugs and supply disruptions.
The digital pharmaceutical supply chain management market is segmented by component, application, deployment, technology, service type, end user, and geography. By component, the market is segmented into software, services, and hardware. By application, the market is segmented into inventory & warehouse management, drug traceability & serialization, transportation & logistics management, demand forecasting & planning, compliance & risk management, and others. By deployment, the market is segmented into cloud-based, on-premise, and hybrid. By technology, the market is segmented into RFID & 2D barcoding, IoT sensors & edge devices, blockchain & distributed ledger, advanced analytics & AI/ML, and others. By service type, the market is segmented into implementation & integration, managed services, consulting & training, and others. By end user, the market is segmented into pharmaceutical companies, biotechnology companies, contract manufacturing organizations, and others. By geography, the market is segmented into North America, Europe, Asia-Pacific, the Middle East and Africa, and South America. The market report also covers estimated market sizes and market trends for 17 countries across major regions worldwide. The report offers market value (in USD) for the above segments.
| Software |
| Services |
| Hardware |
| Inventory & Warehouse Management |
| Drug Traceability & Serialization |
| Transportation & Logistics Management |
| Demand Forecasting & Planning |
| Compliance & Risk Management |
| Others |
| Cloud-based |
| On-premise |
| Hybrid |
| RFID & 2D Barcoding |
| IoT Sensors & Edge Devices |
| Blockchain & Distributed Ledger |
| Advanced Analytics & AI/ML |
| Others |
| Implementation & Integration |
| Managed Services |
| Consulting & Training |
| Others |
| Pharmaceutical Companies |
| Biotechnology Companies |
| Contract Manufacturing Organizations (CMOs) |
| Others |
| North America | United States |
| Canada | |
| Mexico | |
| Europe | Germany |
| United Kingdom | |
| France | |
| Italy | |
| Spain | |
| Rest of Europe | |
| Asia-Pacific | China |
| India | |
| Japan | |
| Australia | |
| South Korea | |
| Rest of Asia-Pacific | |
| Middle East and Africa | GCC |
| South Africa | |
| Rest of Middle East and Africa | |
| South America | Brazil |
| Argentina | |
| Rest of South America |
| By Component | Software | |
| Services | ||
| Hardware | ||
| By Application | Inventory & Warehouse Management | |
| Drug Traceability & Serialization | ||
| Transportation & Logistics Management | ||
| Demand Forecasting & Planning | ||
| Compliance & Risk Management | ||
| Others | ||
| By Deployment | Cloud-based | |
| On-premise | ||
| Hybrid | ||
| By Technology | RFID & 2D Barcoding | |
| IoT Sensors & Edge Devices | ||
| Blockchain & Distributed Ledger | ||
| Advanced Analytics & AI/ML | ||
| Others | ||
| By Service Type | Implementation & Integration | |
| Managed Services | ||
| Consulting & Training | ||
| Others | ||
| By End User | Pharmaceutical Companies | |
| Biotechnology Companies | ||
| Contract Manufacturing Organizations (CMOs) | ||
| Others | ||
| By Geography | North America | United States |
| Canada | ||
| Mexico | ||
| Europe | Germany | |
| United Kingdom | ||
| France | ||
| Italy | ||
| Spain | ||
| Rest of Europe | ||
| Asia-Pacific | China | |
| India | ||
| Japan | ||
| Australia | ||
| South Korea | ||
| Rest of Asia-Pacific | ||
| Middle East and Africa | GCC | |
| South Africa | ||
| Rest of Middle East and Africa | ||
| South America | Brazil | |
| Argentina | ||
| Rest of South America | ||


Key Questions Answered in the Report
What is the current size of the digital pharmaceutical supply chain management market?
The market was USD 1.35 billion in 2026 and is projected to reach USD 2.41 billion by 2031.
Which component leads spending today?
Software held 56.81% share in 2025, though managed services are growing faster and will narrow the gap by 2031.
How fast will drug traceability applications grow?
Drug traceability and serialization applications are forecast to post a 13.28% CAGR through 2031 on the back of DSCSA and FMD deadlines.
Which region will expand the quickest?
Asia-Pacific is expected to record a 16.59% CAGR thanks to large biologics capacity projects in China, India, Japan, and South Korea.
Why are CMOs adopting these platforms rapidly?
Brand owners now transfer serialization liability downstream, driving CMO platform usage at a 12.92% CAGR as detailed.
What security measures are firms prioritizing?
Zero-trust network segmentation, multi-factor authentication, and hardware-rooted security enclaves are now required by most cyber-insurers.
Page last updated on:


